GBPJPY H4 | Heading into 50% Fibonacci resistanceGBP/JPY is rising towards the sell entry at 197.42, which has been identified as a pullback resistance that aligns with the 50% Fibonacci retracement and could reverse to the downside.
Stop loss is at 199.25, which is a swing high resistance.
Take profit is at 195.26, which is a swing low support.
High Risk Investment Warning
Trading Forex/CFDs on margin carries a high level of risk and may not be suitable for all investors. Leverage can work against you.
Stratos Markets Limited (tradu.com ):
CFDs are complex instruments and come with a high risk of losing money rapidly due to leverage. 65% of retail investor accounts lose money when trading CFDs with this provider. You should consider whether you understand how CFDs work and whether you can afford to take the high risk of losing your money.
Stratos Europe Ltd (tradu.com ):
CFDs are complex instruments and come with a high risk of losing money rapidly due to leverage. 66% of retail investor accounts lose money when trading CFDs with this provider. You should consider whether you understand how CFDs work and whether you can afford to take the high risk of losing your money.
Stratos Global LLC (tradu.com ):
Losses can exceed deposits.
Please be advised that the information presented on TradingView is provided to Tradu (‘Company’, ‘we’) by a third-party provider (‘TFA Global Pte Ltd’). Please be reminded that you are solely responsible for the trading decisions on your account. There is a very high degree of risk involved in trading. Any information and/or content is intended entirely for research, educational and informational purposes only and does not constitute investment or consultation advice or investment strategy. The information is not tailored to the investment needs of any specific person and therefore does not involve a consideration of any of the investment objectives, financial situation or needs of any viewer that may receive it. Kindly also note that past performance is not a reliable indicator of future results. Actual results may differ materially from those anticipated in forward-looking or past performance statements. We assume no liability as to the accuracy or completeness of any of the information and/or content provided herein and the Company cannot be held responsible for any omission, mistake nor for any loss or damage including without limitation to any loss of profit which may arise from reliance on any information supplied by TFA Global Pte Ltd.
The speaker(s) is neither an employee, agent nor representative of Tradu and is therefore acting independently. The opinions given are their own, constitute general market commentary, and do not constitute the opinion or advice of Tradu or any form of personal or investment advice. Tradu neither endorses nor guarantees offerings of third-party speakers, nor is Tradu responsible for the content, veracity or opinions of third-party speakers, presenters or participants.
Gbp-jpy
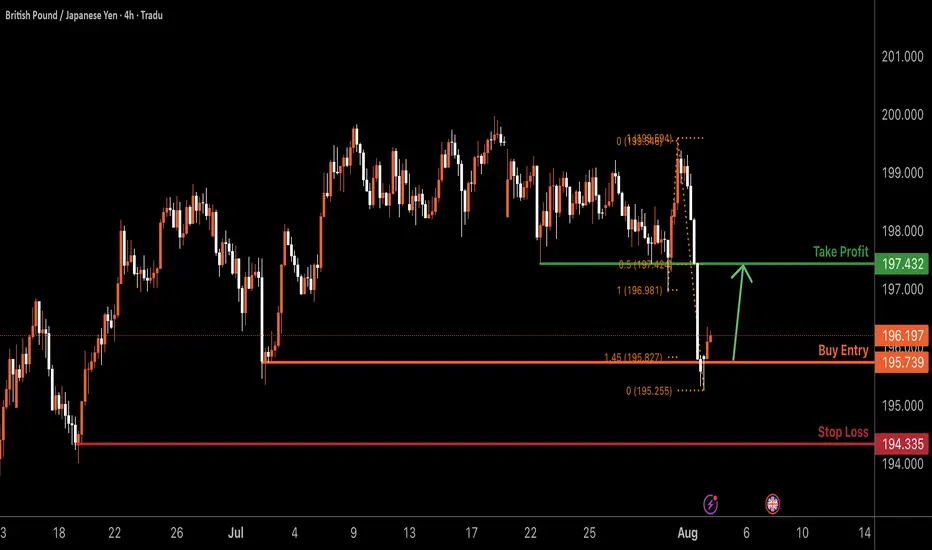
GBPJPY H4 | Bullish bounce offGBP/JPY has bounced off the buy entry, which has been identified as a swing low support and could potentially rise from this level to the take profit.
Buy entry is at 195.73, which is a swing low support that lines up with the 145% Fibonacci extension.
Stop loss is at 194.33, which is a swing low support.
Take profit is at 197.43, which is a pullback resistance that aligns with the 50% Fibonacci retracement.
High Risk Investment Warning
Trading Forex/CFDs on margin carries a high level of risk and may not be suitable for all investors. Leverage can work against you.
Stratos Markets Limited (tradu.com ):
CFDs are complex instruments and come with a high risk of losing money rapidly due to leverage. 65% of retail investor accounts lose money when trading CFDs with this provider. You should consider whether you understand how CFDs work and whether you can afford to take the high risk of losing your money.
Stratos Europe Ltd (tradu.com ):
CFDs are complex instruments and come with a high risk of losing money rapidly due to leverage. 66% of retail investor accounts lose money when trading CFDs with this provider. You should consider whether you understand how CFDs work and whether you can afford to take the high risk of losing your money.
Stratos Global LLC (tradu.com ):
Losses can exceed deposits.
Please be advised that the information presented on TradingView is provided to Tradu (‘Company’, ‘we’) by a third-party provider (‘TFA Global Pte Ltd’). Please be reminded that you are solely responsible for the trading decisions on your account. There is a very high degree of risk involved in trading. Any information and/or content is intended entirely for research, educational and informational purposes only and does not constitute investment or consultation advice or investment strategy. The information is not tailored to the investment needs of any specific person and therefore does not involve a consideration of any of the investment objectives, financial situation or needs of any viewer that may receive it. Kindly also note that past performance is not a reliable indicator of future results. Actual results may differ materially from those anticipated in forward-looking or past performance statements. We assume no liability as to the accuracy or completeness of any of the information and/or content provided herein and the Company cannot be held responsible for any omission, mistake nor for any loss or damage including without limitation to any loss of profit which may arise from reliance on any information supplied by TFA Global Pte Ltd.
The speaker(s) is neither an employee, agent nor representative of Tradu and is therefore acting independently. The opinions given are their own, constitute general market commentary, and do not constitute the opinion or advice of Tradu or any form of personal or investment advice. Tradu neither endorses nor guarantees offerings of third-party speakers, nor is Tradu responsible for the content, veracity or opinions of third-party speakers, presenters or participants.
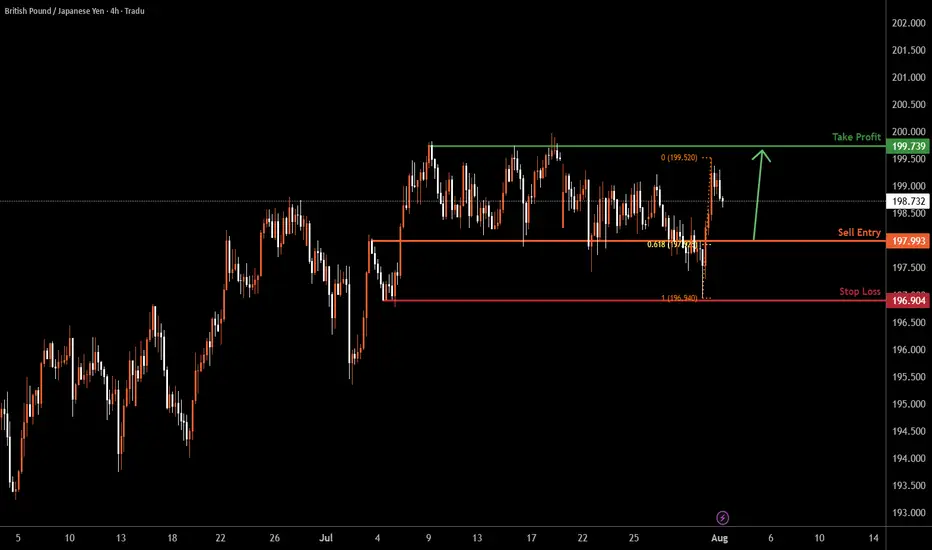
GBP/JPY H4 | Bullish bounce offGBP/JPY is falling towards the buy entry, which is an overlap support that lines up with the 61.8% Fibonacci retracement and could bounce to the take profit.
Buy entry is at 197.99, which is an overlap support that aligns with the 61.8% Fibonacci retracement.
Stop loss is at 196.90, which is a swing low support.
Take profit is at 199.73, which is a multi-swing high resistance.
High Risk Investment Warning
Trading Forex/CFDs on margin carries a high level of risk and may not be suitable for all investors. Leverage can work against you.
Stratos Markets Limited (tradu.com ):
CFDs are complex instruments and come with a high risk of losing money rapidly due to leverage. 65% of retail investor accounts lose money when trading CFDs with this provider. You should consider whether you understand how CFDs work and whether you can afford to take the high risk of losing your money.
Stratos Europe Ltd (tradu.com ):
CFDs are complex instruments and come with a high risk of losing money rapidly due to leverage. 66% of retail investor accounts lose money when trading CFDs with this provider. You should consider whether you understand how CFDs work and whether you can afford to take the high risk of losing your money.
Stratos Global LLC (tradu.com ):
Losses can exceed deposits.
Please be advised that the information presented on TradingView is provided to Tradu (‘Company’, ‘we’) by a third-party provider (‘TFA Global Pte Ltd’). Please be reminded that you are solely responsible for the trading decisions on your account. There is a very high degree of risk involved in trading. Any information and/or content is intended entirely for research, educational and informational purposes only and does not constitute investment or consultation advice or investment strategy. The information is not tailored to the investment needs of any specific person and therefore does not involve a consideration of any of the investment objectives, financial situation or needs of any viewer that may receive it. Kindly also note that past performance is not a reliable indicator of future results. Actual results may differ materially from those anticipated in forward-looking or past performance statements. We assume no liability as to the accuracy or completeness of any of the information and/or content provided herein and the Company cannot be held responsible for any omission, mistake nor for any loss or damage including without limitation to any loss of profit which may arise from reliance on any information supplied by TFA Global Pte Ltd.
The speaker(s) is neither an employee, agent nor representative of Tradu and is therefore acting independently. The opinions given are their own, constitute general market commentary, and do not constitute the opinion or advice of Tradu or any form of personal or investment advice. Tradu neither endorses nor guarantees offerings of third-party speakers, nor is Tradu responsible for the content, veracity or opinions of third-party speakers, presenters or participants.
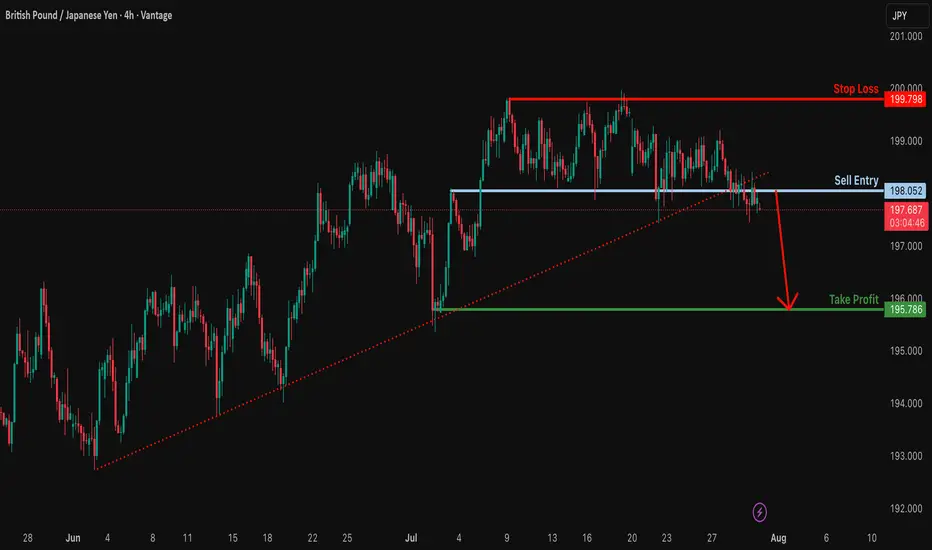
Potential bearish drop?GBP/JPY is reacting off the resitance level which is anoverlap resistance and could drop from this level to our takeprofit.
Entry: 198.05
Why we like it:
There is anoverlap support.
Stop loss: 199.79
Why we like it:
There is a multi swing high resistance.
Take profit: 195.78
Why we like it:
There is a swing low support.
Enjoying your TradingView experience? Review us!
Please be advised that the information presented on TradingView is provided to Vantage (‘Vantage Global Limited’, ‘we’) by a third-party provider (‘Everest Fortune Group’). Please be reminded that you are solely responsible for the trading decisions on your account. There is a very high degree of risk involved in trading. Any information and/or content is intended entirely for research, educational and informational purposes only and does not constitute investment or consultation advice or investment strategy. The information is not tailored to the investment needs of any specific person and therefore does not involve a consideration of any of the investment objectives, financial situation or needs of any viewer that may receive it. Kindly also note that past performance is not a reliable indicator of future results. Actual results may differ materially from those anticipated in forward-looking or past performance statements. We assume no liability as to the accuracy or completeness of any of the information and/or content provided herein and the Company cannot be held responsible for any omission, mistake nor for any loss or damage including without limitation to any loss of profit which may arise from reliance on any information supplied by Everest Fortune Group.
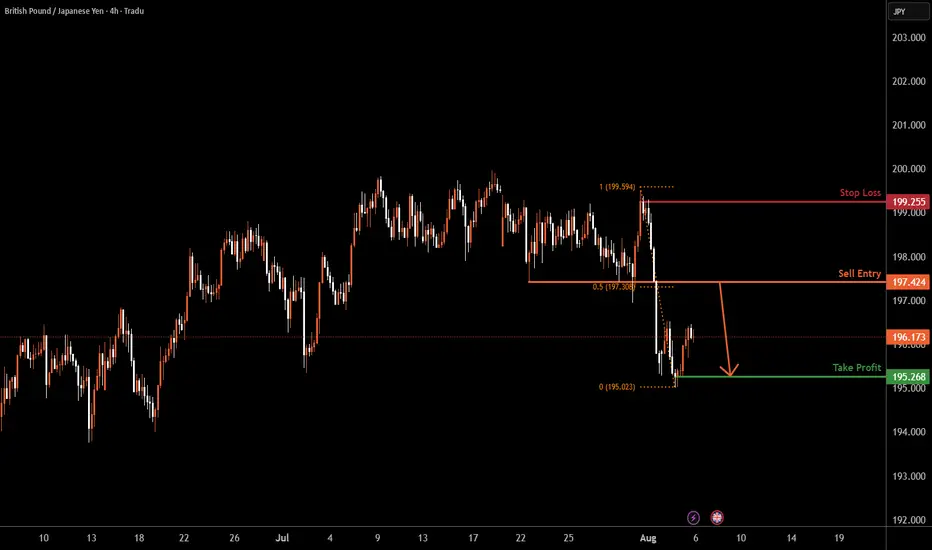
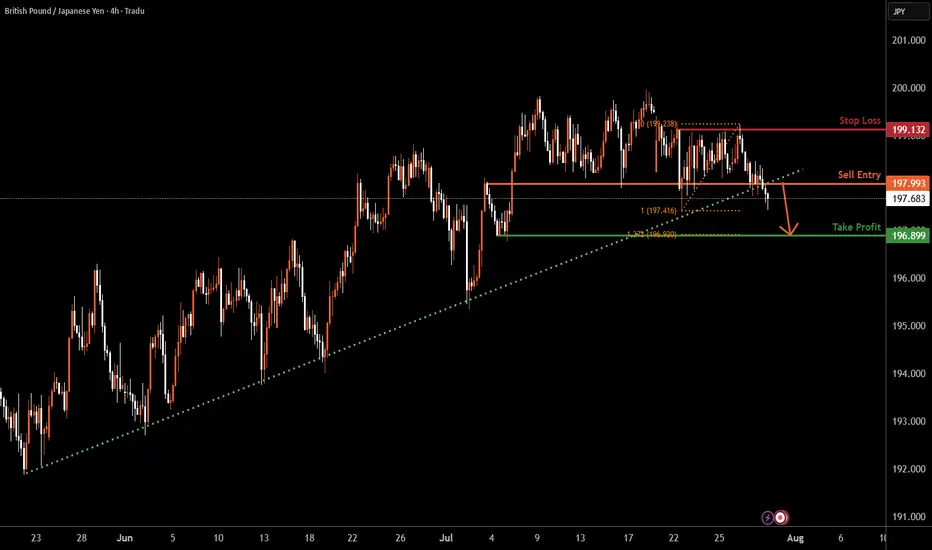
GBPJPY H4 | Bearish dropGBP/JPY has broken below the support level, which is an overlap support. A potential pullback to the sell entry, followed by a reversal, could lead to a further price drop.
Sell entry is at 197.99, which is an overlap resistance.
Stop loss is at 199.13, which is a pullback resistance.
Take profit is at 196.89, which is a swing low support that lines up with the 127.2% Fibonacci extension.
High Risk Investment Warning
Trading Forex/CFDs on margin carries a high level of risk and may not be suitable for all investors. Leverage can work against you.
Stratos Markets Limited (tradu.com ):
CFDs are complex instruments and come with a high risk of losing money rapidly due to leverage. 65% of retail investor accounts lose money when trading CFDs with this provider. You should consider whether you understand how CFDs work and whether you can afford to take the high risk of losing your money.
Stratos Europe Ltd (tradu.com ):
CFDs are complex instruments and come with a high risk of losing money rapidly due to leverage. 66% of retail investor accounts lose money when trading CFDs with this provider. You should consider whether you understand how CFDs work and whether you can afford to take the high risk of losing your money.
Stratos Global LLC (tradu.com ):
Losses can exceed deposits.
Please be advised that the information presented on TradingView is provided to Tradu (‘Company’, ‘we’) by a third-party provider (‘TFA Global Pte Ltd’). Please be reminded that you are solely responsible for the trading decisions on your account. There is a very high degree of risk involved in trading. Any information and/or content is intended entirely for research, educational and informational purposes only and does not constitute investment or consultation advice or investment strategy. The information is not tailored to the investment needs of any specific person and therefore does not involve a consideration of any of the investment objectives, financial situation or needs of any viewer that may receive it. Kindly also note that past performance is not a reliable indicator of future results. Actual results may differ materially from those anticipated in forward-looking or past performance statements. We assume no liability as to the accuracy or completeness of any of the information and/or content provided herein and the Company cannot be held responsible for any omission, mistake nor for any loss or damage including without limitation to any loss of profit which may arise from reliance on any information supplied by TFA Global Pte Ltd.
The speaker(s) is neither an employee, agent nor representative of Tradu and is therefore acting independently. The opinions given are their own, constitute general market commentary, and do not constitute the opinion or advice of Tradu or any form of personal or investment advice. Tradu neither endorses nor guarantees offerings of third-party speakers, nor is Tradu responsible for the content, veracity or opinions of third-party speakers, presenters or participants.
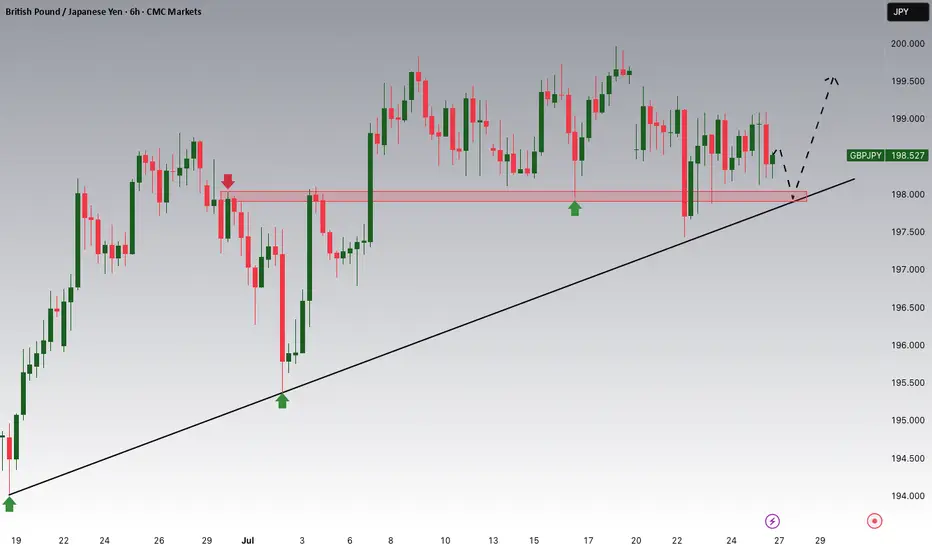
GBPJPY Potential UpsidesHey Traders, in the coming week we are monitoring GBPJPY for a buying opportunity around 197.900 zone, GBPJPY is trading in an uptrend and currently is in a correction phase in which it is approaching the trend at 197.900 support and resistance area.
Trade safe, Joe.
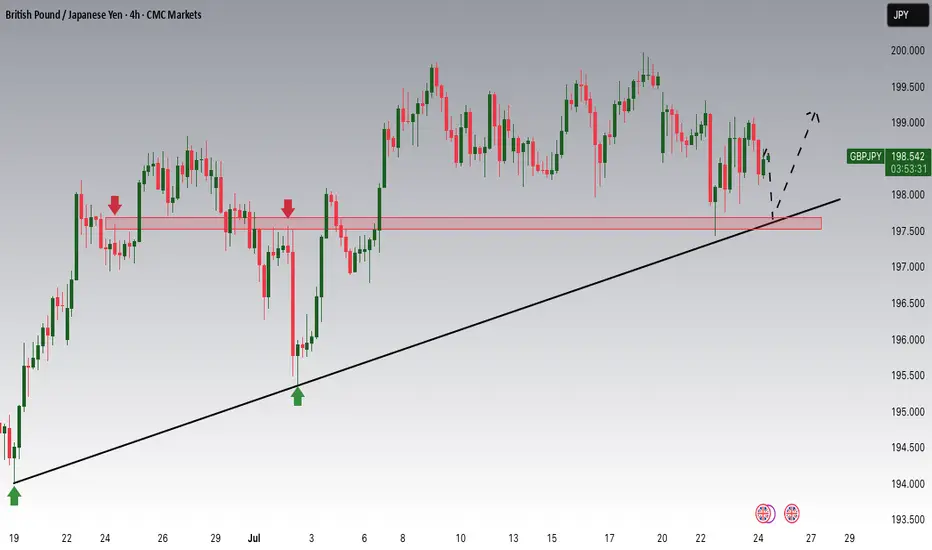
GBPJPY Potential UpsidesHey Traders, in today's trading session we are monitoring GBPJPY for a buying opportunity around 197.700 zone, GBPJPY is trading in an uptrend and currently is in a correction phase in which it is approaching the trend at 197.700 support and resistance area.
Trade safe, Joe.
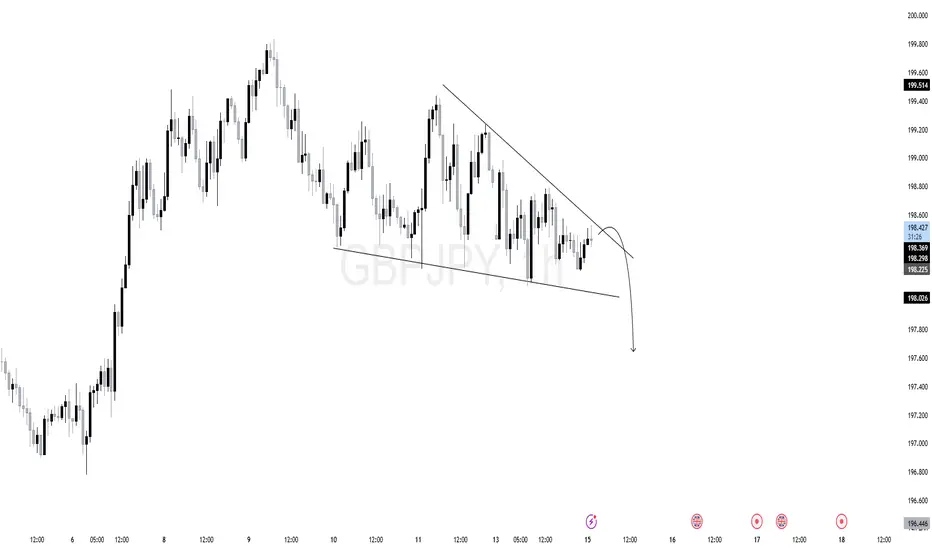
GBPJPY - Trading The Range!Hello TradingView Family / Fellow Traders. This is Richard, also known as theSignalyst.
📈GBPJPY has been hovering within a big range.
This week, GBPJPY is retesting the upper bound of the range and $200 round number.
As long as the resistance holds, we will be looking for shorts on lower timeframes, targeting the lower bound of the range.
📚 Always follow your trading plan regarding entry, risk management, and trade management.
Good luck!
All Strategies Are Good; If Managed Properly!
~Rich
Disclosure: I am part of Trade Nation's Influencer program and receive a monthly fee for using their TradingView charts in my analysis.

$GJ (GBPJPY) 1HPrice is currently forming a descending triangle pattern, with clear lower highs and a horizontal support zone.
Trendline resistance is actively being respected.
Liquidity is likely building below the horizontal support zone.
A false breakout or sweep above the trendline followed by rejection could trigger institutional distribution.
As long as the descending trendline holds, and no bullish BOS occurs, the structure remains bearish. Look for price to accumulate short positions before expansion.
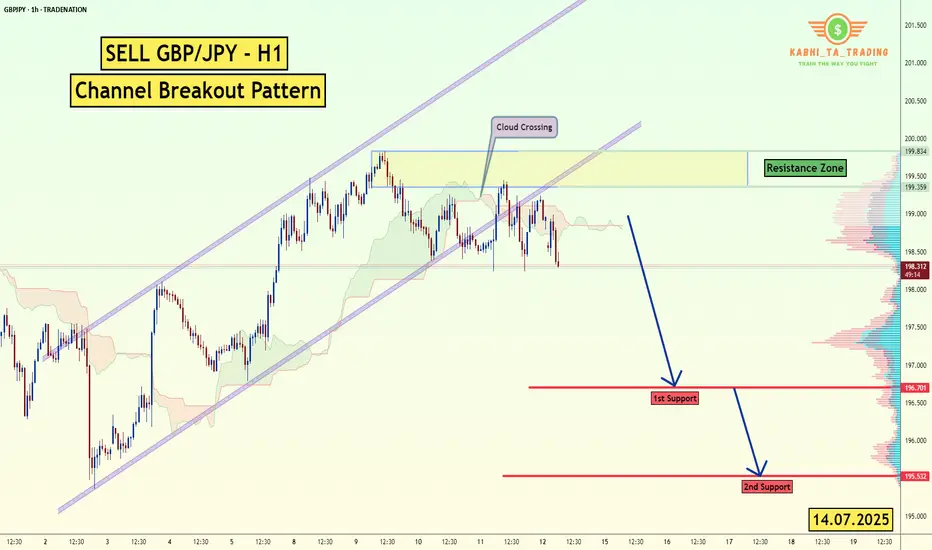
GBP/JPY -H1- Channel Breakout (14.07.2025)The GBP/JPY Pair on the H1 timeframe presents a Potential Selling Opportunity due to a recent Formation of a Channel Breakout Pattern. This suggests a shift in momentum towards the downside in the coming hours.
Possible Short Trade:
Entry: Consider Entering A Short Position around Trendline Of The Pattern.
Target Levels:
1st Support – 196.70
2nd Support – 195.53
🎁 Please hit the like button and
🎁 Leave a comment to support for My Post !
Your likes and comments are incredibly motivating and will encourage me to share more analysis with you.
Best Regards, KABHI_TA_TRADING
Thank you.
Disclosure: I am part of Trade Nation's Influencer program and receive a monthly fee for using their TradingView charts in my analysis.
GBP/JPY) Bearish Analysis Read The captionSMC trading point update
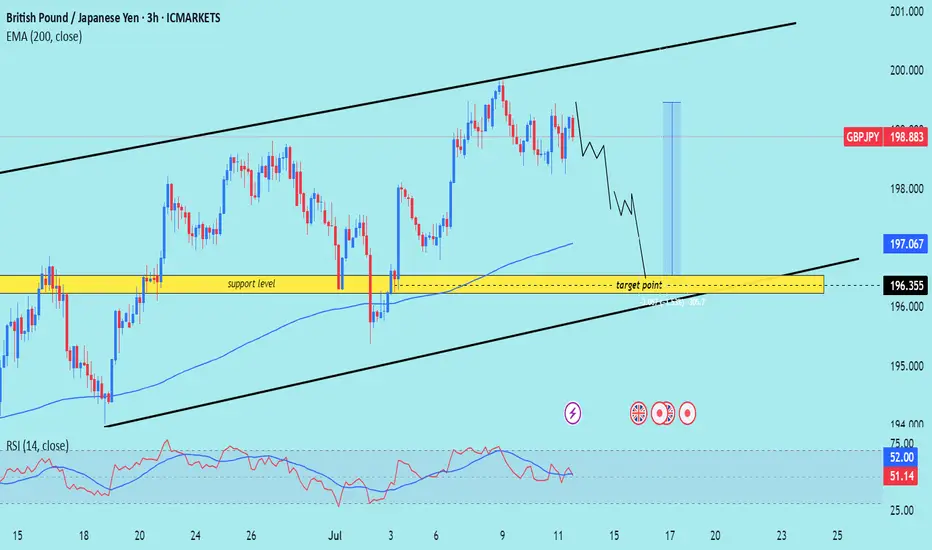
Technical analysis of GBP/JPY on the 3-hour timeframe, suggesting a potential short-term pullback within a larger ascending channel.
---
Analysis Summary
Pair: GBP/JPY
Timeframe: 3H
Current Price: 198.883
Bias: Bearish move toward channel support
---
Key Technical Insights
1. Ascending Channel Formation:
Price is moving within an upward-sloping channel.
Current structure suggests price is heading toward the lower trendline support.
2. Support Level & Target Zone:
The yellow zone around 196.355 is a major support area and target point, coinciding with both structural support and the bottom of the channel.
3. EMA (200 Close):
Price is still above the 200 EMA (197.067), so overall trend remains bullish — but current move is a correction.
4. RSI (14):
RSI is neutral near 51.14, allowing room for further downward movement before becoming oversold.
---
Target Point
Target: 196.355 (support zone and bottom of channel)
---
Trade Idea
Direction Entry Stop-Loss Target
Sell 198.80–199.00 Above 199.70 196.35
SMC trading point
---
Summary
GBP/JPY is likely to retrace toward support at 196.35 before possibly bouncing within the larger bullish structure. This offers a short-term selling opportunity, with potential buy setups near the lower trendline later.
Please support boost 🚀 this analysis)
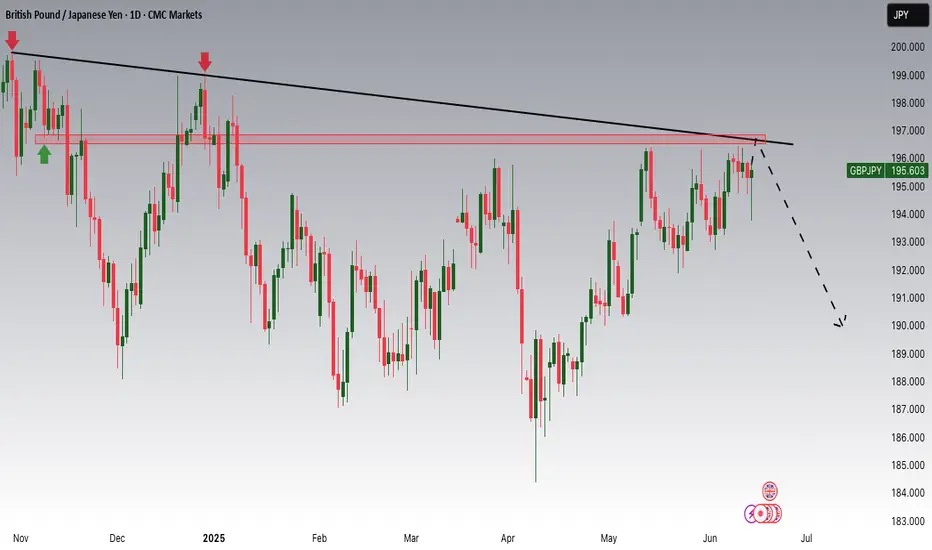
GBPJPY - Multi-Year Short Update! In our last setup for GBPJPY, we identified a massive diagonal pattern, with price completing wave 4 and preparing for a multi-year drop into wave 5.
Since then, price has played out exactly as forecasted — we've seen a clean impulse lower for wave 1, followed by an ABC correction for wave 2, which looks to have now completed.
This sets the stage for the next major leg — wave 3 of 5 — which historically carries the most power and momentum.
📉 See monthly chart here:
📊 GBP/JPY Wave‑3 Trade Idea
Background:
We’ve completed wave 1 down and wave 2 up (ABC correction).
GBPJPY is now positioned to start a powerful wave 3 down — the most impulsive leg in an Elliott sequence.
🔍 Current Price Action:
Price is rejecting major resistance (previous wave A high + shaded zone)
Structure shows a completed 5-wave move up within C, suggesting exhaustion.
A clean ascending trendline (red) has formed under wave v — a break here signals the first confirmation.
Option 1 – Aggressive Entry:
- Trigger: Break and close below the red trendline (~198.00–197.80 zone) on the daily.
- Entry: On candle close below trendline
- Stop Loss: Above recent high ~199.80 and then breakeven once we move lower
Option 2 – Conservative Entry (preferred):
- Trigger: Trendline break + correction
- Entry: On bearish confirmation and then a correction to indicate further downside
- Stop Loss: Above recent high ~199.80 and then breakeven once we move lower
Take Profit Levels:
- TP1: 192
- TP2: 180
- TP3: 175
- Final Target: Trail for extended move toward wave (3) lows (could be 10,000+ pips over long term)
🔐 Invalidation:
Daily close back above 200.00 or impulsive rally beyond the pink resistance zone invalidates the short bias in the short term.
✅ Summary:
This is a high-conviction, structure-backed setup with:
- Wave count + Fib confluence
- Bearish structure at key resistance
- Confirmation-based trigger (trendline break + retest)
- Excellent long-term risk-to-reward profile
📂 Previous GBPJPY Setups (Track Record):
📌 Free Setup (Big Picture Outlook) – Multi-Year Shorts Incoming (Wave 4 Completion)
✅ Swing 1 – 1,200 Pips (VIP GBPJPY Long)
✅ Swing 2 – 1,000 Pips (VIP GBPJPY Short)
✅ Swing 3 – 1,100 Pips (VIP GBPJPY Short)
✅ Swing 4 – 700 Pips (VIP GBPJPY Short)

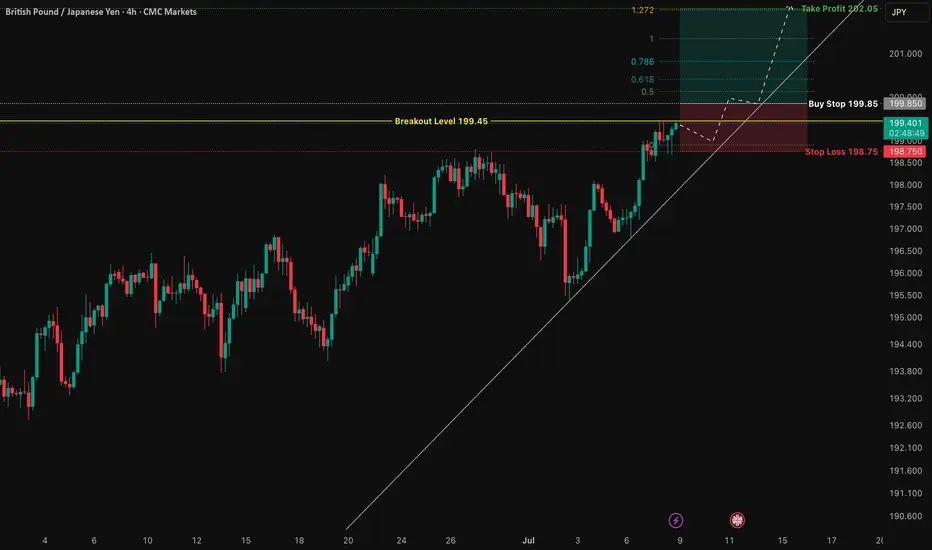
GBP/JPY: Total Confluence Targeting 202.05 BreakoutThis is a high-conviction trade setup based on a powerful confluence of fundamental drivers and multi-timeframe technical alignment. We are anticipating a bullish breakout in GBP/JPY, catalyzed by the upcoming UK GDP data release. The price action has formed a classic "coiled spring" pattern, indicating a significant buildup of energy before a potential move higher.
The analysis is based on pure price action, structure, and macroeconomics. The chart is kept intentionally clean to highlight the strength of the setup itself.
The Fundamental Why 📰
Two core data-driven factors underpin this trade:
1️⃣ Macro Policy Divergence: The primary long-term driver is the stark monetary policy difference between a relatively hawkish Bank of England (BoE), which is still fighting inflation, and an ultra-dovish Bank of Japan (BoJ). This fundamental imbalance creates a natural tailwind for GBP/JPY.
2️⃣ Positive Leading Indicators: Recent economic data from the UK has shown surprising strength. Both the Services and Manufacturing PMIs for June beat expectations, suggesting underlying resilience in the economy. This points to a higher probability of an upside surprise in Friday's GDP figures, which would be the direct catalyst for a breakout.
The Technical Picture 📊
Our confidence comes from a rare "Total Confluence," where every timeframe tells the same bullish story.
The Monthly Chart (Strategic View): Shows a powerful, multi-year uptrend that has decisively broken the critical 8-year resistance from the 2015 highs. The macro trend is undeniably bullish.
The Weekly Chart (The Confirmation): Confirms the uptrend is resuming now after breaking out of a year-long bullish continuation pattern. The "resting" phase appears to be over.
The 4-Hour Chart (The Setup): This is the "coiled spring." Price is consolidating in a very tight range right underneath the key breakout level of 199.45. This shows a lack of sellers and a buildup of buying pressure.
Fibonacci Confluence: Our take profit target is not random. It aligns perfectly with the 1.272 Trend-Based Fibonacci Extension, giving us objective, mathematical confirmation for the target at 202.05.
The Trade Plan ✅
This is a "set and forget" breakout strategy. The order should be placed as a Buy Stop to capture the momentum as it breaks higher.
📉 Asset: GBP/JPY
👉 Entry (Buy Stop): 199.85
⛔️ Stop Loss: 198.75
🎯 Take Profit: 202.05
🧠 Risk/Reward: 1:2
This analysis is for educational purposes. Always conduct your own research and manage your risk appropriately. Good luck.
GBPJPY Breakout and Potential RetraceHey Traders, in the coming week we are monitoring GBPJPY for a buying opportunity around 196.600 zone, GBPJPY was trading in a downtrend and successfully managed to break it out. Currently is in a correction phase in which it is approaching the retrace area at 196.600 support and resistance zone.
Trade safe, Joe.
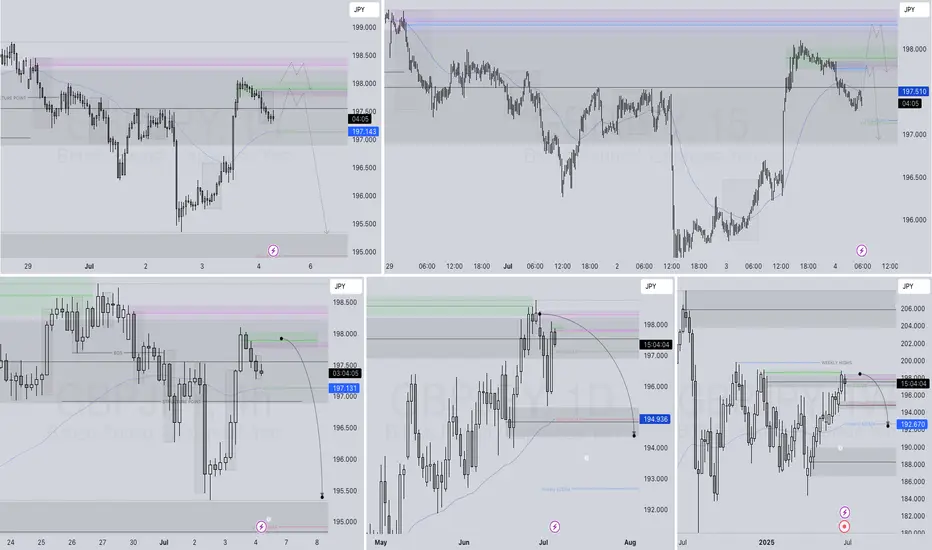
GBPJPY SHORT DAILY FORECAST Q3 D4 W27 Y25GBPJPY SHORT DAILY FORECAST Q3 D4 W27 Y25
Professional Risk Managers👋
Welcome back to another FRGNT chart update📈
Diving into some Forex setups using predominantly higher time frame order blocks alongside confirmation breaks of structure.
Let’s see what price action is telling us today! 👀
💡Here are some trade confluences📝
✅Daily Order block identified
✅4H Order Block identified
✅1H Order Block identified
🔑 Remember, to participate in trading comes always with a degree of risk, therefore as professional risk managers it remains vital that we stick to our risk management plan as well as our trading strategies.
📈The rest, we leave to the balance of probabilities.
💡Fail to plan. Plan to fail.
🏆It has always been that simple.
❤️Good luck with your trading journey, I shall see you at the very top.
🎯Trade consistent, FRGNT X
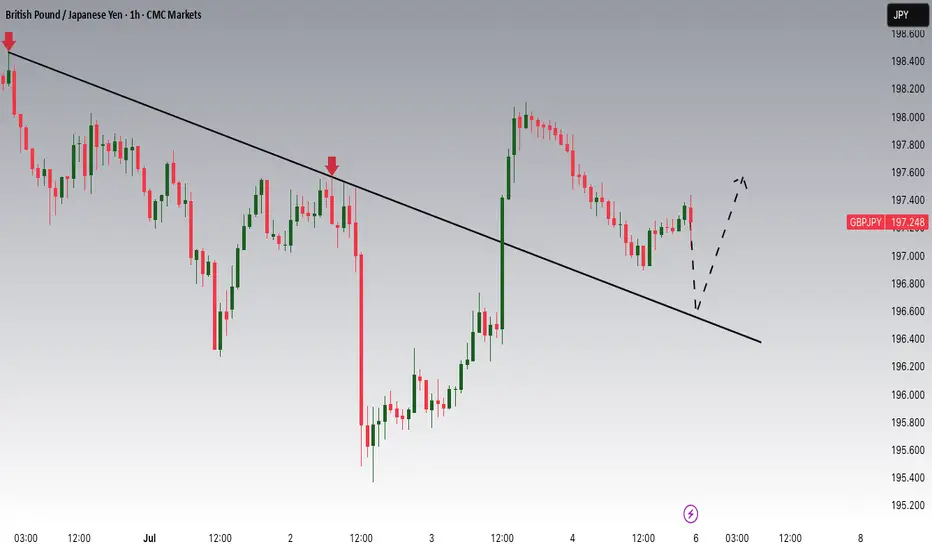
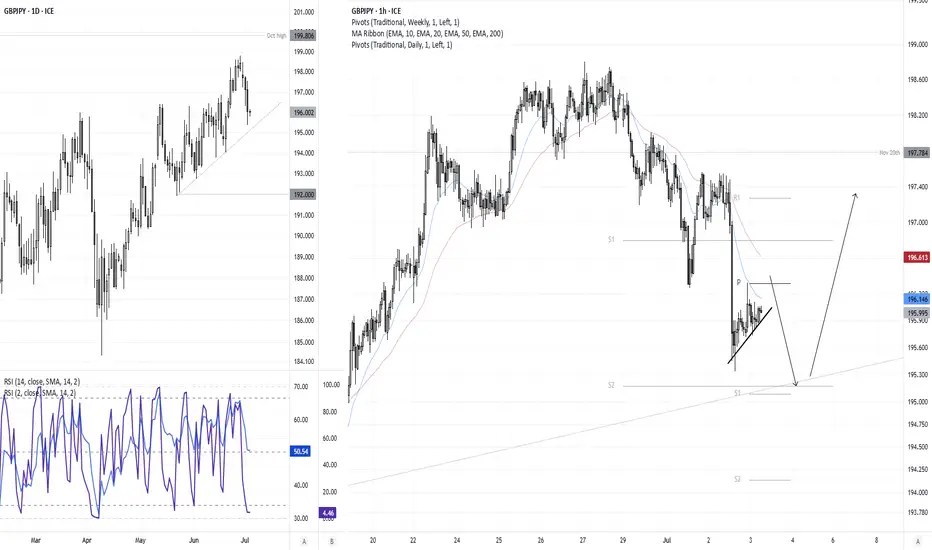
GBP/JPY Bears Eye Drop to 195GBP/JPY closed lower for a third day on Wednesday, with bearish momentum increasing thanks to political tensions in the UK and dovish comments from BOE voting members.
While the daily RSI (2) is oversold, there could still be room for a move to 195 over the near term. Its less than a day’s trading range away using recent volatility levels, and it also sits near the bullish trendline from the May low.
The 1-hour chart shows prices are drifting higher in an apparent corrective fashion, yet prices remain in the lower third of Wednesday’s range. I suspect bears will seek to fade into any pops higher in anticipation of another drop towards 195, near the daily S1 pivot, weekly S and rising trendline.
Should GBP/JPY drop to the lower target area, how prices react could provide clues over its potential to use the level as a springboard or break lower from that pivotal zone.
Market Analyst at City Index and Forex.com
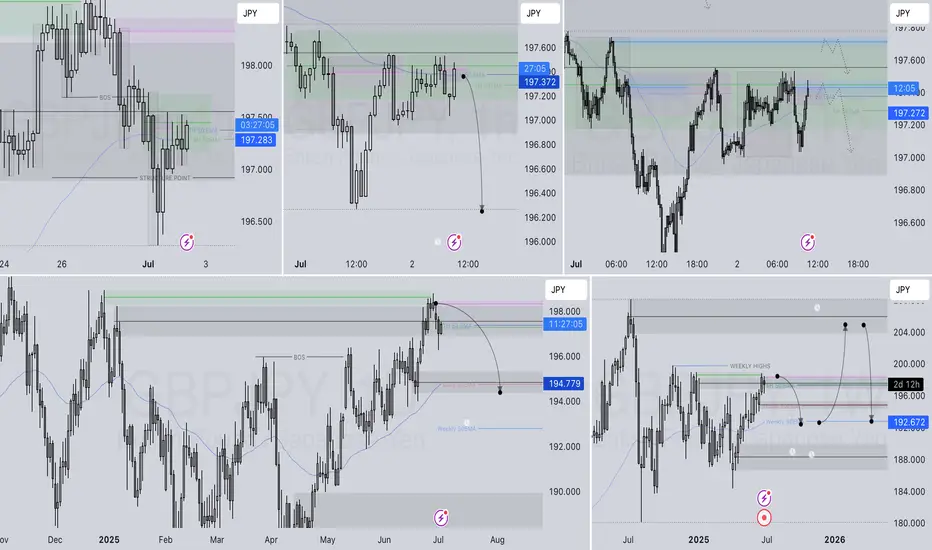
GBPJPY SHORT DAILY FORECAST Q3 D2 W27 Y25GBPJPY SHORT DAILY FORECAST Q3 D2 W27 Y25
Professional Risk Managers👋
Welcome back to another FRGNT chart update📈
Diving into some Forex setups using predominantly higher time frame order blocks alongside confirmation breaks of structure.
Let’s see what price action is telling us today! 👀
💡Here are some trade confluences📝
✅Daily Order block identified
✅4H Order Block identified
✅1H Order Block identified
🔑 Remember, to participate in trading comes always with a degree of risk, therefore as professional risk managers it remains vital that we stick to our risk management plan as well as our trading strategies.
📈The rest, we leave to the balance of probabilities.
💡Fail to plan. Plan to fail.
🏆It has always been that simple.
❤️Good luck with your trading journey, I shall see you at the very top.
🎯Trade consistent, FRGNT X
GBPJPY Potential UpsidesHey Traders, in the coming week we are monitoring GBPJPY for a buying opportunity around 198.100 zone, GBPJPY is trading in an uptrend and currently is in a correction phase in which it is approaching the trend at 198.100 support and resistance area.
Trade safe, Joe.
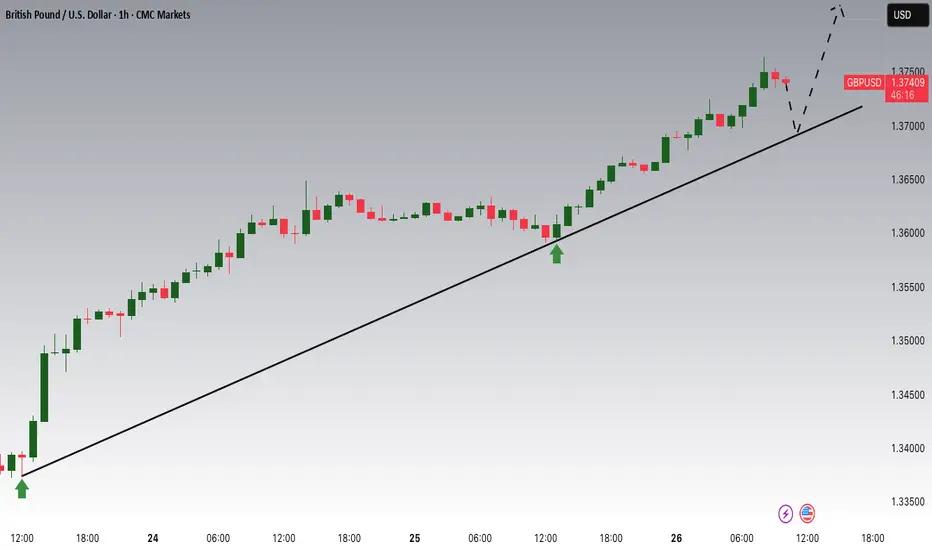
GBPUSD Potential UpsidesHey Traders, in today's trading session we are monitoring GBPUSD for a buying opportunity around 1.37000 zone, GBPUSD is trading in an uptrend and currently is in a correction phase in which it is approaching the trend at 1.37000 support and resistance area.
Trade safe, Joe.
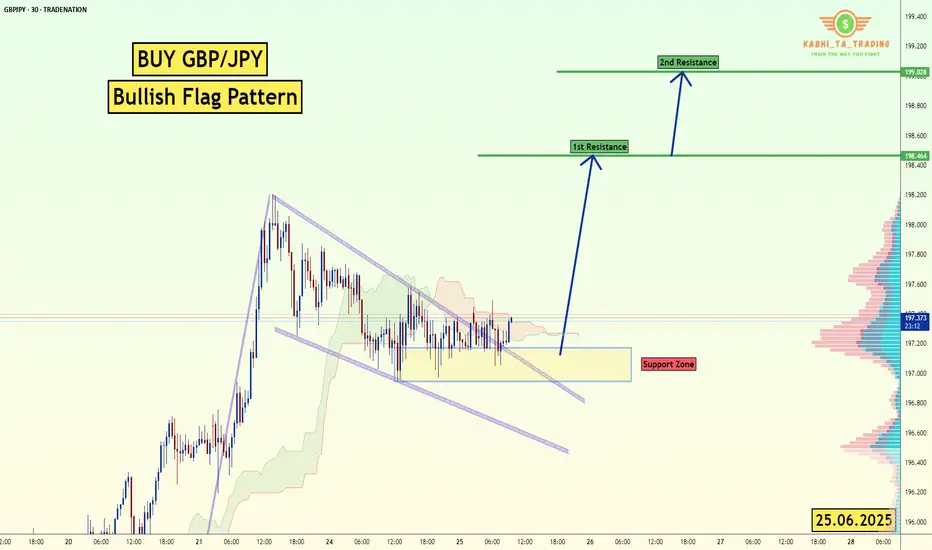
GBP/JPY Bullish Flag (25.06.2025) The GBP/JPY pair on the M30 timeframe presents a Potential Buying Opportunity due to a recent Formation of a Bullish Flag Pattern. This suggests a shift in momentum towards the upside and a higher likelihood of further advances in the coming hours.
Possible Long Trade:
Entry: Consider Entering A Long Position around Trendline Of The Pattern.
Target Levels:
1st Resistance – 198.46
2nd Resistance – 199.00
🎁 Please hit the like button and
🎁 Leave a comment to support for My Post !
Your likes and comments are incredibly motivating and will encourage me to share more analysis with you.
Best Regards, KABHI_TA_TRADING
Thank you.
Disclosure: I am part of Trade Nation's Influencer program and receive a monthly fee for using their TradingView charts in my analysis.
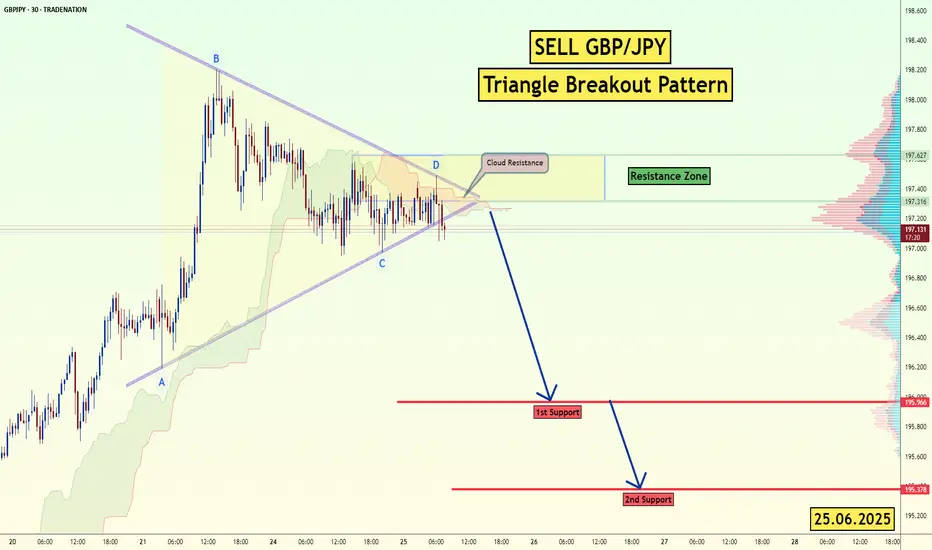
GBP/JPY Triangle Breakout (25.06.2025)The GBP/JPY Pair on the M30 timeframe presents a Potential Selling Opportunity due to a recent Formation of a Triangle Breakout Pattern. This suggests a shift in momentum towards the downside in the coming hours.
Possible Short Trade:
Entry: Consider Entering A Short Position around Trendline Of The Pattern.
Target Levels:
1st Support – 195.96
2nd Support – 195.37
🎁 Please hit the like button and
🎁 Leave a comment to support for My Post !
Your likes and comments are incredibly motivating and will encourage me to share more analysis with you.
Best Regards, KABHI_TA_TRADING
Thank you.
Disclosure: I am part of Trade Nation's Influencer program and receive a monthly fee for using their TradingView charts in my analysis.
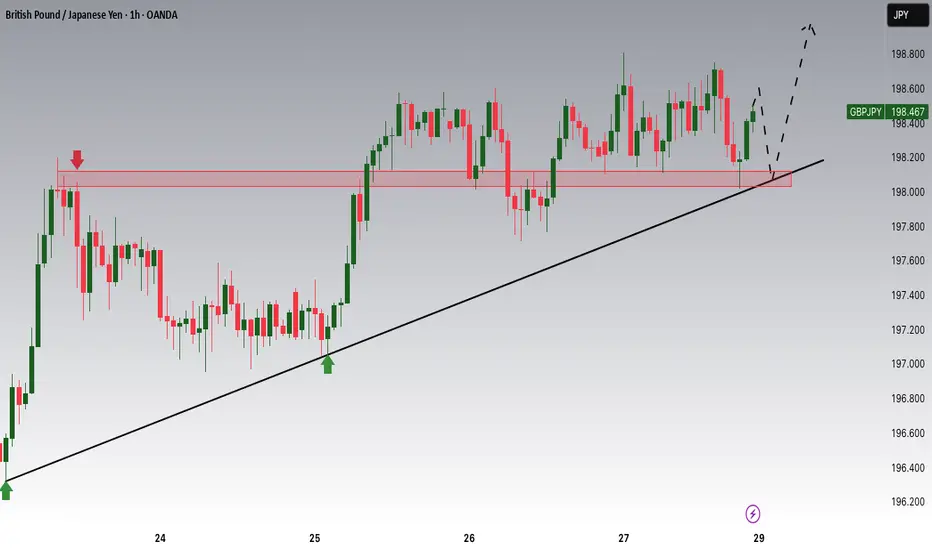
GBPJPY hinting of a weighty 3k pip rise from 195.0. /\GBPJPY has always been resilient for the past 5 years as far its upward trajectory goes -- registering only 3 technical corrective phase since March of 2020 -- then proceeding for further price growth every after corrective seasons.
After touching its parabolic high of 208, pair hibernated healthily back to demand zone to 0.5 fib levels.
Now, the pair is on its 3rd corrective phase since 2020 which has started last July 2024.
Based on our diagram above, this month June 2025 it finally registered its first bear clearance in more than 2 years - conveying of a massive shift in trend. last time this signal surfaced was on April 2023, which has produced a 3000 pips rise thereafter.
Expect some significant ascend series from hereon pricewise after this major shift.
The north journey has started during its low retest of 0.5 FIB levels at 180.0 price zone -- now, already up 1600 pips from that price tap.
This 0.5 fib retest has been historically been a strong support for GBPJPY. This is where most buyers converge based on long term metrics.
More price growth is expected in the next few weeks with weighty targets up there (about 3k pips). Its not overnight but you know the directional context.
Spotted at 195.0
Mid Target previous peak at 208.0
Long term target: 225.

GBPJPY Potential DownsidesHey Traders, in tomorrow's trading session we are monitoring GBPJPY for a selling opportunity around 195.600 zone, GBPJPY is trading in a downtrend and currently is in a correction phase in which in which it is approaching the trend at 195.600 support and resistance area.
Trade safe, Joe.