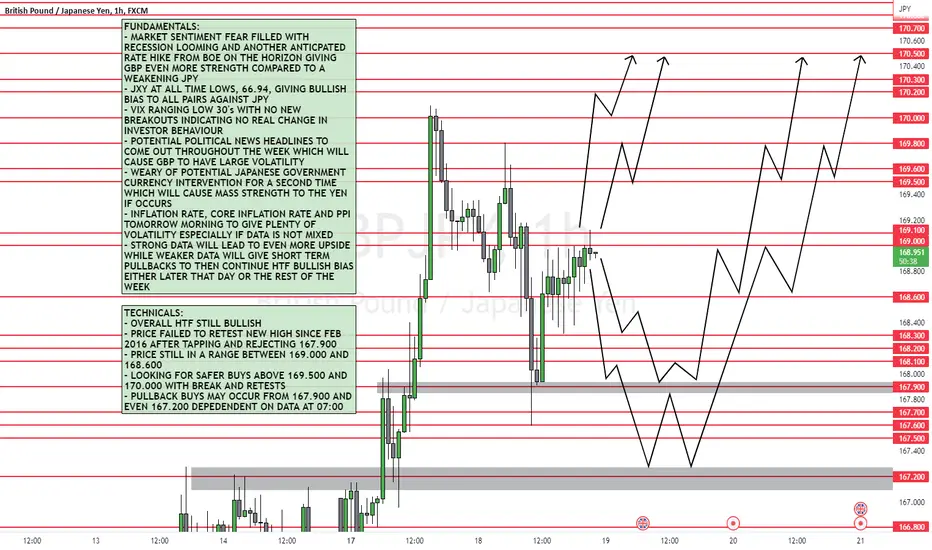
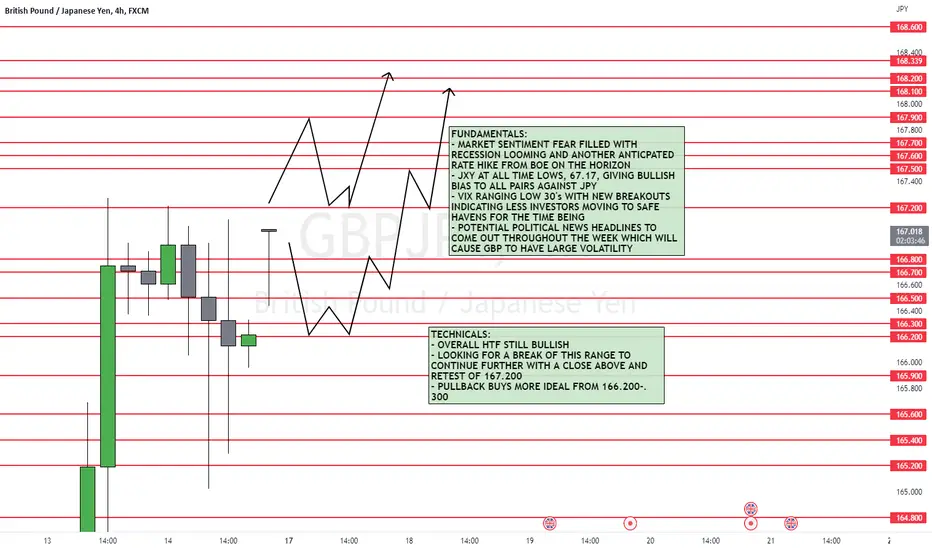
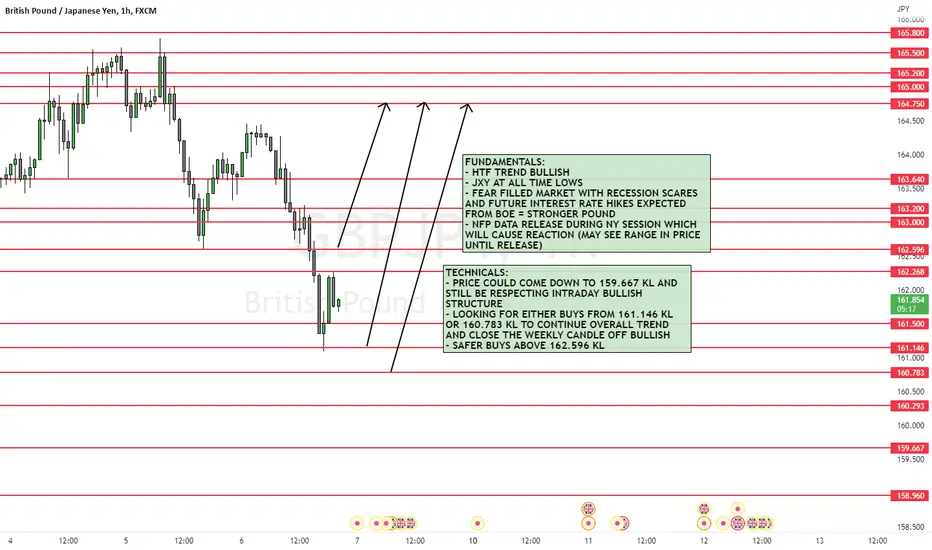
GBPJPY 19/10/2022Details on chart - looking for buys following overall bias however, data tomorrow morning is the main focus to dictate London session
Gbp-jpy
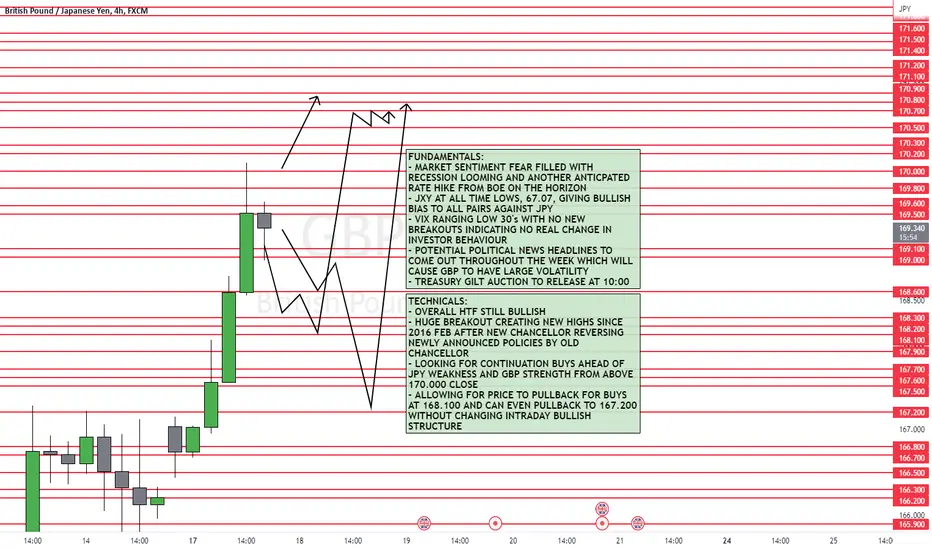
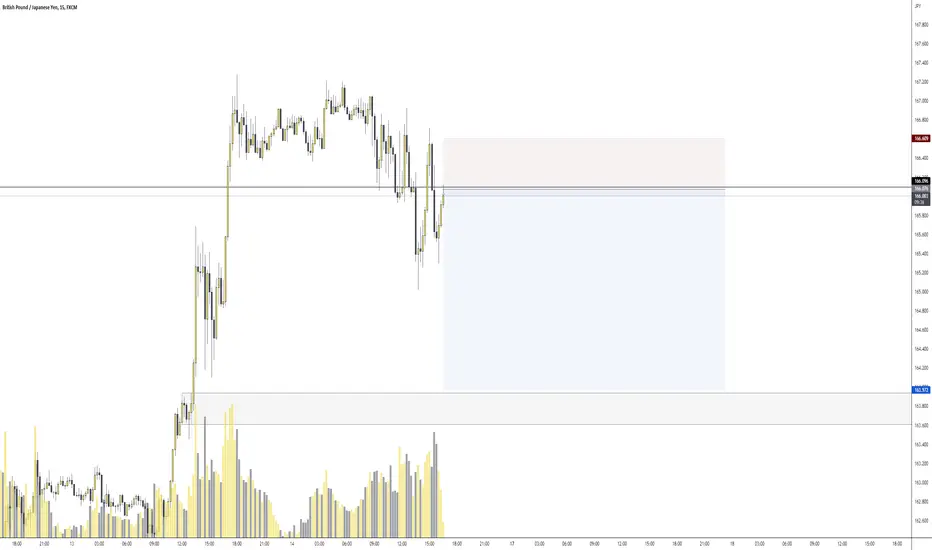
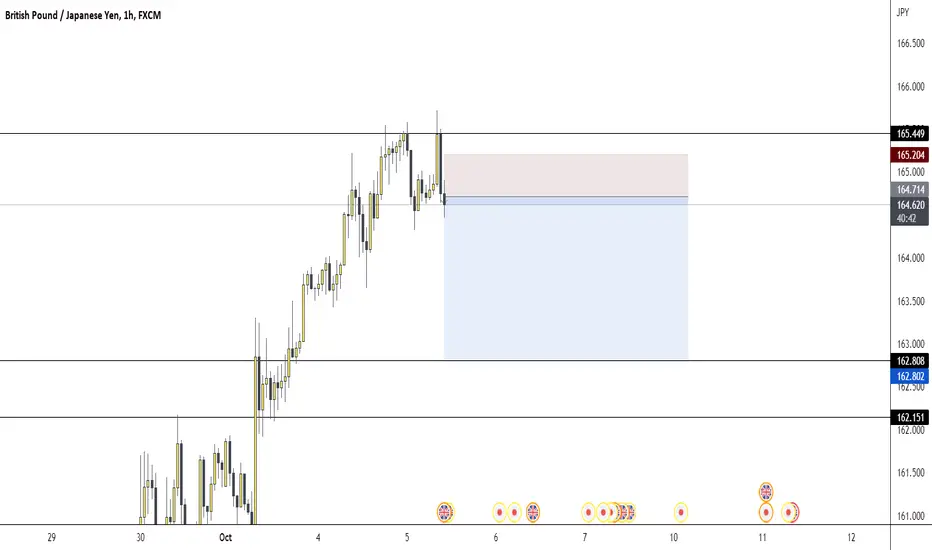
GBPJPY 18/10/2022Details on chart - potential entries to continue bullish trend up towards newly created HHs
short sell GBPJPY for short termthe GBP is overbought in short Term so a pullback is expected to happen. I am looking to short GBPJPY once it stays below 164.4. my Initial Target will be 160 and than further TP on every 500pips apart

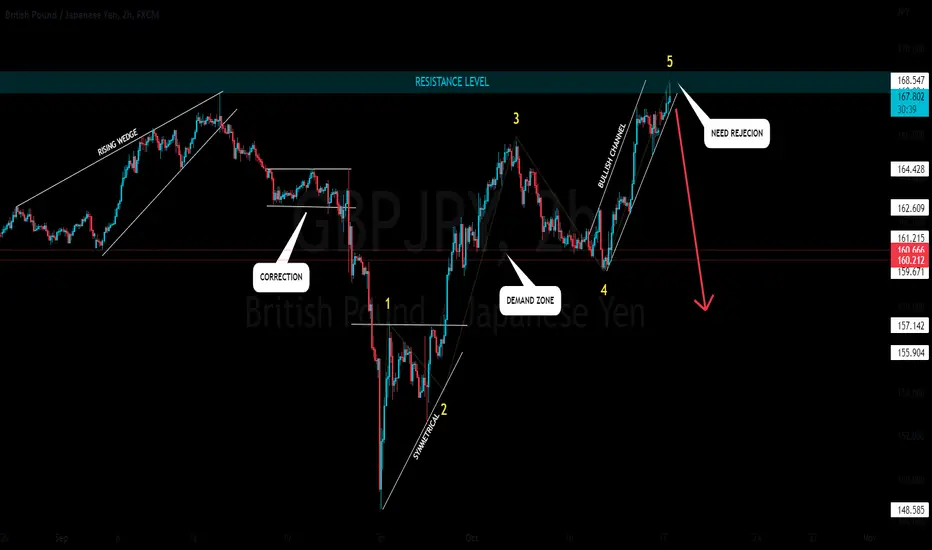
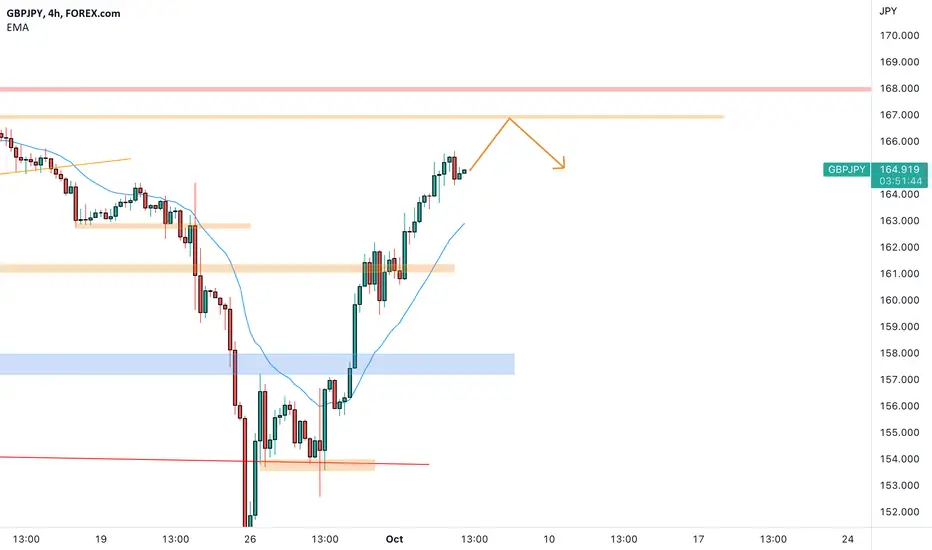
GBPJPY Next Possible MoveTechnical Analysis Chart Update
GBP / JPY ( British Pound / Japanese Yen )
Time Frame - H2
Elliot Waves - Completed " 12345 " Impulsive Wave at Daily Resistance Level now it will Follow Sell Trend to complete its Correction " ABC "
In Short Time Frame #STF it is Following BULLISH CHANNEL need Breakout and Retest
Strong Selling Divergence in #RSI
GBPJPY ShortEntered as shown on chart.
Betting on a rejection of resistance and test of lower support here.
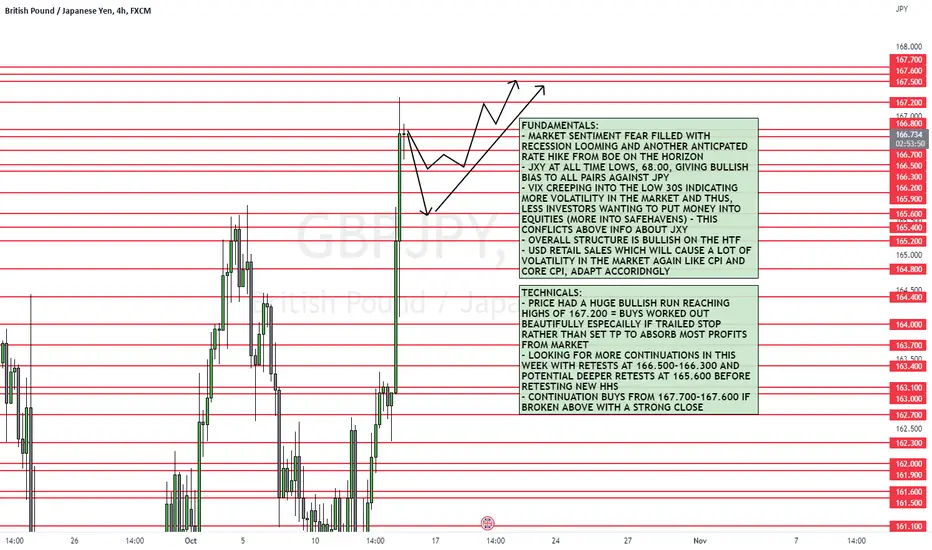
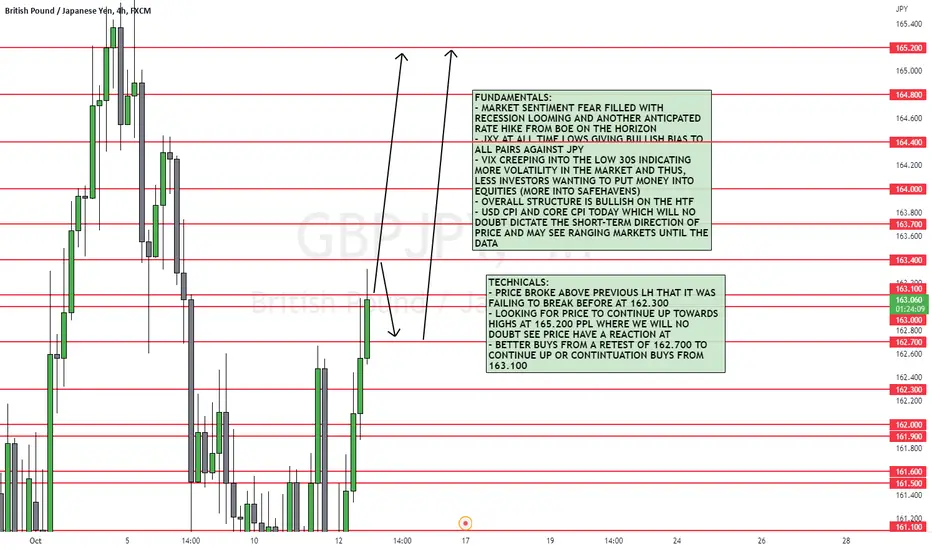
GBPJPY 14/10/2022Details on chart - playing the HTF bullish structure and overall sentiment to look for buys will give you the best opportunity
Simplified idea for GBPJPYHello guys, This is my plan for GBPJPY.
Please like and follow if you like my idea.
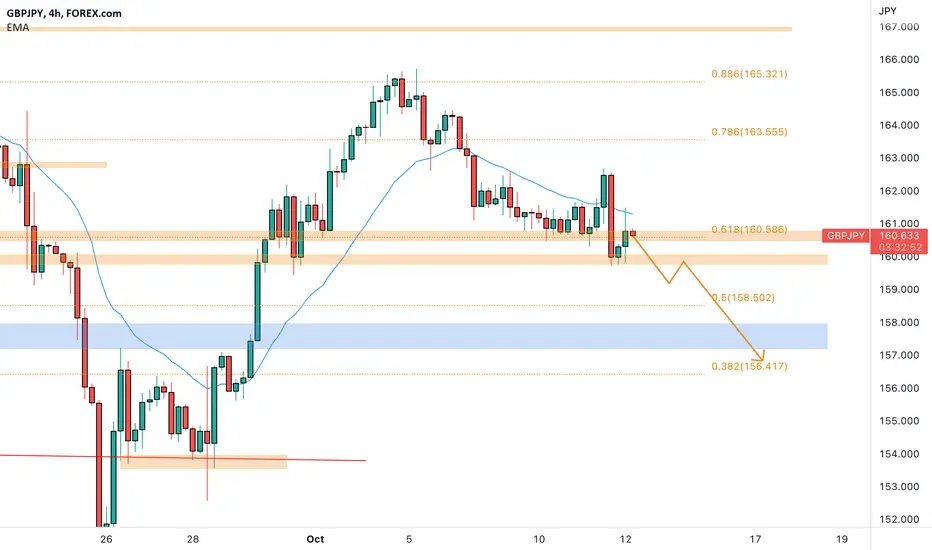
GBPJPY a move to the 0.618 🦐GBPJPY on the 4h chart after the sharp retracement from the recent low tested the 0.886 Fibonacci level and turned to the bearsih scenario.
The market tests the 0.618 level and a downside continuation can be expected. .
How can i approach this scenario?
If the price will break below the support area i will set set a nice short order according to the Plancton's strategy rules.
-----
Follow the Shrimp 🦐
Keep in mind.
🟣 Purple structure -> Monthly structure.
🔴 Red structure -> Weekly structure.
🔵 Blue structure -> Daily structure.
🟡 Yellow structure -> 4h structure.
⚫️ Black structure -> <4h structure.
Here is the Plancton0618 technical analysis , please comment below if you have any question.
The ENTRY in the market will be taken only if the condition of the Plancton0618 strategy will trigger.

Simplified plan for GBPJPYHello beautiful peeps, here is the simplified idea for GBPJPY.
please like and follow if you like my work.
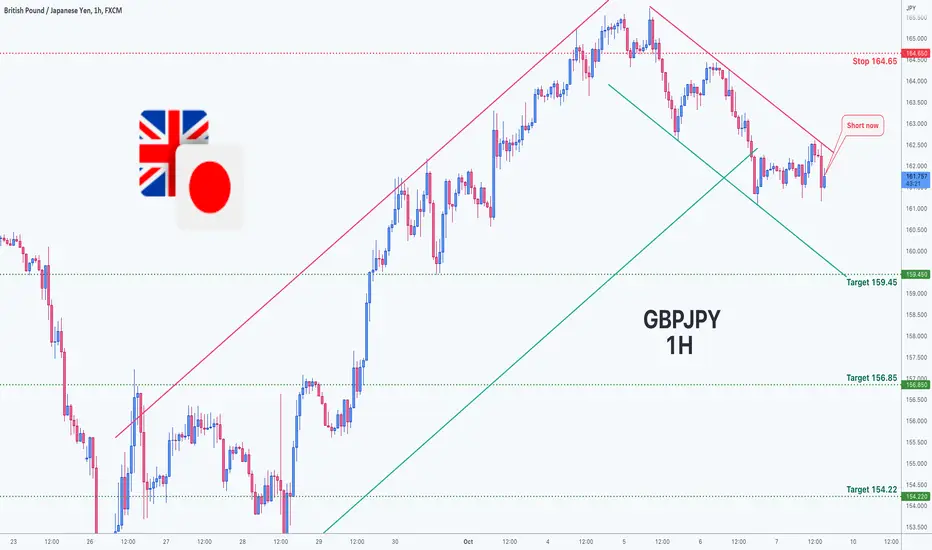
Trading opportunity for GBPJPYBased on technical factors there is a Short position in :
📊 GBPJPY
🔴 Short Now 161.93
🧯 Stop loss 164.65
🏹 Target 1 159.45
🏹 Target 2 156.85
🏹 Target 3 154.22
💸RISK : 1%
We hope it is profitable for you ❤️
Please support our activity with your likes👍 and comments📝
Simplified idea for GBPJPYHello Beautifull peeps,
this is my idea about GBPJPY please like and follow if you like my idea..

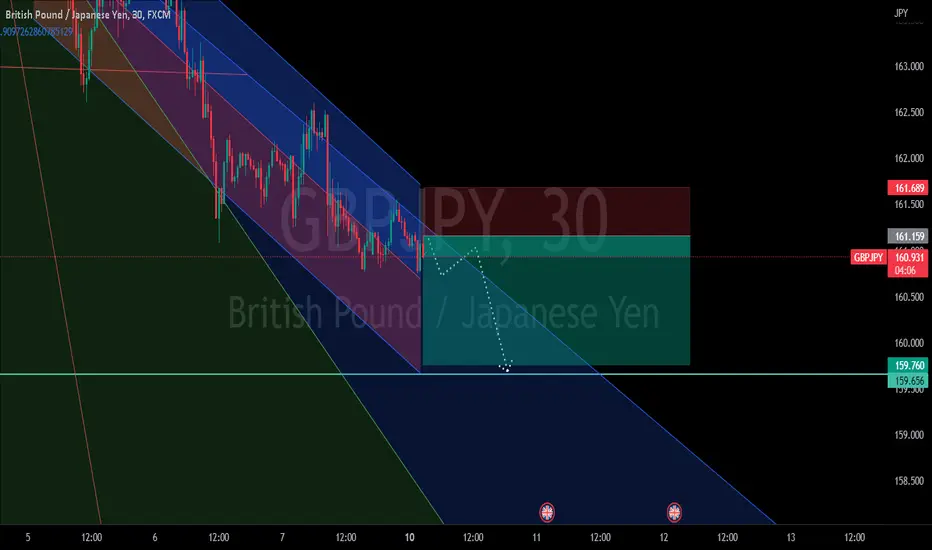
GBPJPY possible scenarios 🦐GBPJPY on the 4h chart retraced sharply from the recent low.
The market creates a series of powerful lower hh hl and is now close to an important supply zone.
How can i approach this scenario?
If the price will reach the supply i will be look for a possible inversion and set a nice short order at that point according to the Plancton's strategy rules.
-----
Follow the Shrimp 🦐
Keep in mind.
🟣 Purple structure -> Monthly structure.
🔴 Red structure -> Weekly structure.
🔵 Blue structure -> Daily structure.
🟡 Yellow structure -> 4h structure.
⚫️ Black structure -> <4h structure.
Here is the Plancton0618 technical analysis , please comment below if you have any question.
The ENTRY in the market will be taken only if the condition of the Plancton0618 strategy will trigger.
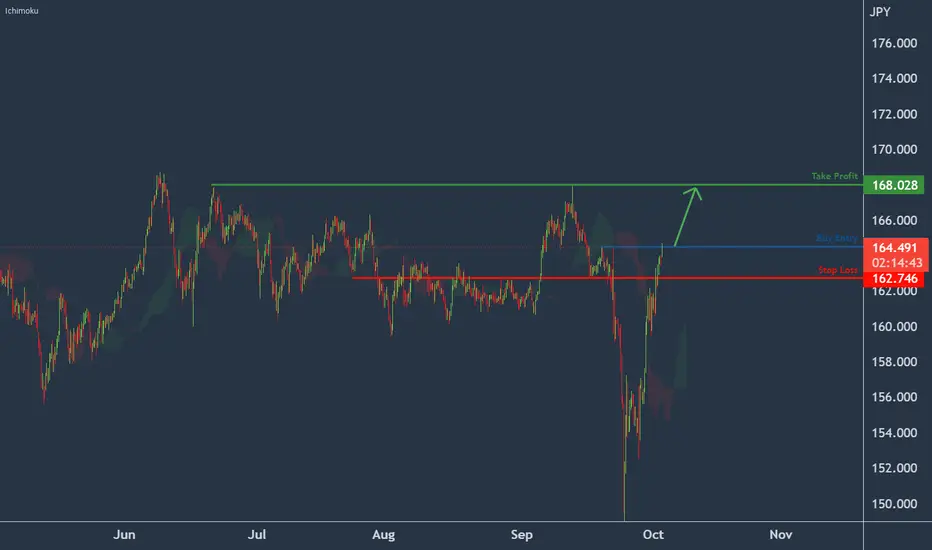
USDCHF Potential For Bullish RiseOn H4, with the price crossing the ichimoku cloud, we have a bullish bias that the price may rise from the buy entry at 164.524, where the price sits currently to the take profit at 168.028, which is in line with the swing highs. Alternatively, the price may drop to the stop loss at 162.746, which is in line with the overlap support.
Please be advised that the information presented on TradingView is provided to Vantage (‘Vantage Global Limited’, ‘we’) by a third-party provider (‘Everest Fortune Group’). Please be reminded that you are solely responsible for the trading decisions on your account. There is a very high degree of risk involved in trading. Any information and/or content is intended entirely for research, educational and informational purposes only and does not constitute investment or consultation advice or investment strategy. The information is not tailored to the investment needs of any specific person and therefore does not involve a consideration of any of the investment objectives, financial situation or needs of any viewer that may receive it. Kindly also note that past performance is not a reliable indicator of future results. Actual results may differ materially from those anticipated in forward-looking or past performance statements. We assume no liability as to the accuracy or completeness of any of the information and/or content provided herein and the Company cannot be held responsible for any omission, mistake nor for any loss or damage including without limitation to any loss of profit which may arise from reliance on any information supplied by Everest Fortune Group.
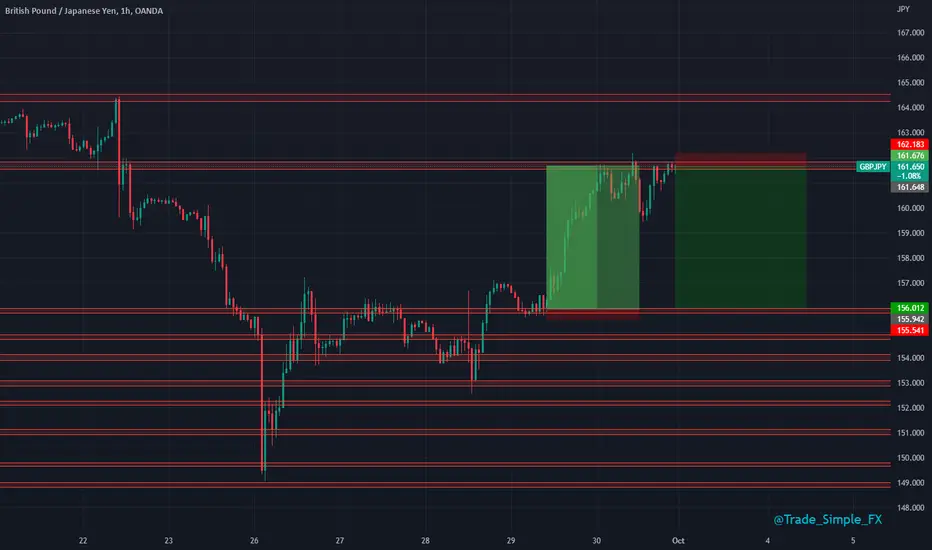
GBPJPY H1 - Short SetupGBPJPY H1 - A mental week to say the least for the GBP and YEN, yet again. Some monster moves, 600 pips seen on single M5 and M15 candles, thankfully, healthy corrections seen towards the latter part of the week, which has balanced zones and made things measurable for us to follow going into this fresh week. Huge 10R trade potential down towards the previous area of S/R, we saw a handful of rejections from this 162-handle last week, a dip as much as 250 pips which was great. But minor in the grand scheme of things. Failing this rejection, we can simply look for break and retest play from that 162 handle.
GBPJPY: Breakout and Potential retraceHey traders, in the coming week we are monitoring GBPJPY for a selling opportunity around 162 zone, once we will receive any bearish confirmation the trade will be executed.
Trade safe, Joe.

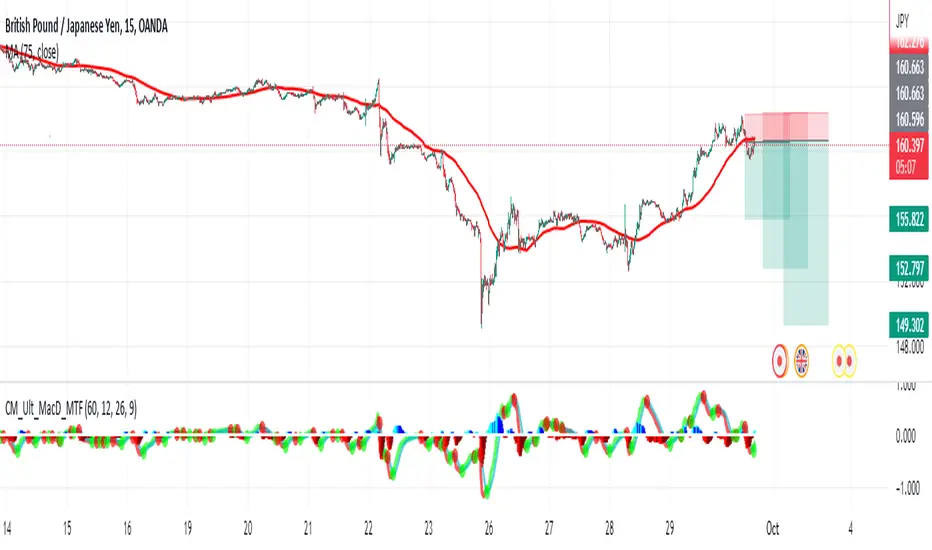
Short GBPJPYI looking to short GBPJPY from current level of 160.5 as price has retraced from the 162 resistance.
SL = 162.3 slightly above the current top
TP1= 158.8
TP2=152.8
TP3= 149.2
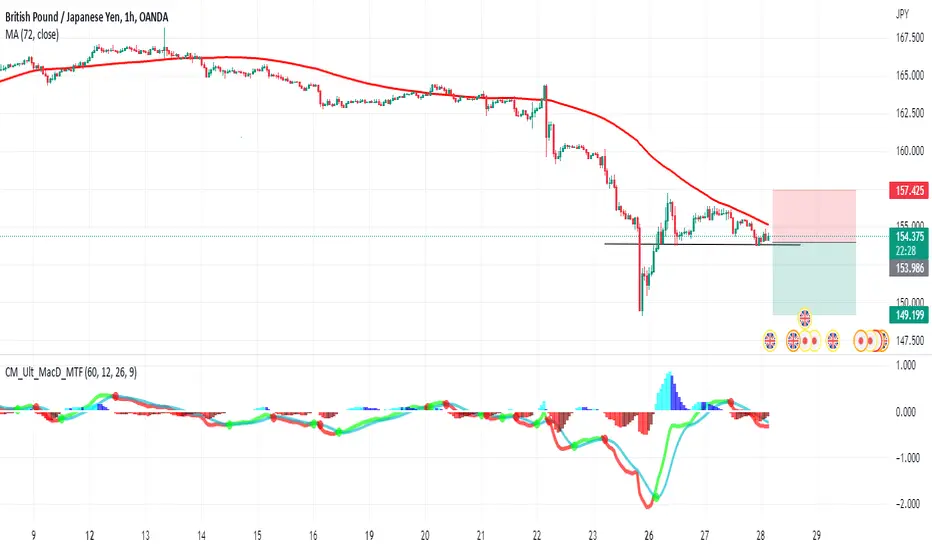
Short GBPJPY for short termDear all,
I am looking for a short position in the GBPJPY pair. the trade will be active once the pair breaks down the current horizontal line.
> TP will be at recent low around 149.2 area.
> SL shall be slightly above the recent highs around 154.7 area.
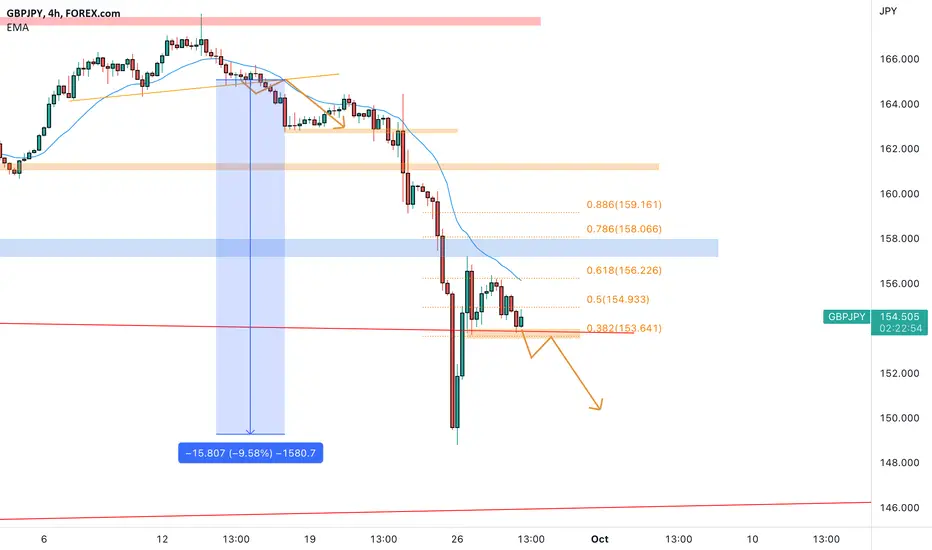
GBPJPY looking for the 149 again? 🦐GBPJPY on the 4h chart after our previous call touched the lower level at the 149 area.
From there the price retraced at the 0.618 Fibonacci zone and is currently trading over the 0.382.
How can i approach this scenario?
I will wait for the EU market open and if the market will have the strength to break and close below i will look for a nice short order according to the Plancton's strategy rules.
-----
Follow the Shrimp 🦐
Keep in mind.
🟣 Purple structure -> Monthly structure.
🔴 Red structure -> Weekly structure.
🔵 Blue structure -> Daily structure.
🟡 Yellow structure -> 4h structure.
⚫️ Black structure -> <4h structure.
Here is the Plancton0618 technical analysis , please comment below if you have any question.
The ENTRY in the market will be taken only if the condition of the Plancton0618 strategy will trigger.