Gbpchfbuy
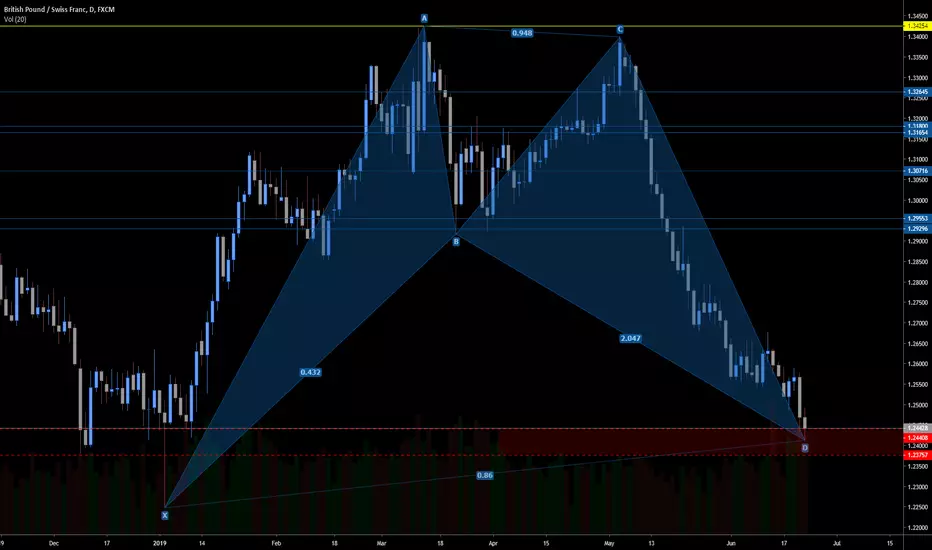
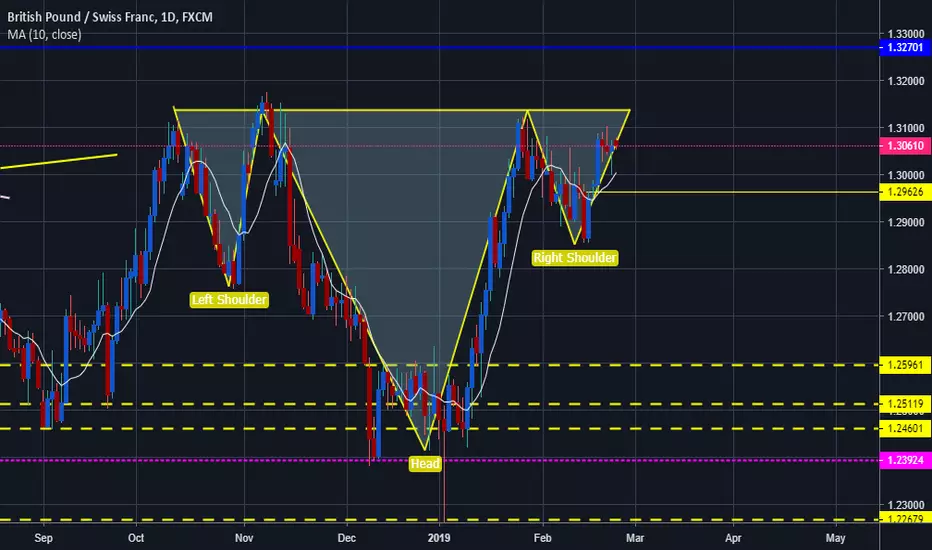
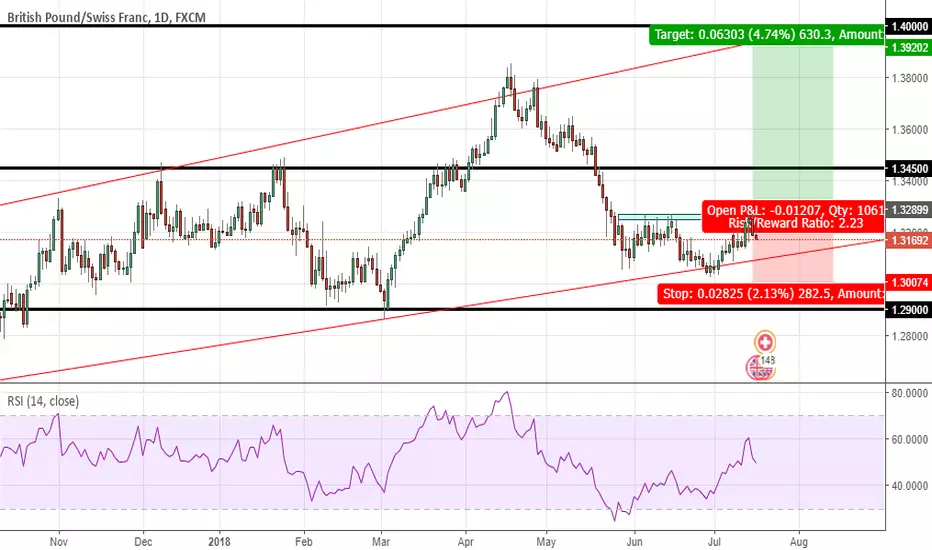
GBPCHF Daily Harmonic Bat Pattern Analysis and StrategyWe see the completion of a harmonic bat pattern on the daily chart at a major support zone. We are expecting a bounce off a the support zone which signaled us to take a long position. FX:GBPCHF
My wife says im a PIG...She needs to stop looking in the mirror ;p
Take note of this key resistance turned support zone that price is currently at as I wont spoon feed you forever! So we are expecting bullish movement from this area.
This is a good area and is obviously where big banks have set orders previously, so start thinking like a big investor and start making money instead of working a dead end job to earn money just to waste it in forex because you think you are better than the markets and are looking to get rich quickly.
Our own personal strategy allows us to catch a few pips on the bounce of these zones and also catch the big move if it happens, if you would like to learn more about our strategy then give us a message.

GBPCHF LONGReposted! as this idea was hidden by one of the tradingview moderators due to violation of tradingview guidelines (using all 'Capitals' in description) by us which we deeply regret
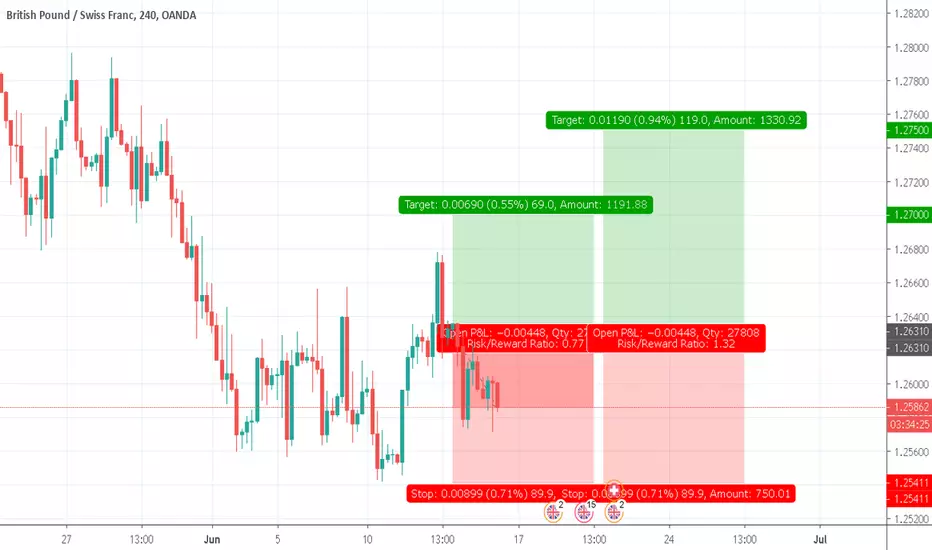
Analysis team bought GBPCHF with 2 targets:
TP1 - 1.27000
TP2 1.27500

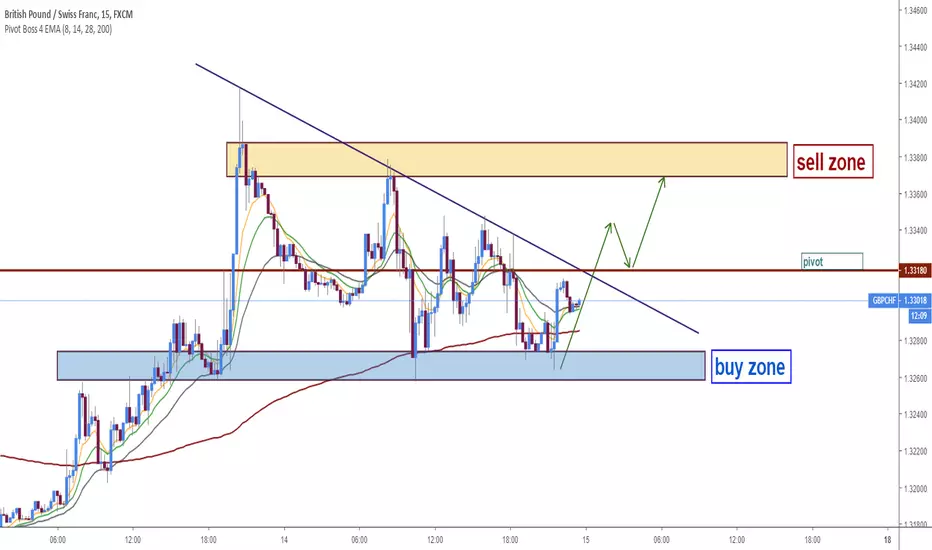
GBP/CHF: Sell Trade Setup !!BUY & SELL Above Given Chart or
You Can Also set Own Risk reward.
Let see what Will be Next Move.
Warning- I m Not a Financial Advisor this idea Only For Educational Purpose Only.
Thank You !!

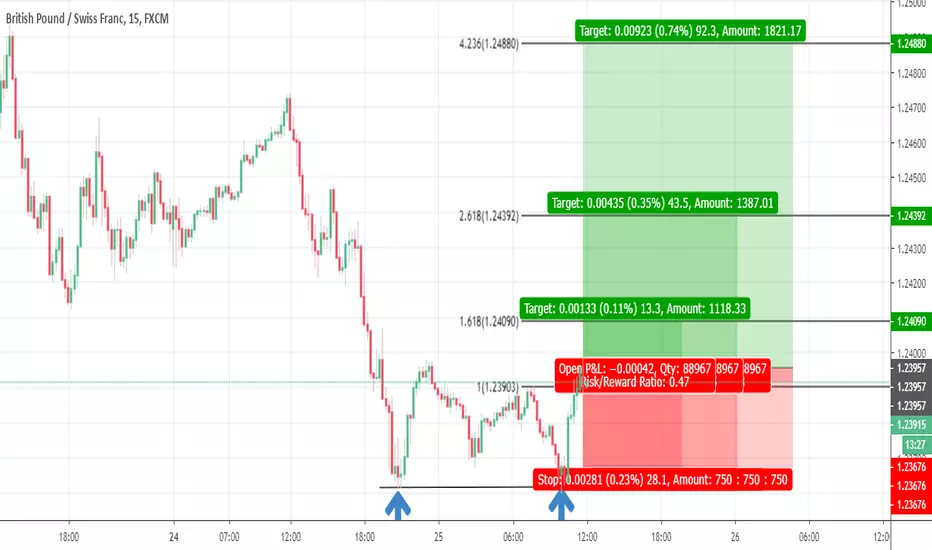
GBPCHF came to key support zone.GBPCHF came to key support zone. We can look small timeframe for entry.
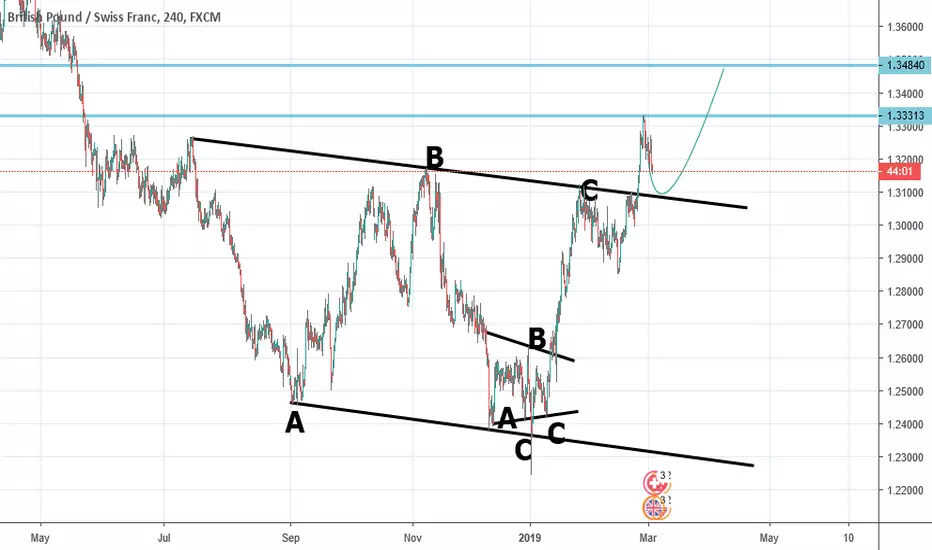
GBPCHF is in bullish trendRespected followers, as we can see that GBPCHF has rejected its trend line on thursday which was support line accordingly trend line. So in this way we can see further upside move in GBPCHF. Reward ratio is 1:2 which is too good.

GBPCHF - Long - AnalysisPrice presented a bullish engulfing on the daily chart, made higher high and higher low. Waiting for the price to break the consolidation to go long!
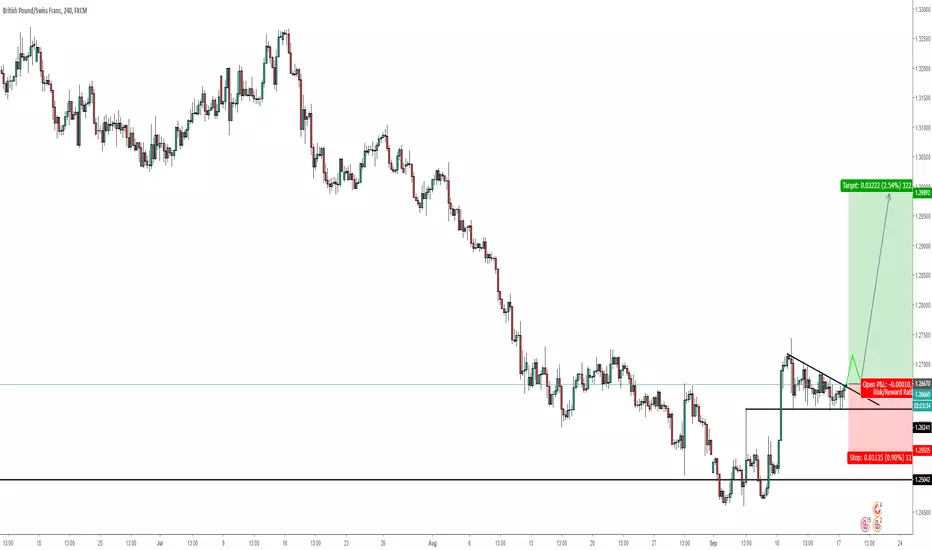
GBP/CHF - 100+ Pips Bullish OpportunityGBP/CHF has broken the 50 EMA on the 4H chart and is currently finding support on top of it.
We can wait a bit more for the confirmation of the up move and enter in the move.
Trade safe.

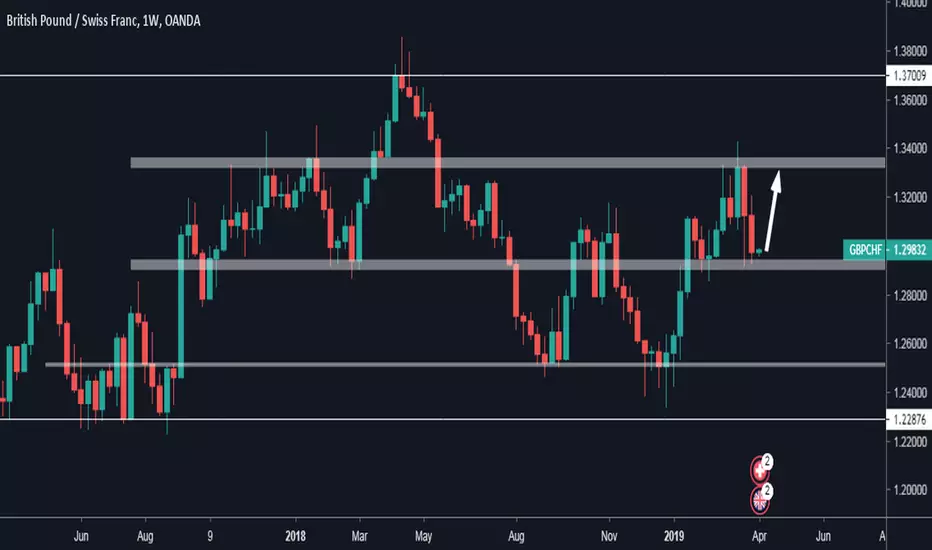
GBPCHF LONG IDEAPRICE IS IN AN ASCENDING WEDGE ON THE WEEKLY
PRICE PREVIOUSLY BROKE THE 134500 LEVEL TO TEST THE TREND LINE AND NOW ITS HEADING IN THAT DIRECTION AGAIN
THERE ISA MINOR RESISTANCE IN THE 132500 AREA THAT HAS BEEN TESTED 4 TIMES.
i WILL BE WAITING FOR PRICE TO BREAK OUT OF THE RESISTANCE AND HIT THE 132800 LEVEL BEFORE GOING LONG ON THIS PAIR
OR I WILL JUST WAIT FOR PRICE TO RETEST THE LOWER TREND LINE THEN GO LONG.
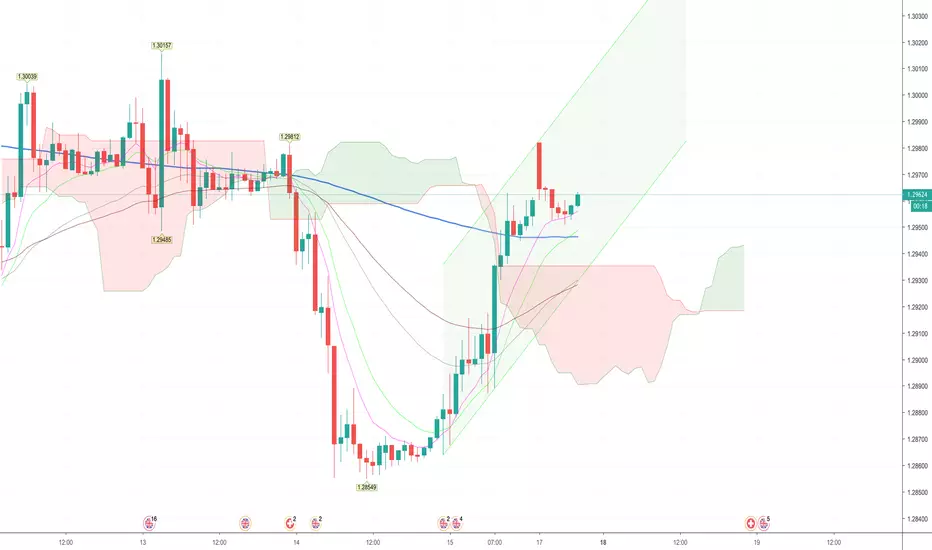
GBP/CHF technical analysisThe 3-hour chart(image 1) of GBP/CHF seems to be in a sideways consolidation mode after a long downside move.
It has been in range bound movement for the past 1 month and a strong bullish engulfing candle has formed at the lower end of the support which is a very good sign that bulls have taken control.
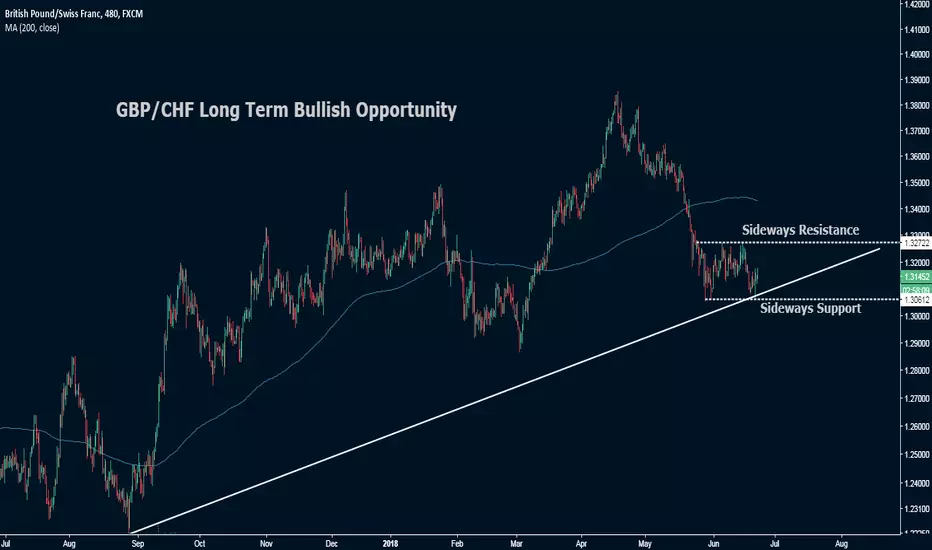
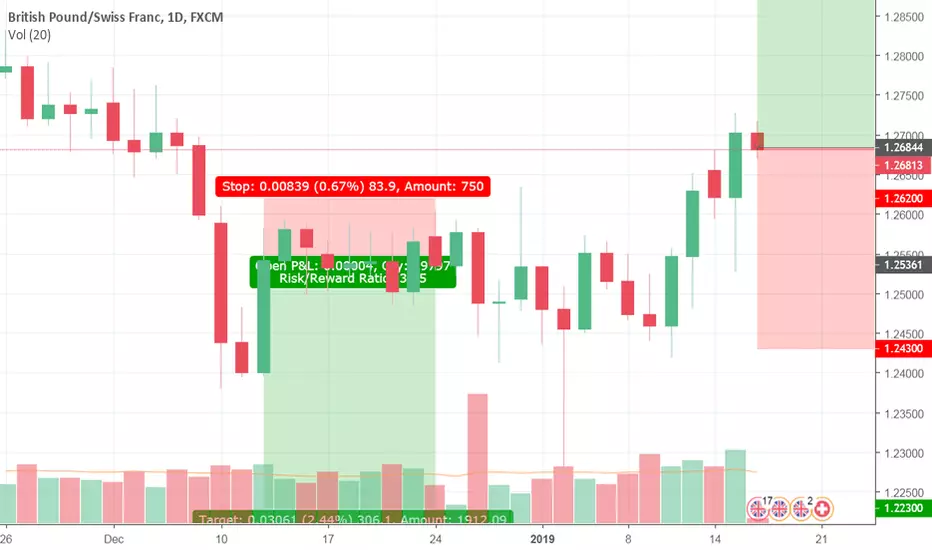
Coincidentally, this strong support zone meets the long term trendline in the Daily chart (image 2).
The pair is also trading close to its 200 day moving average.
So if the 3-hour chart gives a break out from the consolidation zone,it becomes a valid double bottom pattern.
Taking all these factors into consideration,we expect the pair to give a bullish break out and its long term bull run to continue.