GBPCHF - A "double" double topHey guys,
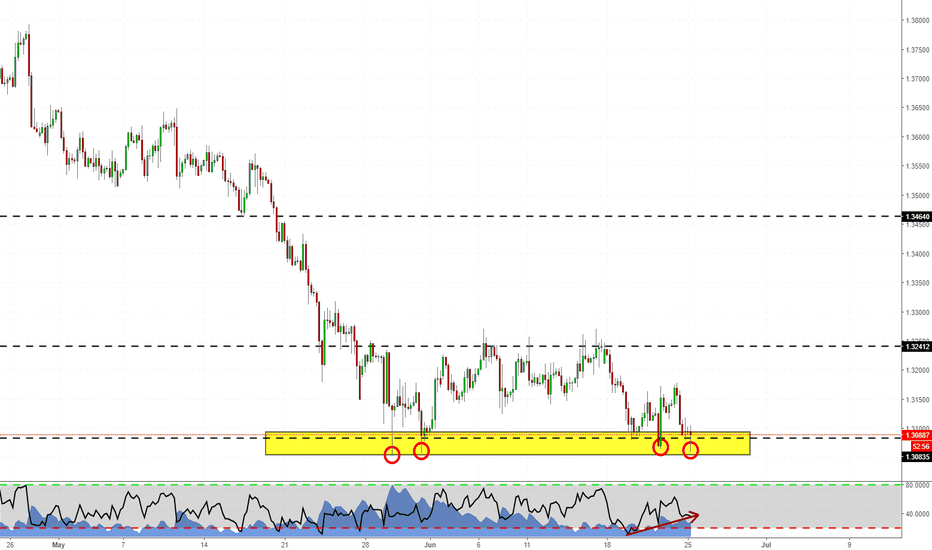
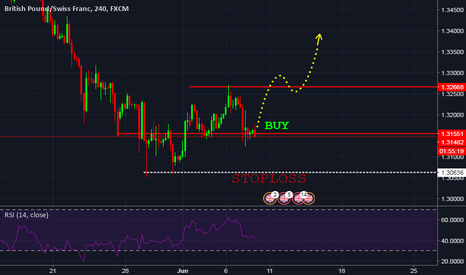
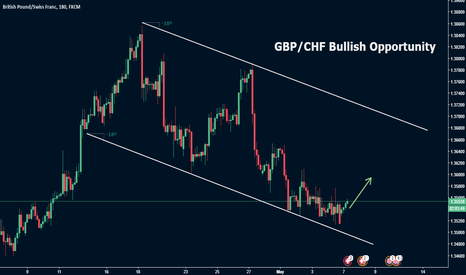
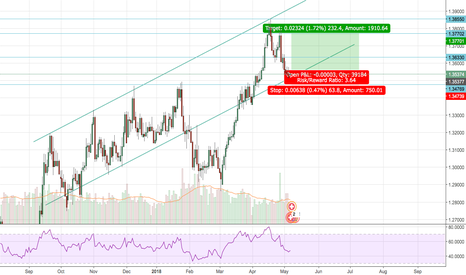
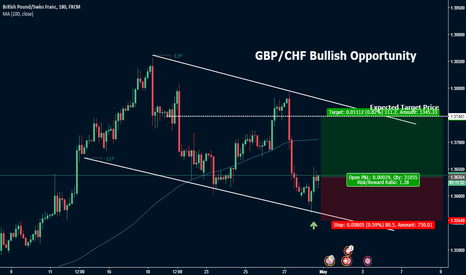
this is quite particular as a case study. Here on GBPCHF i've gone down to a lower timeframe because i was looking at the daily chart and i saw a double top with RSI divergence. Thus i went on the 4hr chart and looked for trading opportunities at the retest. Guess what i've found: another double bottom with again, RSI divergence at the second test. At the moment, i'm not sure if and when i will enter because i don't see an actual signal, but i'll update you in that case.
Let me know if you have any comment/question.
Otherwise, we'll see in the next chart!
Gbpchflong
GBPCHF - "Double" double topHey guys,
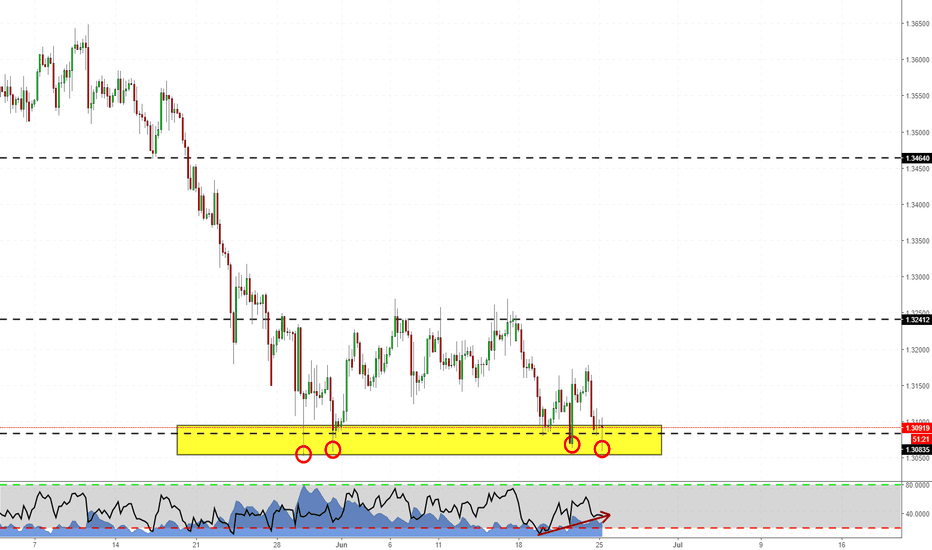
this is quite particular as a case study. Here on GBPCHF i've gone down to a lower timeframe because i was looking at the daily chart and i saw a double top with RSI divergence. Thus i went on the 4hr chart and looked for trading opportunities at the retest. Guess what i've found: another double bottom with again, RSI divergence at the second test. At the moment, i'm not sure if and when i will enter because i don't see an actual signal, but i'll update you in that case.
Let me know if you have any comment/question.
Otherwise, we'll see in the next chart!
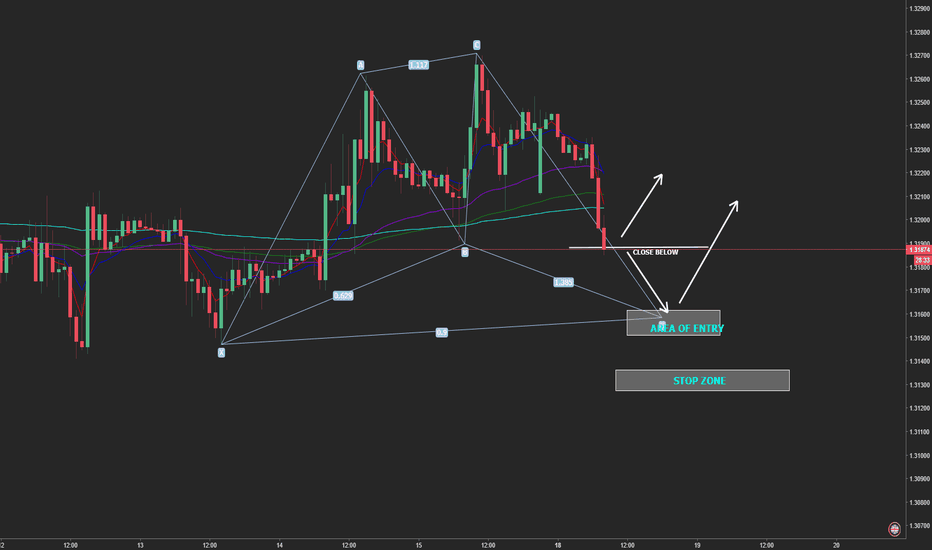
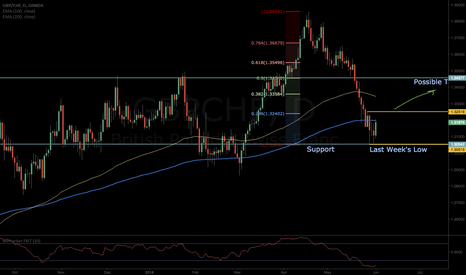
GBPCHF Potential Long OpportunityDescription: GBPCHF is testing the Fibonacci 61.80% of XA. If it breaks below 1.31900, the next target will be Fibonacci 88.60 1.31600 – 1.31500 region.
Pattern: Bullish Harmonic Pattern would be completed t D Leg. And we will look for a buying opportunity.
levels as described in the chart
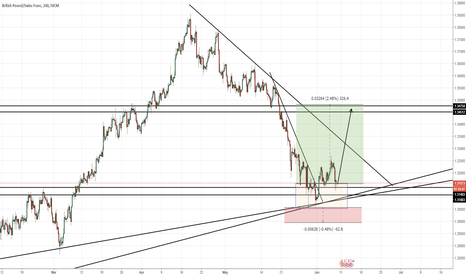
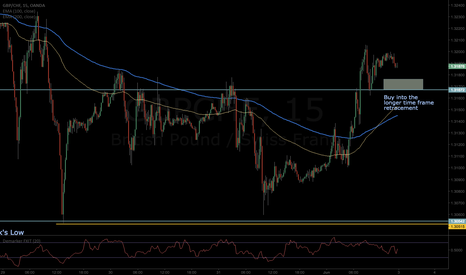
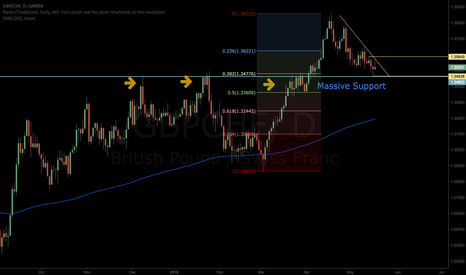
GBPCHF-Almost Good LongOk, so as I zoomed out to daily I see more reasons why I'm digging this trade. Resistance tested a few times than broken and retested as support. Also, confluence with the FIB retrace at the 38%.
I am waiting on a move north on the 60 minute chart to start building positions back to the high.
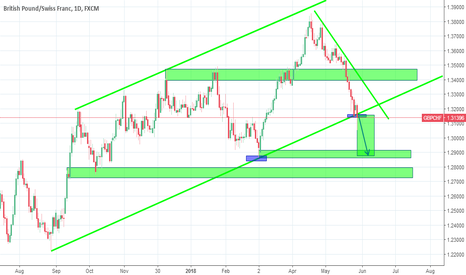
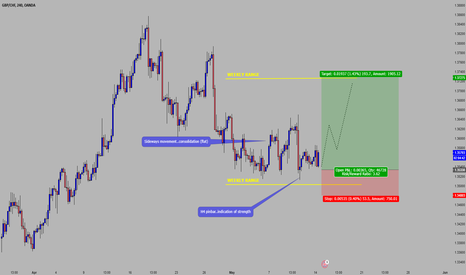
GBPCHF LONGHorizontal lines are important historical prices.
we se exhaustion wicks the last few days, hit support so now should be going up. Might bounce on the first horizontal line, only to bounce again on the support, to finally be headed towards the TP indication.
I think it might continue to the next horizontal line or even the resistance line, but the TP indication seems to be a real zone of interest for the price, so might go down again even to the resistance line again. so thats why the TP zone is until there and not further
