Trading balanceTrading balance The price of the asset has rebounded from the balance zone. With the prospect of growth into the resistance zone.
GBPJPY

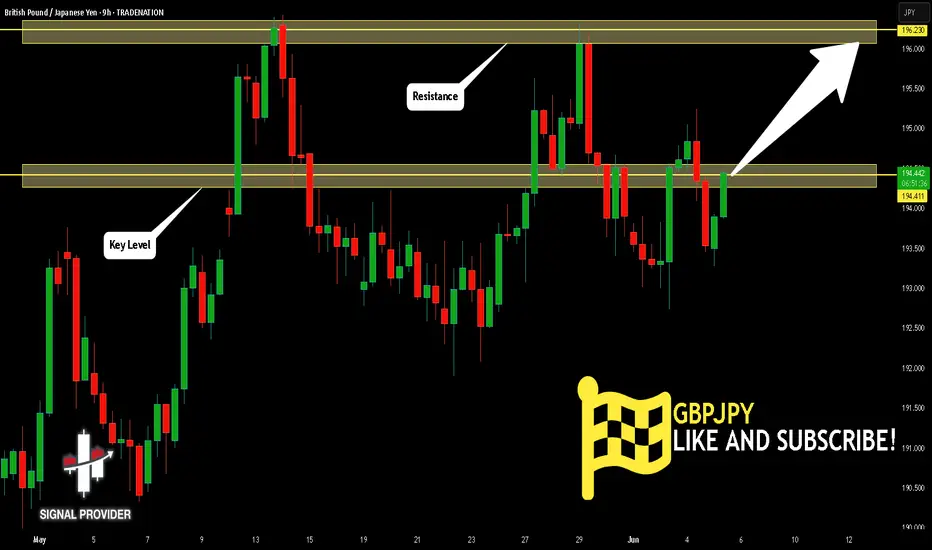
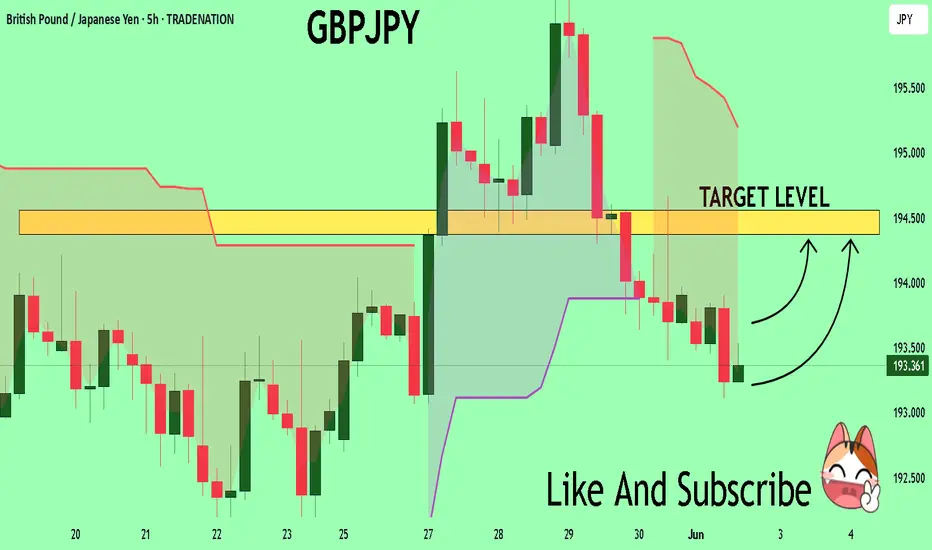
GBPJPY Will Go Up! Buy!
Take a look at our analysis for GBPJPY.
Time Frame: 9h
Current Trend: Bullish
Sentiment: Oversold (based on 7-period RSI)
Forecast: Bullish
The market is on a crucial zone of demand 194.411.
The oversold market condition in a combination with key structure gives us a relatively strong bullish signal with goal 196.230 level.
P.S
Please, note that an oversold/overbought condition can last for a long time, and therefore being oversold/overbought doesn't mean a price rally will come soon, or at all.
Disclosure: I am part of Trade Nation's Influencer program and receive a monthly fee for using their TradingView charts in my analysis.
Like and subscribe and comment my ideas if you enjoy them!
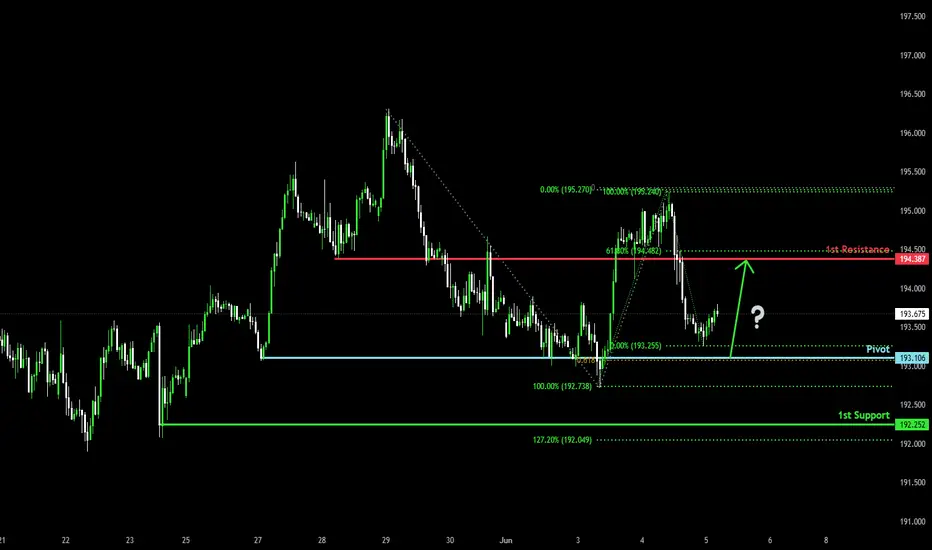
Bullish bounce?GBP/JPY is falling towards the pivot, which had been identified as a pullback support and could bounce to the 61.8% Fibonacci resistance.
Pivot: 193.10
1st Support: 192.25
1st Resistance: 194.38
Risk Warning:
Trading Forex and CFDs carries a high level of risk to your capital and you should only trade with money you can afford to lose. Trading Forex and CFDs may not be suitable for all investors, so please ensure that you fully understand the risks involved and seek independent advice if necessary.
Disclaimer:
The above opinions given constitute general market commentary, and do not constitute the opinion or advice of IC Markets or any form of personal or investment advice.
Any opinions, news, research, analyses, prices, other information, or links to third-party sites contained on this website are provided on an "as-is" basis, are intended only to be informative, is not an advice nor a recommendation, nor research, or a record of our trading prices, or an offer of, or solicitation for a transaction in any financial instrument and thus should not be treated as such. The information provided does not involve any specific investment objectives, financial situation and needs of any specific person who may receive it. Please be aware, that past performance is not a reliable indicator of future performance and/or results. Past Performance or Forward-looking scenarios based upon the reasonable beliefs of the third-party provider are not a guarantee of future performance. Actual results may differ materially from those anticipated in forward-looking or past performance statements. IC Markets makes no representation or warranty and assumes no liability as to the accuracy or completeness of the information provided, nor any loss arising from any investment based on a recommendation, forecast or any information supplied by any third-party.
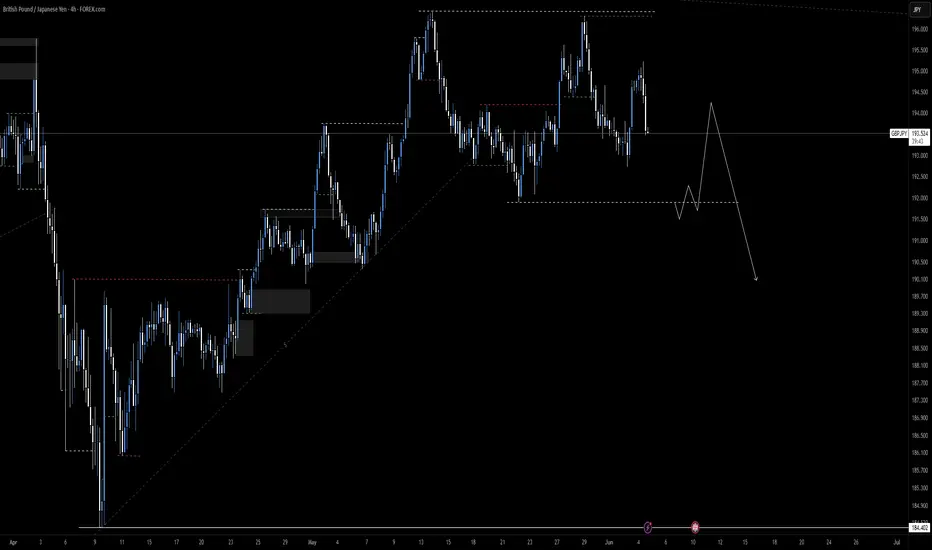
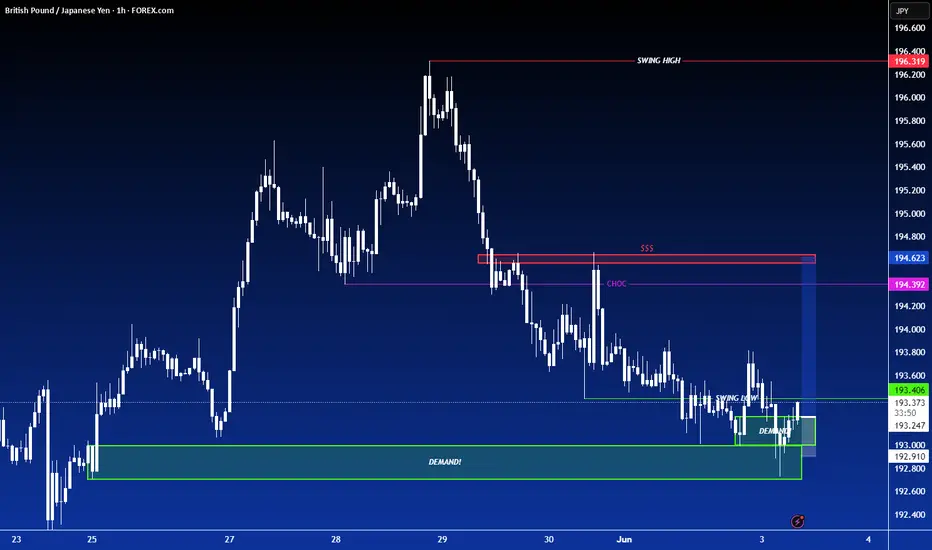
GBPJPY OUTLOOKWe saw price took a shift which validated a bull structure while gathering up liquidity. Now price is currently moving sideways which shows buyers are lagging. I see sellers coming in here once support gets broken. I will be hoping in for a sell after the breakout at the nearest order block.
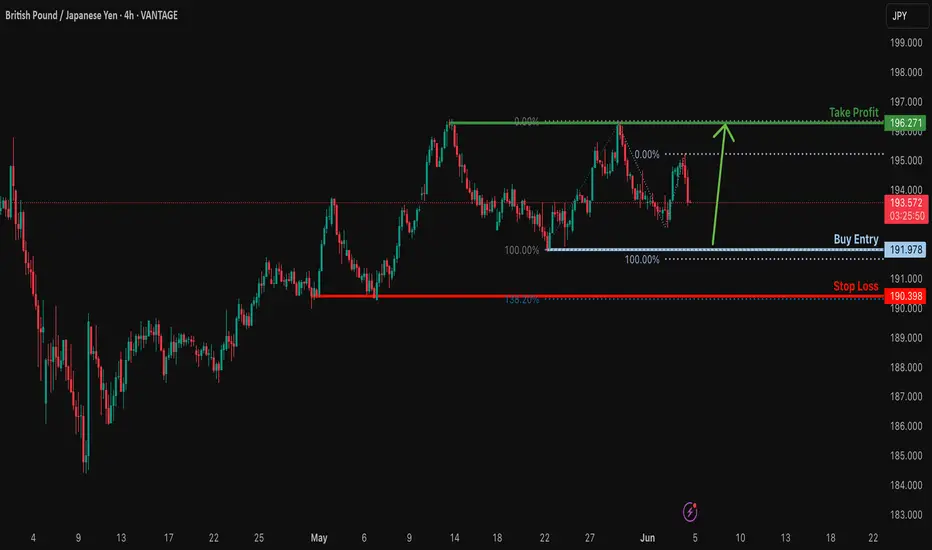
Bullish bounce?GBP/JPY is falling towards the support level which is a pullback support that is slightly above the 100% Fibonacci projection and could bounce from this level to our take profit.
Entry: 191.97
Why we like it:
There is a pullback support level that is slightly above the 100% Fibonacci projection.
Stop loss: 190.39
Why we like it:
There is a pullback support level that lines up with the 138.2% Fibonacci extension.
Take profit: 196.27
Why we like it:
There is a pullback resistance level.
Enjoying your TradingView experience? Review us!
Please be advised that the information presented on TradingView is provided to Vantage (‘Vantage Global Limited’, ‘we’) by a third-party provider (‘Everest Fortune Group’). Please be reminded that you are solely responsible for the trading decisions on your account. There is a very high degree of risk involved in trading. Any information and/or content is intended entirely for research, educational and informational purposes only and does not constitute investment or consultation advice or investment strategy. The information is not tailored to the investment needs of any specific person and therefore does not involve a consideration of any of the investment objectives, financial situation or needs of any viewer that may receive it. Kindly also note that past performance is not a reliable indicator of future results. Actual results may differ materially from those anticipated in forward-looking or past performance statements. We assume no liability as to the accuracy or completeness of any of the information and/or content provided herein and the Company cannot be held responsible for any omission, mistake nor for any loss or damage including without limitation to any loss of profit which may arise from reliance on any information supplied by Everest Fortune Group.
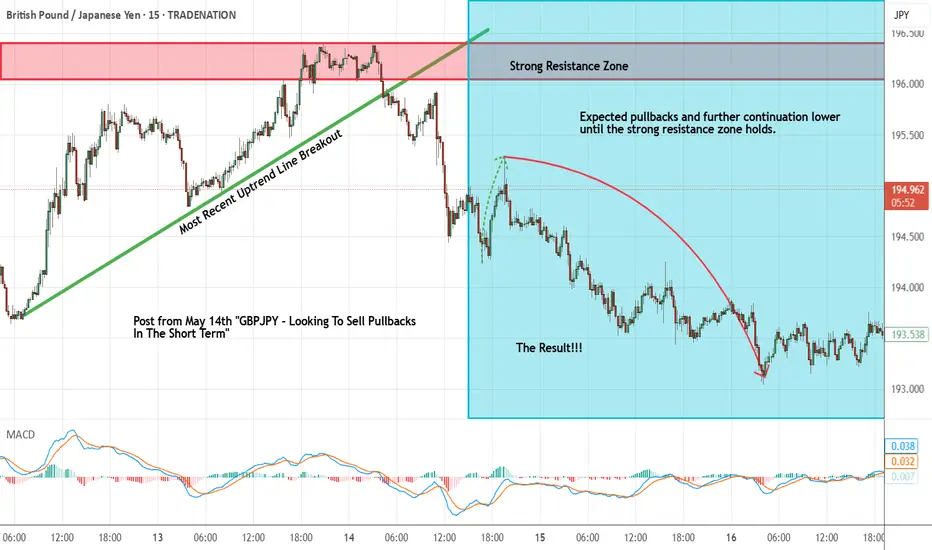
GBPJPY - Short Term Sell Trade Update!!!Hi Traders, on May 14th I shared this idea "GBPJPY - Looking To Sell Pullbacks In The Short Term"
I expected to see pullbacks and further continuation lower until the strong resistance zone holds. You can read the full post using the link above.
Pullback and push lower happened as per the plan!!!
If you enjoy this idea, don’t forget to LIKE 👍, FOLLOW ✅, SHARE 🙌, and COMMENT ✍! Drop your thoughts and charts below to keep the discussion going. Your support helps keep this content free and reach more people! 🚀
-------------------------------------------------------------------------------------------------------------------
Disclosure: I am part of Trade Nation's Influencer program and receive a monthly fee for using their TradingView charts in my analysis.
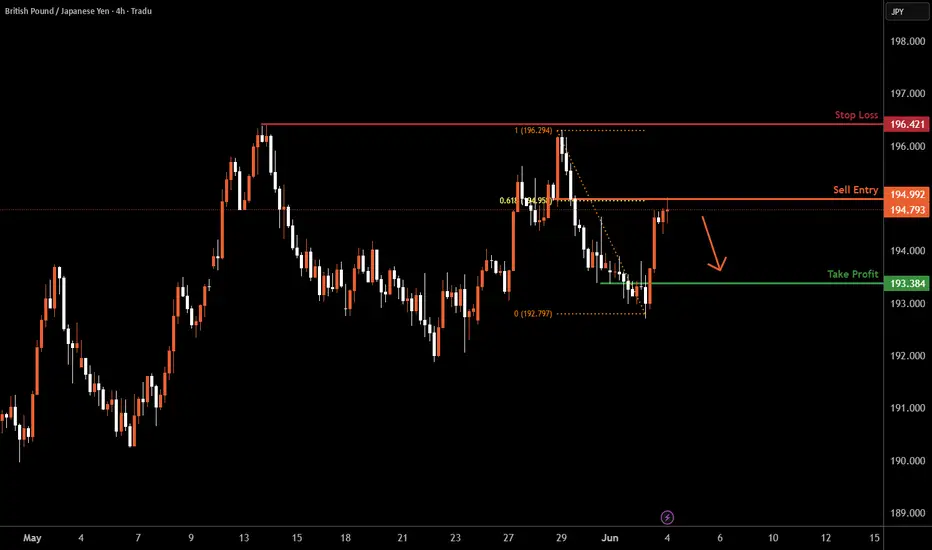
GBPJPY H4 | Bearish Fall Based on the H4 chart, the price has just reacted off our sell entry level at 194.99, a pullback resistance that aligns with the 61.8% Fib retracement.
Our take profit is set at 193.38 a pullback support.
The stop loss is set at 196.42, a swing high resistance.
High Risk Investment Warning
Trading Forex/CFDs on margin carries a high level of risk and may not be suitable for all investors. Leverage can work against you.
Stratos Markets Limited (tradu.com ):
CFDs are complex instruments and come with a high risk of losing money rapidly due to leverage. 63% of retail investor accounts lose money when trading CFDs with this provider. You should consider whether you understand how CFDs work and whether you can afford to take the high risk of losing your money.
Stratos Europe Ltd (tradu.com ):
CFDs are complex instruments and come with a high risk of losing money rapidly due to leverage. 63% of retail investor accounts lose money when trading CFDs with this provider. You should consider whether you understand how CFDs work and whether you can afford to take the high risk of losing your money.
Stratos Global LLC (tradu.com ):
Losses can exceed deposits.
Please be advised that the information presented on TradingView is provided to Tradu (‘Company’, ‘we’) by a third-party provider (‘TFA Global Pte Ltd’). Please be reminded that you are solely responsible for the trading decisions on your account. There is a very high degree of risk involved in trading. Any information and/or content is intended entirely for research, educational and informational purposes only and does not constitute investment or consultation advice or investment strategy. The information is not tailored to the investment needs of any specific person and therefore does not involve a consideration of any of the investment objectives, financial situation or needs of any viewer that may receive it. Kindly also note that past performance is not a reliable indicator of future results. Actual results may differ materially from those anticipated in forward-looking or past performance statements. We assume no liability as to the accuracy or completeness of any of the information and/or content provided herein and the Company cannot be held responsible for any omission, mistake nor for any loss or damage including without limitation to any loss of profit which may arise from reliance on any information supplied by TFA Global Pte Ltd.
The speaker(s) is neither an employee, agent nor representative of Tradu and is therefore acting independently. The opinions given are their own, constitute general market commentary, and do not constitute the opinion or advice of Tradu or any form of personal or investment advice. Tradu neither endorses nor guarantees offerings of third-party speakers, nor is Tradu responsible for the content, veracity or opinions of third-party speakers, presenters or participants.
gbpjpy sell signal. Don't forget about stop-loss.
Write in the comments all your questions and instruments analysis of which you want to see.
Friends, push the like button, write a comment, and share with your mates - that would be the best THANK YOU.
P.S. I personally will open entry if the price will show it according to my strategy.
Always make your analysis before a trade
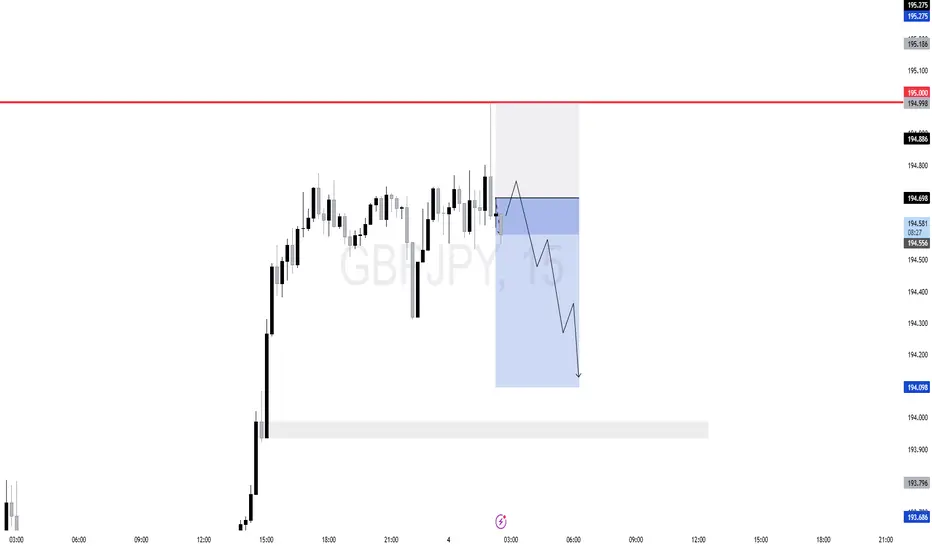
GBPJPY 15-min chart setup✅ What I Like:
Liquidity Sweep at 195.000: Price ran buy-side liquidity above a clear psychological level and showed signs of rejection — classic manipulation.
FVG + Premium Retracement: The short setup aligns with an entry around the 0.618–0.75 retracement zone of the recent leg up, which is also inside a fair value gap.
Timing
🔻 Concerns:
Momentum: The bullish impulse leading to 195.000 was strong. If no displacement confirms the move down, price may consolidate or go higher.
No Strong Break of Structure Yet: To validate full bearish intent, I'd prefer to see a solid break below a recent short-term low (market structure shift).
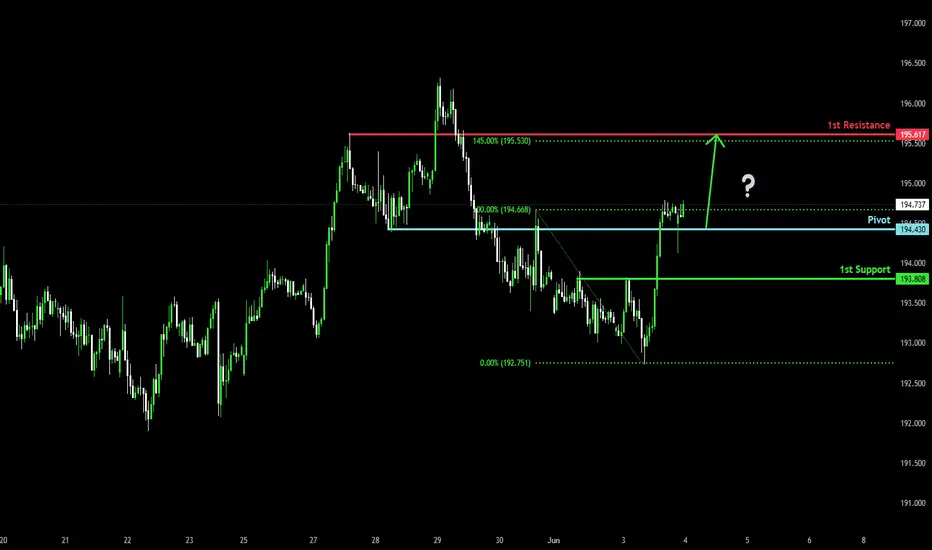
Potential bullish rise?GBP/JPY has reacted off the pivot and could rise to the 145% Fibonacci resistance.
Pivot: 194.43
1st Support: 193.80
1st Resistance: 195.61
Risk Warning:
Trading Forex and CFDs carries a high level of risk to your capital and you should only trade with money you can afford to lose. Trading Forex and CFDs may not be suitable for all investors, so please ensure that you fully understand the risks involved and seek independent advice if necessary.
Disclaimer:
The above opinions given constitute general market commentary, and do not constitute the opinion or advice of IC Markets or any form of personal or investment advice.
Any opinions, news, research, analyses, prices, other information, or links to third-party sites contained on this website are provided on an "as-is" basis, are intended only to be informative, is not an advice nor a recommendation, nor research, or a record of our trading prices, or an offer of, or solicitation for a transaction in any financial instrument and thus should not be treated as such. The information provided does not involve any specific investment objectives, financial situation and needs of any specific person who may receive it. Please be aware, that past performance is not a reliable indicator of future performance and/or results. Past Performance or Forward-looking scenarios based upon the reasonable beliefs of the third-party provider are not a guarantee of future performance. Actual results may differ materially from those anticipated in forward-looking or past performance statements. IC Markets makes no representation or warranty and assumes no liability as to the accuracy or completeness of the information provided, nor any loss arising from any investment based on a recommendation, forecast or any information supplied by any third-party.
GBPJPY What Next? BUY!
My dear subscribers,
This is my opinion on the GBPJPY next move:
The instrument tests an important psychological level 193.34
Bias - Bullish
Technical Indicators: Supper Trend gives a precise Bullish signal, while Pivot Point HL predicts price changes and potential reversals in the market.
Target - 194.37
About Used Indicators:
On the subsequent day, trading above the pivot point is thought to indicate ongoing bullish sentiment, while trading below the pivot point indicates bearish sentiment.
Disclosure: I am part of Trade Nation's Influencer program and receive a monthly fee for using their TradingView charts in my analysis.
———————————
WISH YOU ALL LUCK
LONG ON GBP/JPYGJ has given us a double bottom at a major demand level.
I am looking to catch over 100 pips on GJ to the previous high.

GBPJPYGBPJPY price has a chance to test the support zone 192.349-192.002. If the price cannot break through the 192.002 level, it is expected that in the short term, there is a chance that the price will rebound. Consider buying the red zone.
🔥Trading futures, forex, CFDs and stocks carries a risk of loss.
Please consider carefully whether such trading is suitable for you.
>>GooD Luck 😊
❤️ Like and subscribe to never miss a new idea!

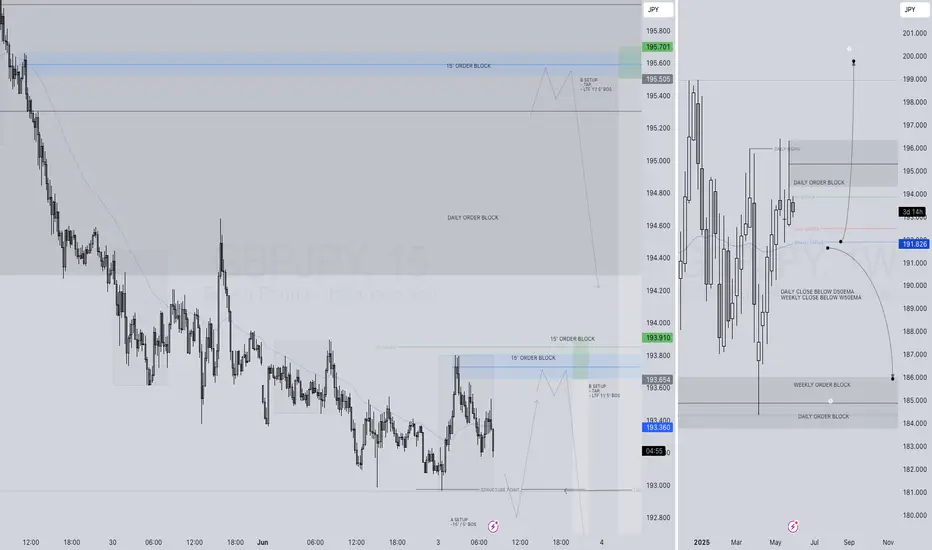
GBPJPY LONG FORECAST Q2 W23 D3 Y25GBPJPY LONG FORECAST Q2 W23 D3 Y25
Professional Risk Managers👋
Welcome back to another FRGNT chart update📈
Diving into some Forex setups using predominantly higher time frame order blocks alongside confirmation breaks of structure.
Let’s see what price action is telling us today!
💡Here are some trade confluences📝
✅Daily order block
✅15' order block
✅Intraday breaks of structure
✅4H 50 EMA rejection
🔑 Remember, to participate in trading comes always with a degree of risk, therefore as professional risk managers it remains vital that we stick to our risk management plan as well as our trading strategies.
📈The rest, we leave to the balance of probabilities.
💡Fail to plan. Plan to fail.
🏆It has always been that simple.
❤️Good luck with your trading journey, I shall see you at the very top.
🎯Trade consistent, FRGNT X
GBPJPY Potential UpsidesHey Traders, in the coming week we are monitoring GBPJPY for a buying opportunity around 193.300 zone, GBPJPY is trading in an uptrend and currently is in a correction phase in which it is approaching the trend at 193.300 support and resistance area.
Trade safe, Joe.
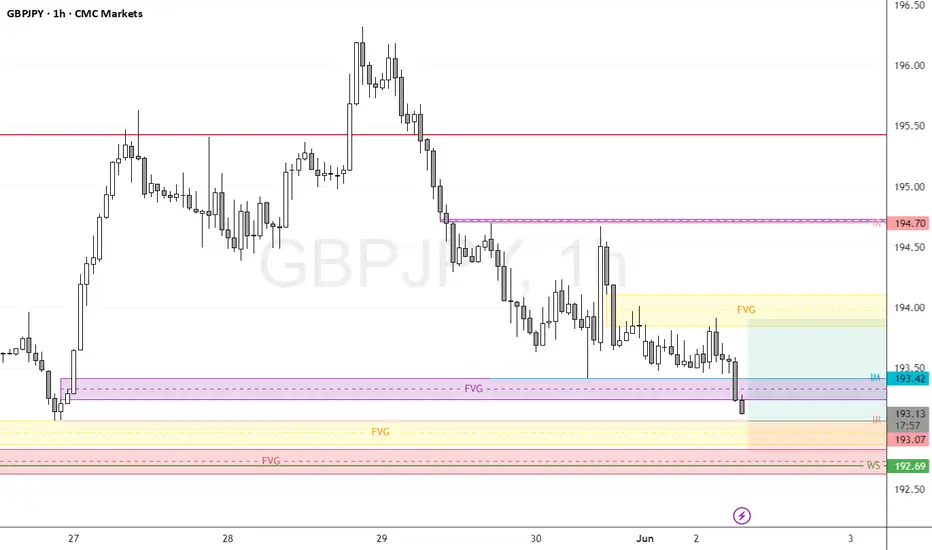
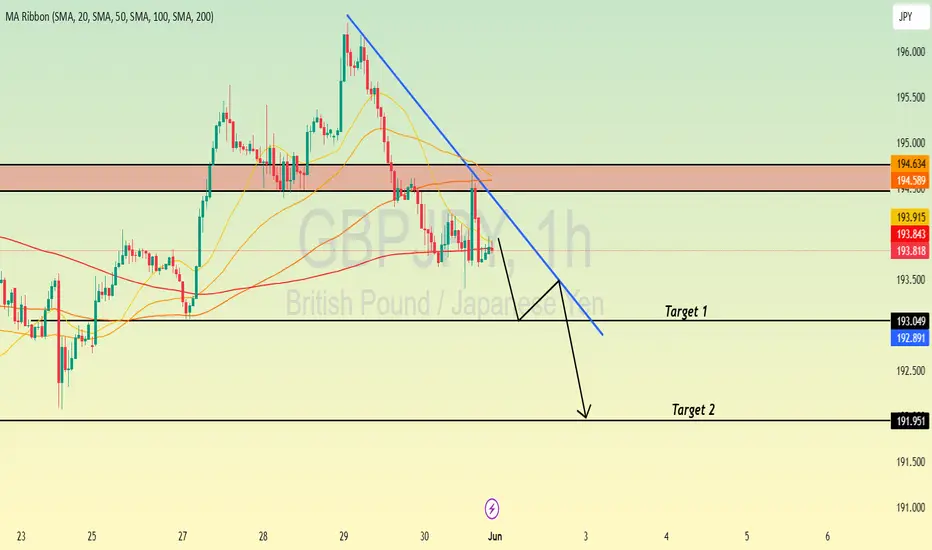
GBP/JPY Dips in Tokyo & London—What’s Next for Price Action?FenzoFx—GBP/JPY dipped from 194.6 during the Tokyo and London sessions, now trading around 193.1. Price is testing support near the May 27 low, ahead of the New York session.
A bounce from 193.0 could push GBP/JPY toward 193.5, with a bullish wave possible if price closes above that level, targeting 194.6. However, stabilizing below 193.0 would invalidate this outlook, with the next bearish target at 192.5.
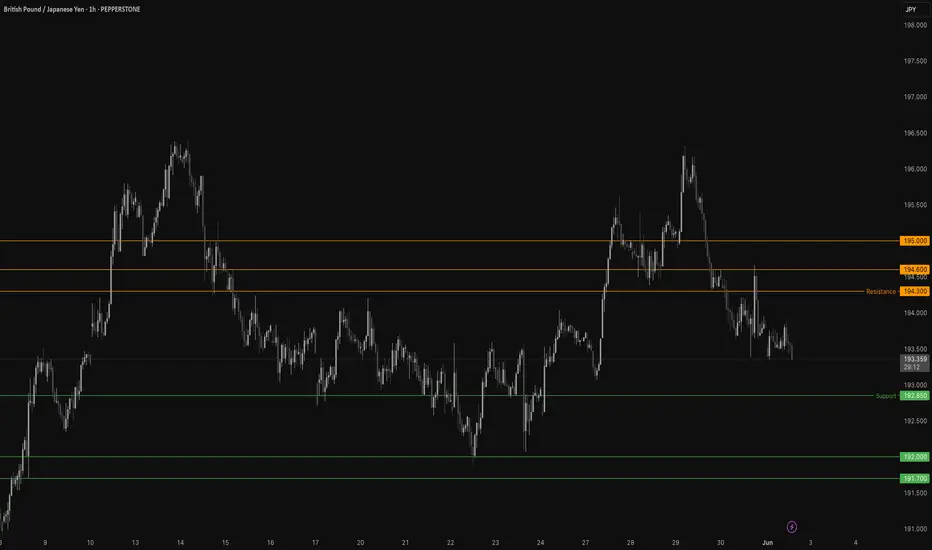
Yen Strength Persists: GBP/JPY Faces Downward PressureGBPJPY is dropping in worth vs the Japanese Yen since the Federal Reserve in the US is expected to lower interest rates while the Bank of Japan might increase them. This increases the appeal of the yen for investors. One pound will get you 193.54 Yen today, having dropped as low as 193.44 earlier today. Experts expect this negative trend to persist as long as the price remains below 194.60.
With the Fed keeping higher rates (4.25%-4.5%) and hinting at a conservative approach to rate cuts given ongoing inflation, the Federal Reserve and the Bank of Japan are on opposite monetary policy directions. The BOJ has kept its policy rate much lower (0.5%), but hinted at possible tightening. Particularly in the USD/JPY pair, this separation has affected currency volatility, with possible yen appreciation should the BOJ turn hawkish or the Fed become more dovish. Key drivers for investor strategies are market expectations and economic data releases in both countries, however some experts argue that the impact of this difference may be less strong than in past cycles because of more general global economic conditions.
The GBP/JPY pair is trading below 55 and 200 EMA (Short-term) and above 365 EMA (long-term on the 1-hour chart, confirming a mixed trend. Any violation below 193.40 indicates the intraday trend is weak. A dip to 192.85/192/191.70/191 /190 is possible. Immediate resistance is at 194.30, a breach above this level targets of 194.60/195/196.50/.
Market Indicators (1- hour)
CCI (50)- Bearish
Directional movement index - Bearish
Trading Strategy: Sell on rallies
It Is good to sell on rallies around 194 with SL around 195 for a TP of 192.
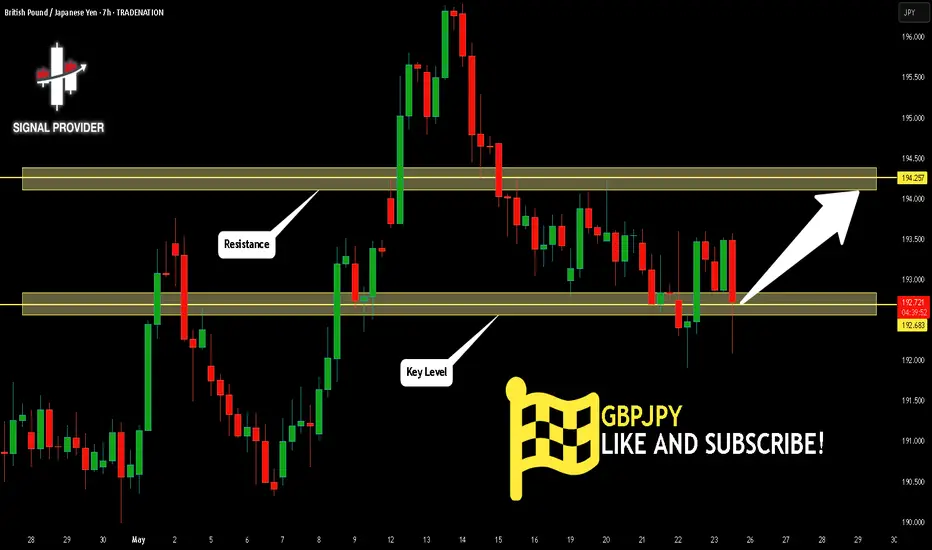
GBPJPY Is Very Bullish! Long!
Please, check our technical outlook for GBPJPY.
Time Frame: 7h
Current Trend: Bullish
Sentiment: Oversold (based on 7-period RSI)
Forecast: Bullish
The price is testing a key support 192.683.
Current market trend & oversold RSI makes me think that buyers will push the price. I will anticipate a bullish movement at least to 194.257 level.
P.S
We determine oversold/overbought condition with RSI indicator.
When it drops below 30 - the market is considered to be oversold.
When it bounces above 70 - the market is considered to be overbought.
Disclosure: I am part of Trade Nation's Influencer program and receive a monthly fee for using their TradingView charts in my analysis.
Like and subscribe and comment my ideas if you enjoy them!
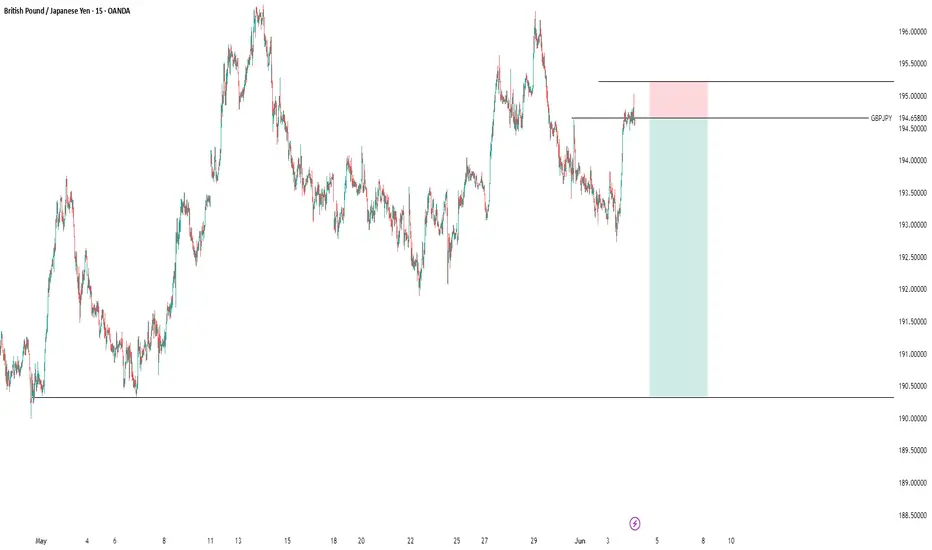
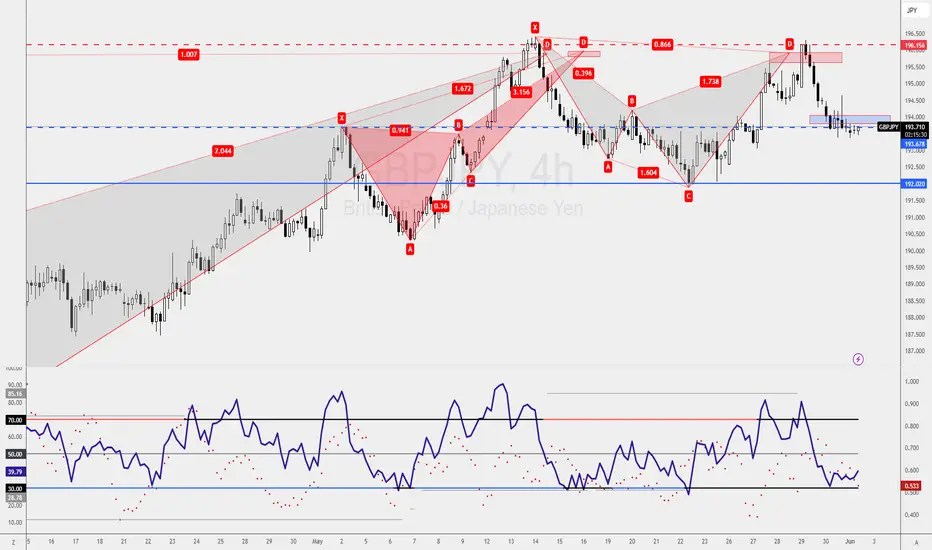
GBPJPY: Bullish 5-0 Setup on the 4-Hourly ChartFrom a higher-timeframe perspective, GBPJPY might seem like it's perfect for a shorting opportunity, but that doesn't mean there aren't great opportunities to go long as well.
Right now, on the 4-hourly chart, I've spotted an interesting Bullish 5-0 setup. To many traders, this might look like an invalid entry. But here’s the catch—if you know how to interpret candlestick patterns correctly, this is exactly the kind of setup that can pay off.
Here’s the Plan:
Bullish 5-0 Pattern Entry: Keep an eye on candlestick confirmations at the current zone.
Risk Management: Identify the key levels clearly—once price reaches these levels, shift your stops to entry to achieve a risk-free trade.
Key Reminder:
It’s not always about being right in direction; it’s about spotting clear entry setups, managing your risk effectively, and protecting your capital.
👉 Golden Rule: Secure a risk-free trade as soon as possible!
Have you traded the Bullish 5-0 before? Do you have similar experiences spotting opportunities against the broader trend?
Let’s discuss below! Happy trading, everyone! 🚀
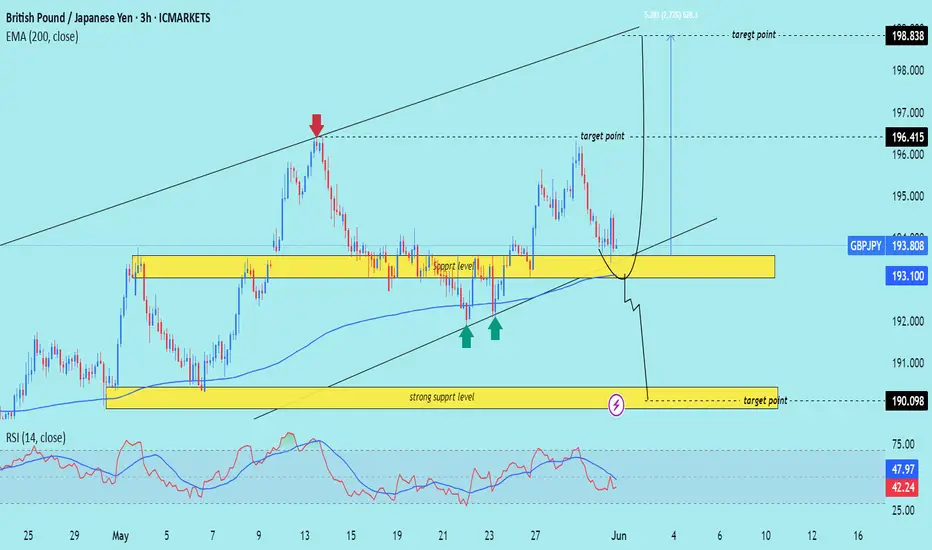
GBP)JPY) Technical analysis setup Read The ChaptianSMC trading point update
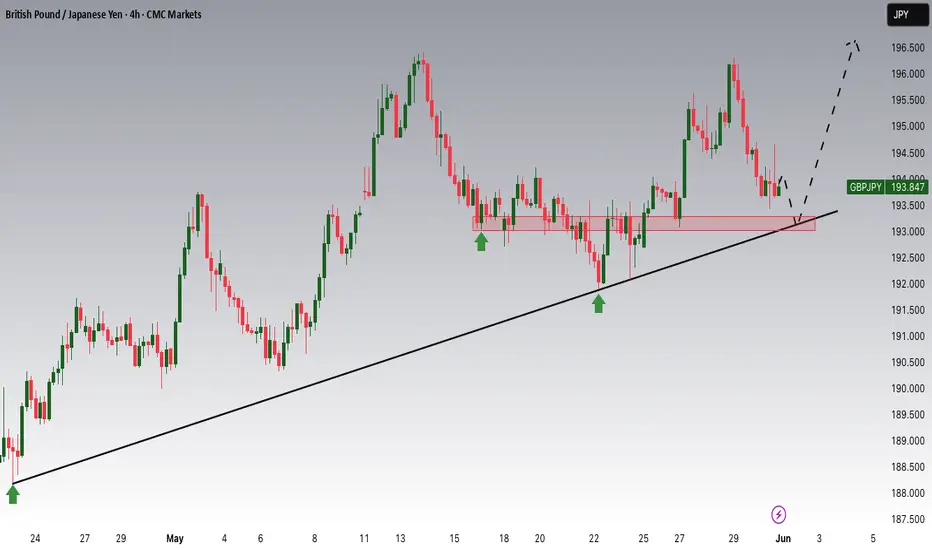
Technical analysis of GBP/JPY (British Pound / Japanese Yen) on the 3-hour timeframe using Smart Money Concepts (SMC) and structure-based patterns.
---
Market Overview
Current Price: 193.808
EMA 200: 193.100 (acting as dynamic support)
RSI (14): 42.24 → Neutral/Bearish territory
---
Two Possible Scenarios (Bullish & Bearish)
Bullish Scenario
Zone of Interest: 193.1–193.5 (support area)
Price is hovering just above the support level and 200 EMA.
Double green arrows mark previous rejections = demand zone.
If price respects support and forms a higher low:
Possible rally to:
First Target: 196.415
Second Target: 198.838
Bearish Scenario
If price breaks below the yellow support zone and 200 EMA:
Clean path down to:
Target Point: 190.098 (marked strong support zone)
---
Zones of Importance
Support Level: 193.0–193.5 (minor support, under retest)
Strong Support Level: ~190.1 (high probability bounce zone)
Target Resistances:
196.415 (intermediate high)
198.838 (major resistance / swing high)
---
Trade Plan Summary
Direction Entry Zone SL Target R/R Potential
Long 193.1–193.5 Below 193.0 196.4 / 198.8 1:2 to 1:3+
Short Below 193.0 Above 194.0 190.1 1:2+
Mr SMC Trading point
---
Additional Notes
Watch price action closely at the support zone before entry.
RSI shows some bearish momentum but not oversold yet.
The outcome may be influenced by JPY strength and macro events (check economic calendar).
pales support boost 🚀 analysis follow)
GBPJPY is in the Down TrendHello Traders
In This Chart GBPJPY HOURLY Forex Forecast By FOREX PLANET
today GBPJPY analysis 👆
🟢This Chart includes_ (GBPJPY market update)
🟢What is The Next Opportunity on GBPJPY Market
🟢how to Enter to the Valid Entry With Assurance Profit
This CHART is For Trader's that Want to Improve Their Technical Analysis Skills and Their Trading By Understanding How To Analyze The Market Using Multiple Timeframes and Understanding The Bigger Picture on the Charts
Double Reject @ March Resistance Spells Good News For GJ BearsOANDA:GBPJPY struggles to reach Higher Prices then that of the High created on March 27th and leads me to believe we could see a Double Top Pattern in the making!
Confirmation of the Pattern will come when:
1) Price declines back to 191.877
&
2) Makes a Breakout of the Confirmation
Once the Pattern is Confirmed and Breakout is Validated:
- This should deliver great Short opportunities as a Double Top Breakout & Retest Set-up!
