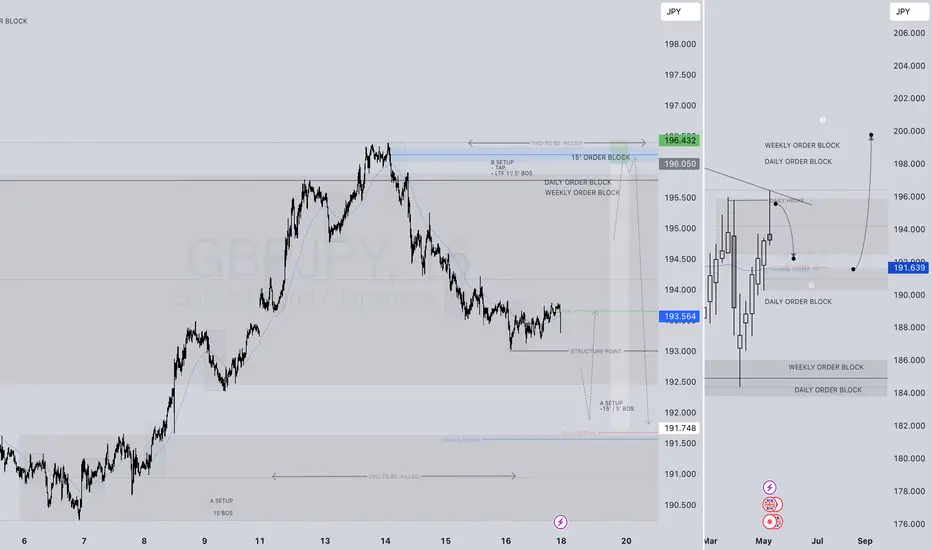
A SHORT SHORT B4 LONG LONG GBPJPY SHORT FORECAST Q2 W21 D20 Y25 A SHORT SHORT B4 LONG LONG LONG
GBPJPY SHORT FORECAST Q2 W21 D20 Y25
Professional Risk Managers👋
Welcome back to another FRGNT chart update📈
Diving into some Forex setups using predominantly higher time frame order blocks alongside confirmation breaks of structure.
Let’s see what price action is telling us today!
💡Here are some trade confluences📝
✅Weekly order block rejection
✅Daily order block rejection
✅Intraday 15' order blocks
✅Tokyo ranges to be filled
🔑 Remember, to participate in trading comes always with a degree of risk, therefore as professional risk managers it remains vital that we stick to our risk management plan as well as our trading strategies.
📈The rest, we leave to the balance of probabilities.
💡Fail to plan. Plan to fail.
🏆It has always been that simple.
❤️Good luck with your trading journey, I shall see you at the very top.
🎯Trade consistent, FRGNT X
GBPJPY
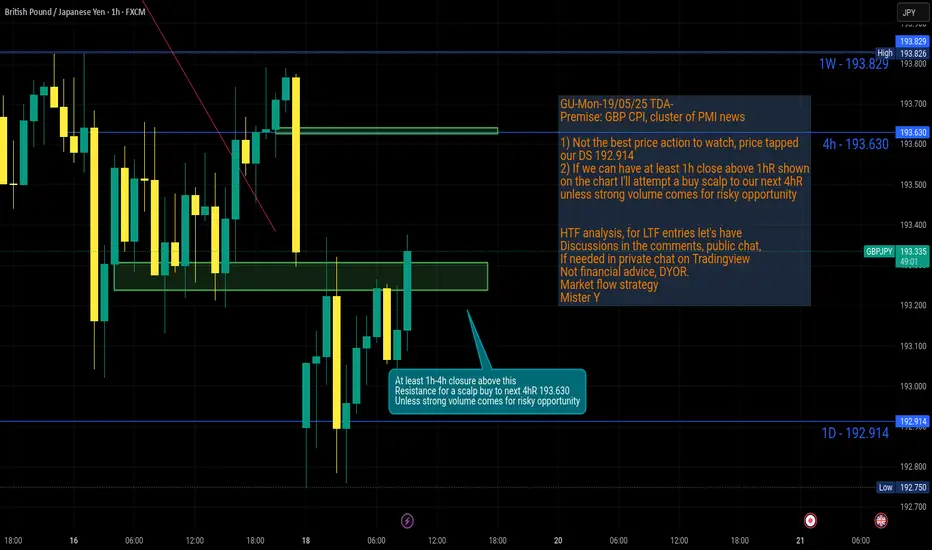
GJ-Tue-20/05/25 TDA-Uncertainty ahead of GBP CPI!Analysis done directly on the chart
Follow for more, possible live trades update!
Knowledge per se won't make you money, it is
applying the knowledge and in this case in trading
doing live trades will help you to possibly make money.
Not financial advice, DYOR.
Market Flow Strategy
Mister Y

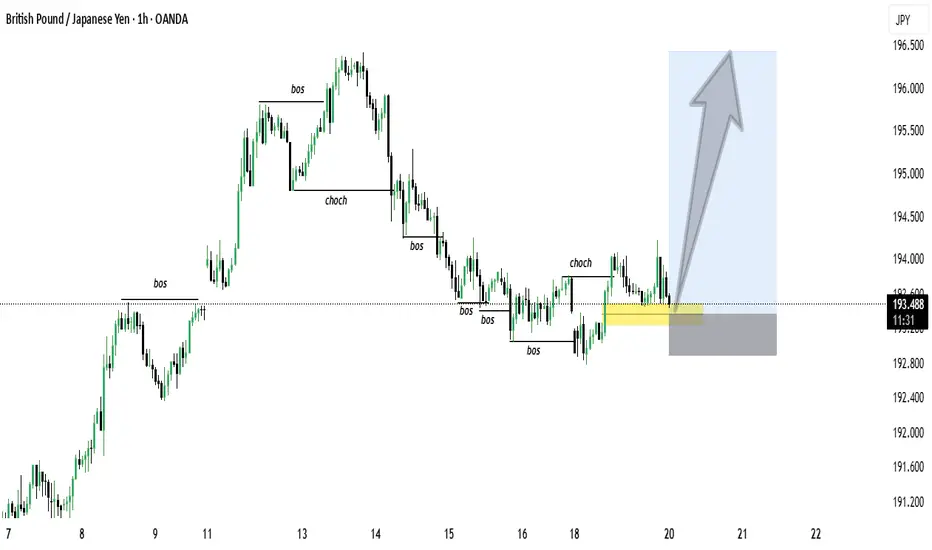
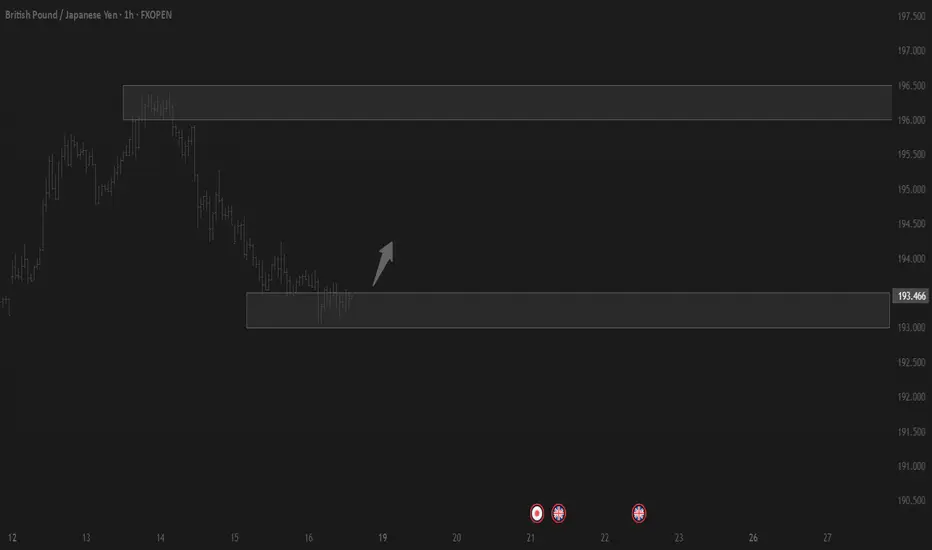
GBP/JPY 1H Chart Analysis – Bullish Breakout PotentialPublished on May 20, 2025, this 1-hour GBP/JPY chart highlights a key technical setup. The price has been consolidating within a tight range after a sharp decline, forming a potential accumulation zone between 193.47 and 193.80 (yellow rectangle). Multiple tests of the "BOS" (Break of Structure) levels indicate strong support and resistance zones, with a recent "CHOCH" (Change of Character) signaling a shift in momentum.
The price is now approaching a critical resistance at 193.80. A breakout above this level could confirm a bullish trend, potentially targeting 195.00 and beyond (blue arrow). Traders should watch for a strong close above 193.80 with increased volume to validate the breakout. Conversely, a rejection at this level may lead to a retest of the lower support at 193.47.
Key Levels:
Support: 193.47
Resistance: 193.80
Potential Target: 195.00+
Stay cautious of false breakouts and monitor price action closely! #GBPJPY #Forex
GBPUSD and GBPJPY Analysis todayHello traders, this is a complete multiple timeframe analysis of this pair. We see could find significant trading opportunities as per analysis upon price action confirmation we may take this trade. Smash the like button if you find value in this analysis and drop a comment if you have any questions or let me know which pair to cover in my next analysis.

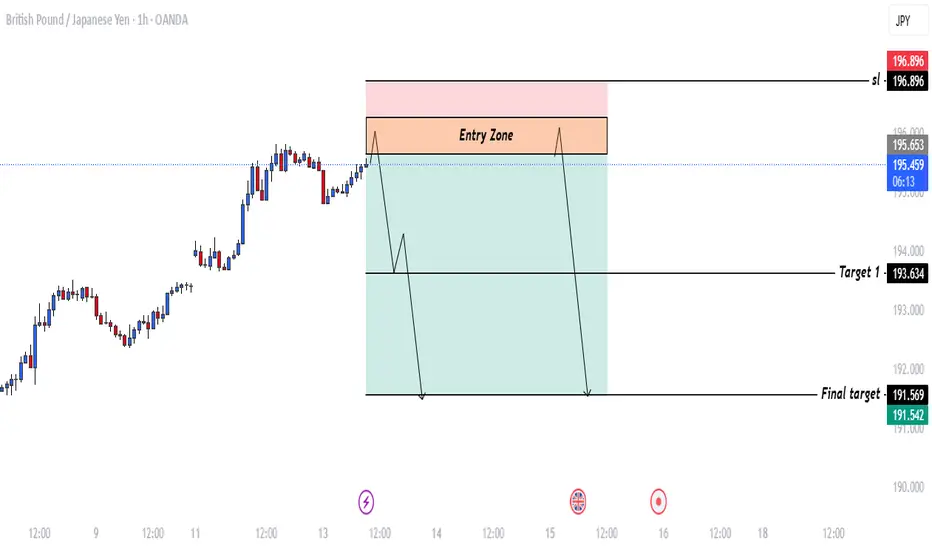
GBP/JPY (British Pound / Japanese Yen) trade idea.The chart represents a trade setup for GBP/JPY on the 1-hour timeframe. Here's a breakdown:
Key Zones and Levels:
Entry Zone:
Highlighted between approximately 195.653 and 196.200
This is where the trader expects price to reverse and start moving downward.
Stop Loss (SL):
Set at 196.896
If price moves above this level, the trade idea is invalidated.
Target 1:
Set at 193.634
A partial take-profit level where the trader might secure some gains.
Final Target:
Set at 191.542 – 191.569
This is the ultimate take-profit level if the trade goes as planned.
Expected Price Action :
Price is expected to enter the Entry Zone, then reverse downward.
It may consolidate or make a pullback, then continue dropping.
The move is expected to reach Target 1, followed by the Final Target.
GJ-Mon-19/05/25 TDA-Possible scalp buy to 4hR 193.630Analysis done directly on the chart
Follow for more, possible live trades update!
Unless it's systematic approach to trading, all
manual execution trade come from some form
of price action trading. (different people call it
in different ways) If you have a different idea,
comment down below! Let's have a good discussion!
Not financial advice, DYOR.
Market Flow Strategy
Mister Y
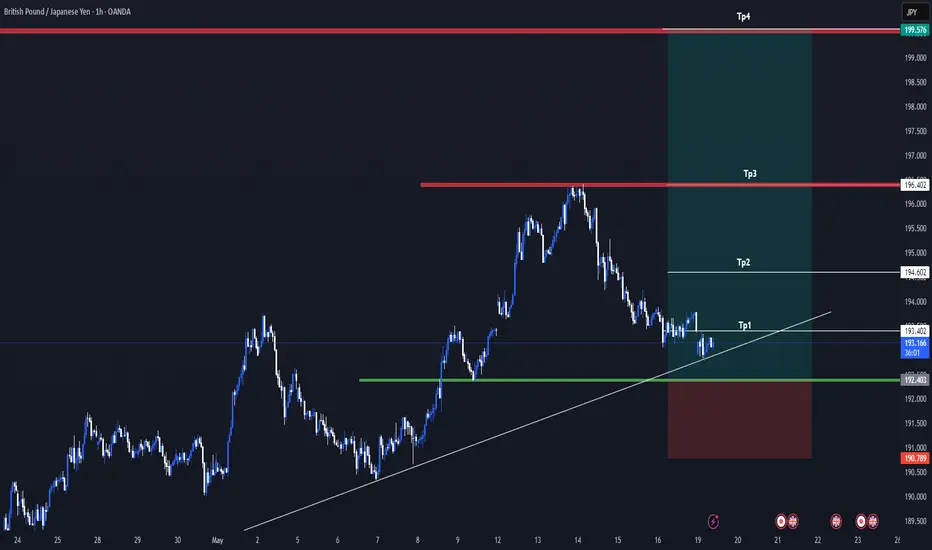
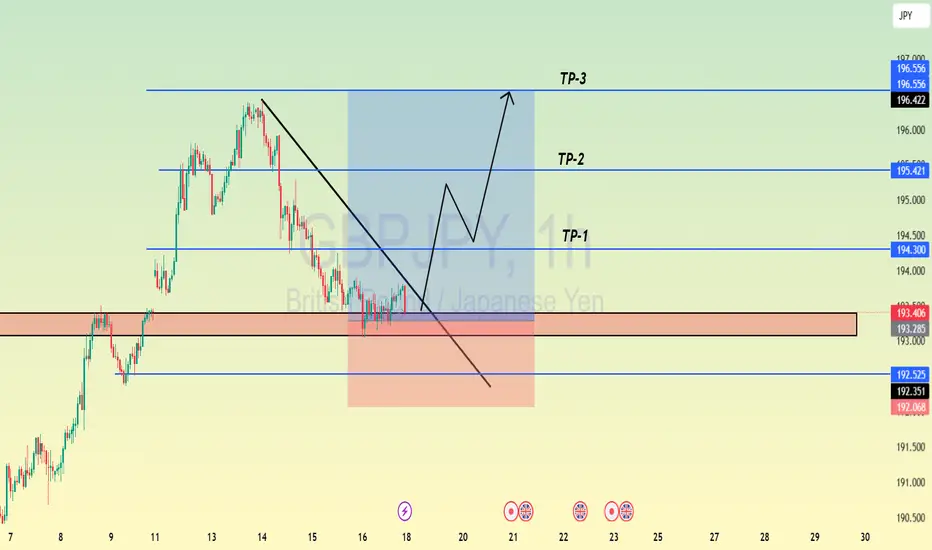
GBPJPY Signal : 1H / 4H Beautiful buy !!!Hello Traders! 👋
What are your thoughts on GBPJPY ?
Symbol : GBPJPY H1
Market price : 193.20
BUY limit : 192.40 - 192.00
Tp1 :193.40
Tp2 : 194.60
Tp3 : 196.40
Tp4 : 199.60
Sl : 190.80
Don’t forget to like and share your thoughts in the comments! ❤️
Remember this is a position that was found by me and it is a personal idea not a financial advice, you are responsible for your loss and gain.
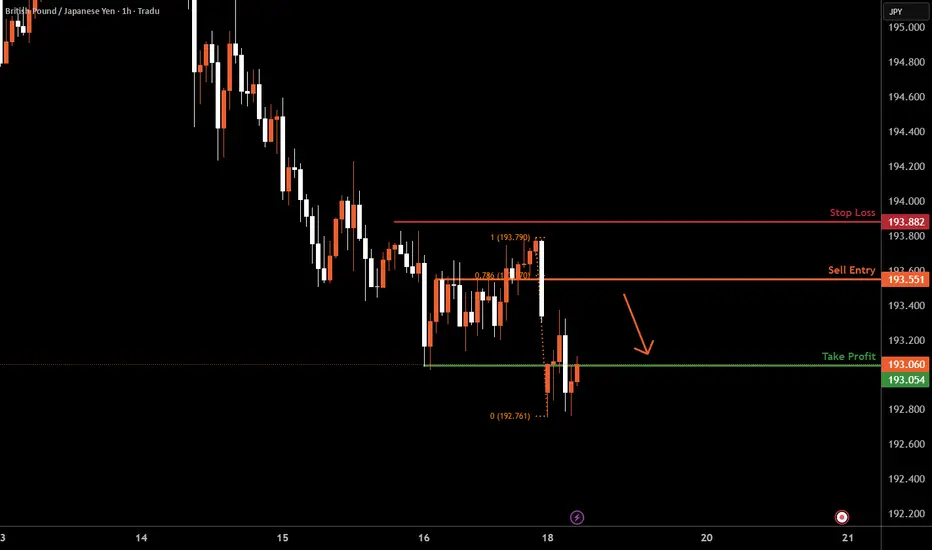
GBPJPY H1 I Bearish ContinuationBased on the H4 chart, the price is rising toward our sell entry level at 193.55, a pullback resistance that aligns with the 78.6 Fibo retracement.
Our take profit is set at 193.05, a pullback support.
The stop loss is set at 193.88, above a swing high resistance.
High Risk Investment Warning
Trading Forex/CFDs on margin carries a high level of risk and may not be suitable for all investors. Leverage can work against you.
Stratos Markets Limited (tradu.com):
CFDs are complex instruments and come with a high risk of losing money rapidly due to leverage. 63% of retail investor accounts lose money when trading CFDs with this provider. You should consider whether you understand how CFDs work and whether you can afford to take the high risk of losing your money.
Stratos Europe Ltd (tradu.com):
CFDs are complex instruments and come with a high risk of losing money rapidly due to leverage. 63% of retail investor accounts lose money when trading CFDs with this provider. You should consider whether you understand how CFDs work and whether you can afford to take the high risk of losing your money.
Stratos Global LLC (tradu.com):
Losses can exceed deposits.
Please be advised that the information presented on TradingView is provided to Tradu (‘Company’, ‘we’) by a third-party provider (‘TFA Global Pte Ltd’). Please be reminded that you are solely responsible for the trading decisions on your account. There is a very high degree of risk involved in trading. Any information and/or content is intended entirely for research, educational and informational purposes only and does not constitute investment or consultation advice or investment strategy. The information is not tailored to the investment needs of any specific person and therefore does not involve a consideration of any of the investment objectives, financial situation or needs of any viewer that may receive it. Kindly also note that past performance is not a reliable indicator of future results. Actual results may differ materially from those anticipated in forward-looking or past performance statements. We assume no liability as to the accuracy or completeness of any of the information and/or content provided herein and the Company cannot be held responsible for any omission, mistake nor for any loss or damage including without limitation to any loss of profit which may arise from reliance on any information supplied by TFA Global Pte Ltd.
The speaker(s) is neither an employee, agent nor representative of Tradu and is therefore acting independently. The opinions given are their own, constitute general market commentary, and do not constitute the opinion or advice of Tradu or any form of personal or investment advice. Tradu neither endorses nor guarantees offerings of third-party speakers, nor is Tradu responsible for the content, veracity or opinions of third-party speakers, presenters or participants.
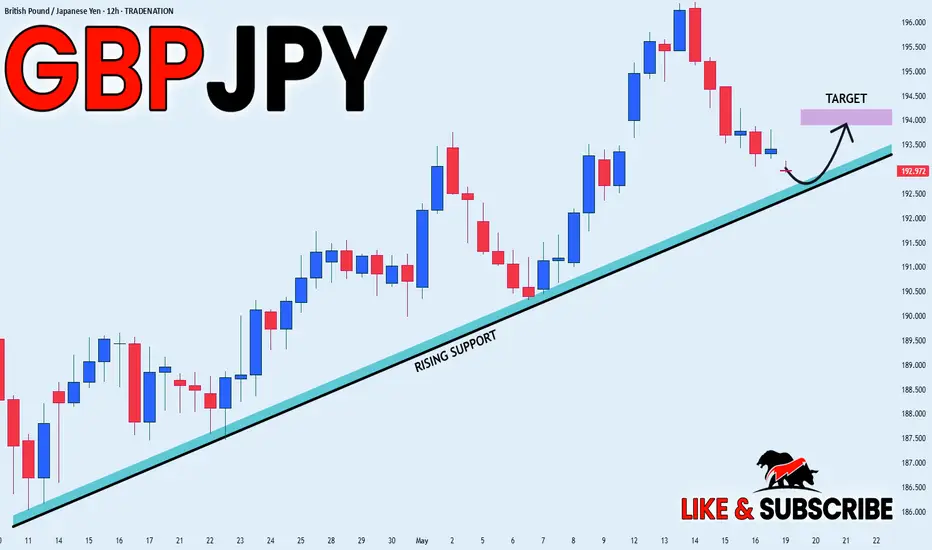
GBP_JPY GROWTH AHEAD|LONG|
✅GBP_JPY is going down now
But a strong support level is ahead
Thus I am expecting a rebound
And a move up towards the target above 194.000
LONG🚀
✅Like and subscribe to never miss a new idea!✅
Disclosure: I am part of Trade Nation's Influencer program and receive a monthly fee for using their TradingView charts in my analysis.
GBPJPY is Holding above the SupportHello Traders
In This Chart GBPJPY HOURLY Forex Forecast By FOREX PLANET
today GBPJPY analysis 👆
🟢This Chart includes_ (GBPJPY market update)
🟢What is The Next Opportunity on GBPJPY Market
🟢how to Enter to the Valid Entry With Assurance Profit
This CHART is For Trader's that Want to Improve Their Technical Analysis Skills and Their Trading By Understanding How To Analyze The Market Using Multiple Timeframes and Understanding The Bigger Picture on the Charts
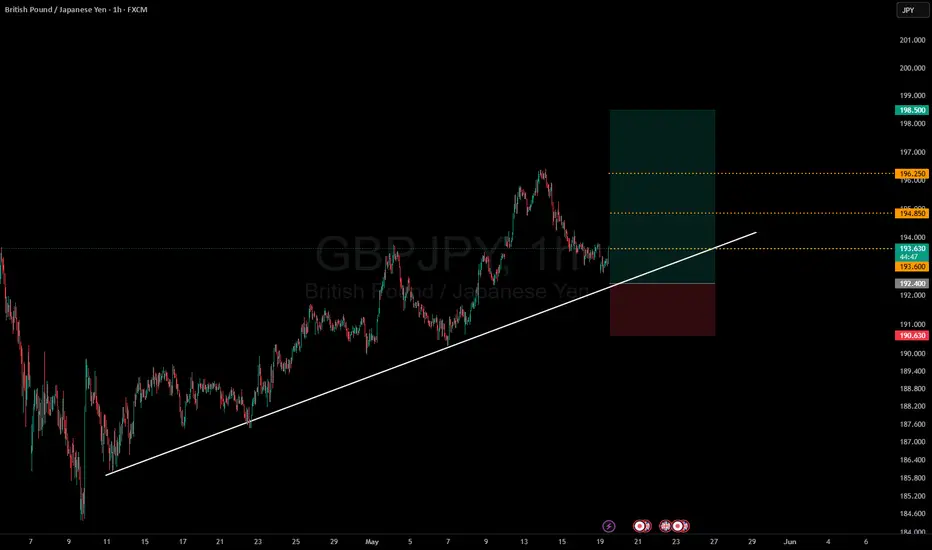
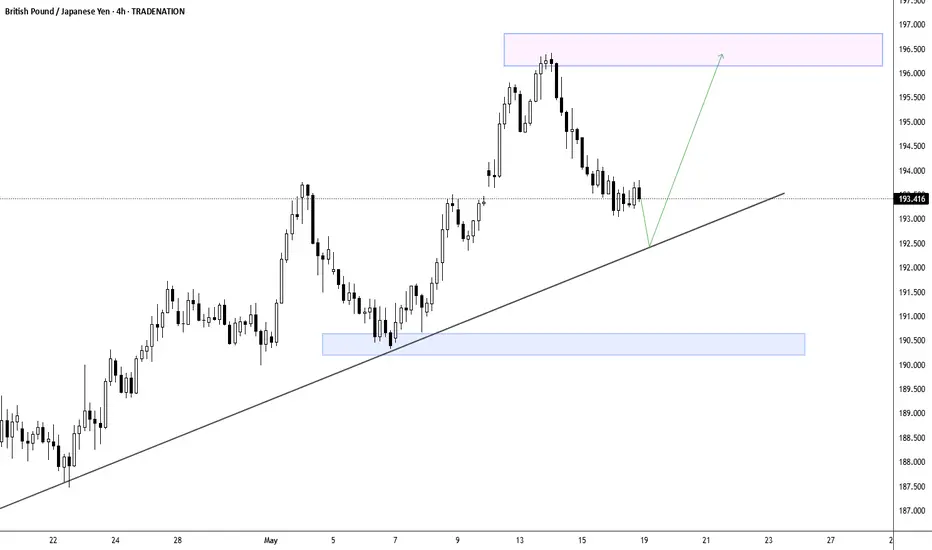
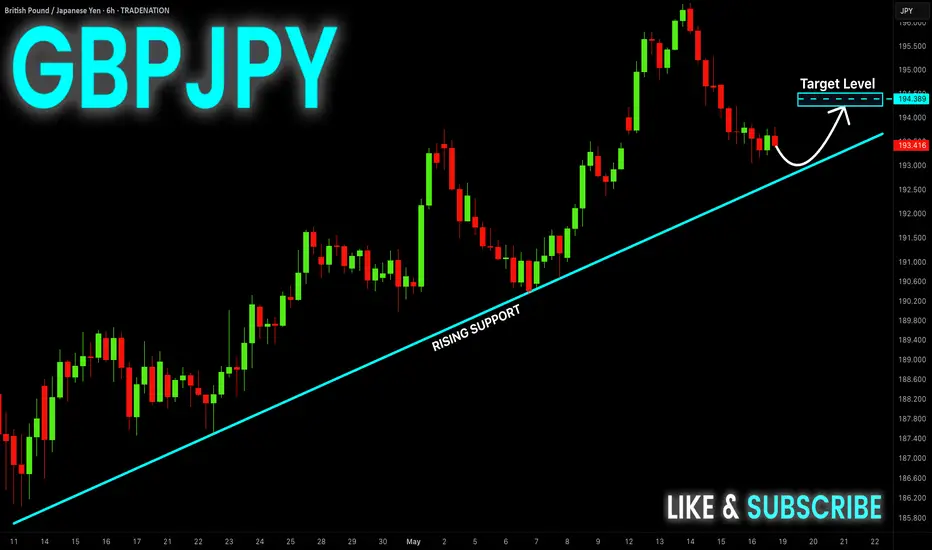
GBPJPY - Poised for Rebound at Major Trendline Support?The GBP/JPY pair is currently trading around the 193.41 level, showing consolidation after a notable correction from its recent peak of approximately 196.30. The clearly defined ascending trendline, which has supported price action since mid-April, remains the critical technical feature to monitor. As the price approaches this trendline support, traders should watch for potential bullish reactions that could propel the currency pair back toward the upper resistance zone marked by the pink rectangle near 196.50. The green arrow suggests a potential path forward with an expected bounce from the trendline followed by renewed upward momentum. However, any decisive break below this trendline would invalidate the bullish structure and possibly trigger a deeper correction toward the lower support zone around 190.50, highlighted by the light blue rectangle.
Disclosure: I am part of Trade Nation's Influencer program and receive a monthly fee for using their TradingView charts in my analysis.
WHERE PRICE GOES...WE FOLLOW GBPJPY LONG FORECAST Q2 W21 Y25WHERE PRICE GOES...WE FOLLOW
GBPJPY LONG FORECAST Q2 W21 Y25
Professional Risk Managers👋
Welcome back to another FRGNT chart update📈
Diving into some Forex setups using predominantly higher time frame order blocks alongside confirmation breaks of structure.
Let’s see what price action is telling us today!
💡Here are some trade confluences📝
✅Weekly order block rejection
✅Daily order block rejection
✅Intraday 15' order blocks
✅Tokyo ranges to be filled
🔑 Remember, to participate in trading comes always with a degree of risk, therefore as professional risk managers it remains vital that we stick to our risk management plan as well as our trading strategies.
📈The rest, we leave to the balance of probabilities.
💡Fail to plan. Plan to fail.
🏆It has always been that simple.
❤️Good luck with your trading journey, I shall see you at the very top.
🎯Trade consistent, FRGNT X
GBP-JPY Long From Rising Support! Buy!
Hello,Traders!
GBP-JPY is trading along
The rising support line
And the pair will soon hit
A trend-line from where we
Will be expecting a local
Bullish rebound and a
Further bullish move up
Buy!
Comment and subscribe to help us grow!
Check out other forecasts below too!
Disclosure: I am part of Trade Nation's Influencer program and receive a monthly fee for using their TradingView charts in my analysis.
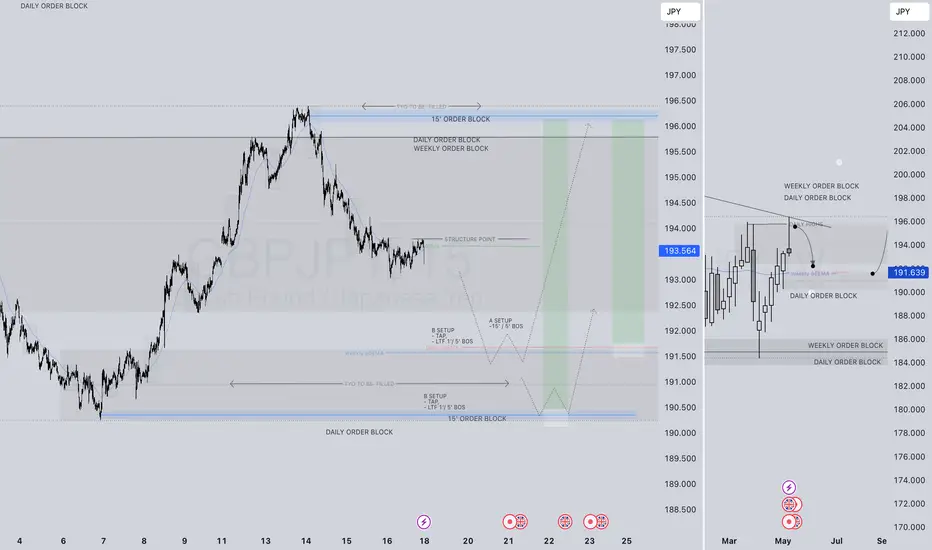
IT DEPENDS WHAT HAPPENS 1ST! GBPJPY SHORT FORECAST Q2 W21 Y25IT DEPENDS WHAT HAPPENS 1ST! GBPJPY SHORT FORECAST Q2 W21 Y25
Professional Risk Managers👋
Welcome back to another FRGNT chart update📈
Diving into some Forex setups using predominantly higher time frame order blocks alongside confirmation breaks of structure.
Let’s see what price action is telling us today!
💡Here are some trade confluences📝
✅Weekly order block rejection
✅Daily order block rejection
✅Intraday 15' order blocks
✅Tokyo ranges to be filled
🔑 Remember, to participate in trading comes always with a degree of risk, therefore as professional risk managers it remains vital that we stick to our risk management plan as well as our trading strategies.
📈The rest, we leave to the balance of probabilities.
💡Fail to plan. Plan to fail.
🏆It has always been that simple.
❤️Good luck with your trading journey, I shall see you at the very top.
🎯Trade consistent, FRGNT X
Trading balanceTrading balance The price of the asset has rebounded from the balance zone. With the prospect of growth into the resistance zone.
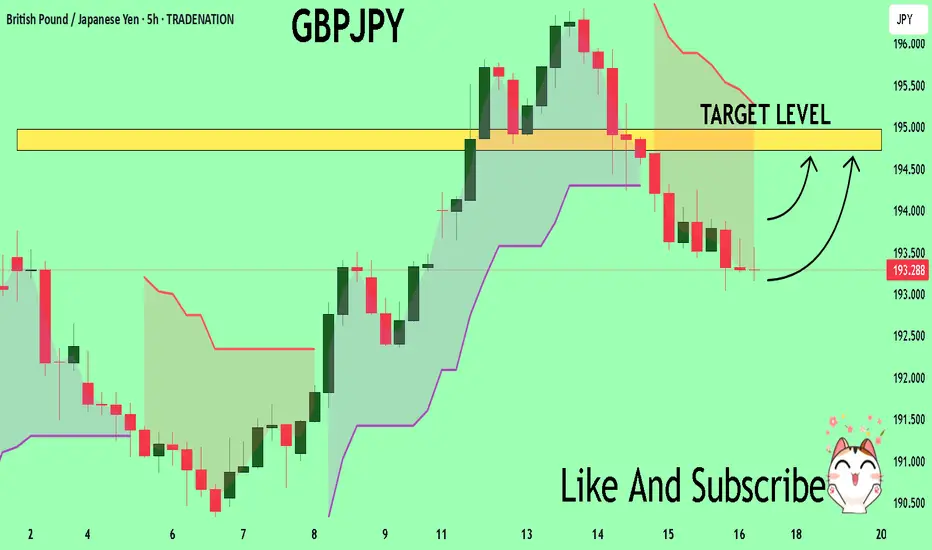
GBPJPY The Target Is UP! BUY!
My dear followers,
I analysed this chart on GBPJPY and concluded the following:
The market is trading on 193.32 pivot level.
Bias - Bullish
Technical Indicators: Both Super Trend & Pivot HL indicate a highly probable Bullish continuation.
Target - 194.72
About Used Indicators:
A super-trend indicator is plotted on either above or below the closing price to signal a buy or sell. The indicator changes color, based on whether or not you should be buying. If the super-trend indicator moves below the closing price, the indicator turns green, and it signals an entry point or points to buy.
Disclosure: I am part of Trade Nation's Influencer program and receive a monthly fee for using their TradingView charts in my analysis.
———————————
WISH YOU ALL LUCK
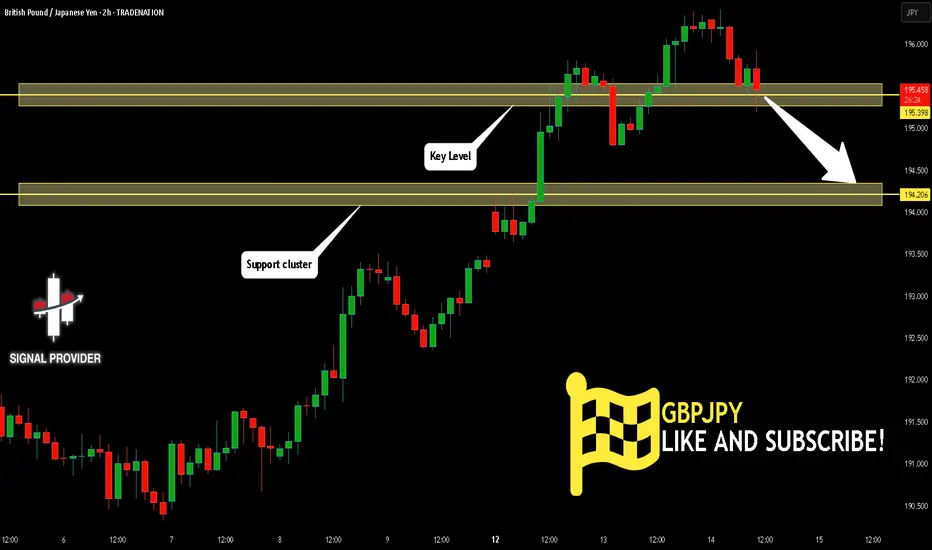
GBPJPY Will Go Lower From Resistance! Sell!
Take a look at our analysis for GBPJPY.
Time Frame: 2h
Current Trend: Bearish
Sentiment: Overbought (based on 7-period RSI)
Forecast: Bearish
The market is on a crucial zone of supply 195.398.
The above-mentioned technicals clearly indicate the dominance of sellers on the market. I recommend shorting the instrument, aiming at 194.206 level.
P.S
We determine oversold/overbought condition with RSI indicator.
When it drops below 30 - the market is considered to be oversold.
When it bounces above 70 - the market is considered to be overbought.
Disclosure: I am part of Trade Nation's Influencer program and receive a monthly fee for using their TradingView charts in my analysis.
Like and subscribe and comment my ideas if you enjoy them!
USDJPY and GBPJPY Analysis todayHello traders, this is a complete multiple timeframe analysis of this pair. We see could find significant trading opportunities as per analysis upon price action confirmation we may take this trade. Smash the like button if you find value in this analysis and drop a comment if you have any questions or let me know which pair to cover in my next analysis.

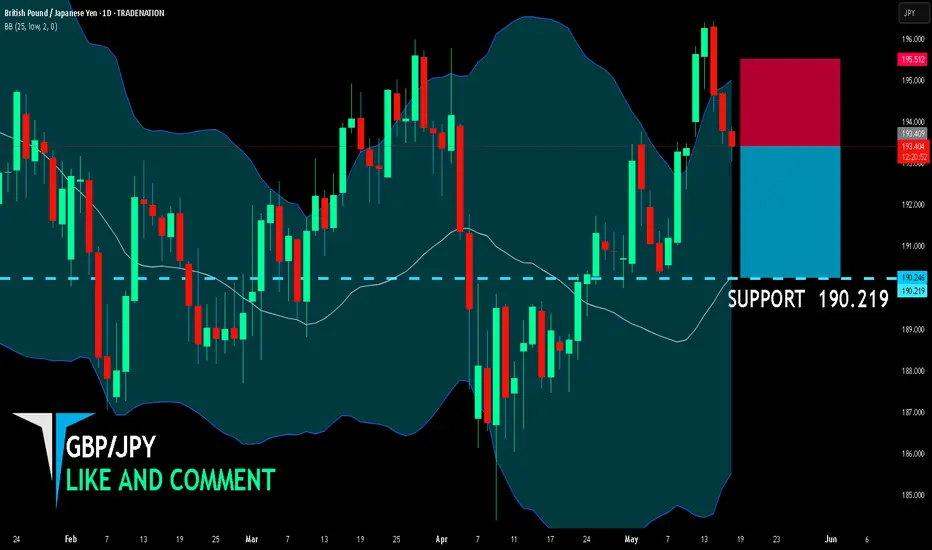
GBP/JPY SELLERS WILL DOMINATE THE MARKET|SHORT
GBP/JPY SIGNAL
Trade Direction: short
Entry Level: 193.409
Target Level: 190.219
Stop Loss: 195.512
RISK PROFILE
Risk level: medium
Suggested risk: 1%
Timeframe: 1D
Disclosure: I am part of Trade Nation's Influencer program and receive a monthly fee for using their TradingView charts in my analysis.
✅LIKE AND COMMENT MY IDEAS✅
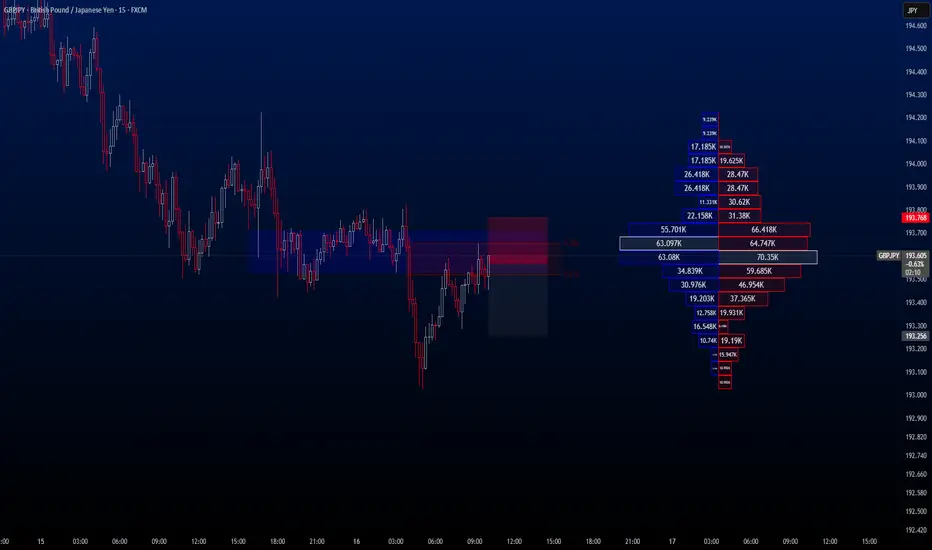
GBPJPY Take Profit Hit!Dear traders, we had a real sniper entry today. As soon as the trade was executed, price began to drop immediately—allowing us to secure profits at both 1:1.5 and 1:2 Risk-to-Reward levels. Clean execution, clean result.
This was my first and last trade of the day.
See you again tomorrow with new opportunities!
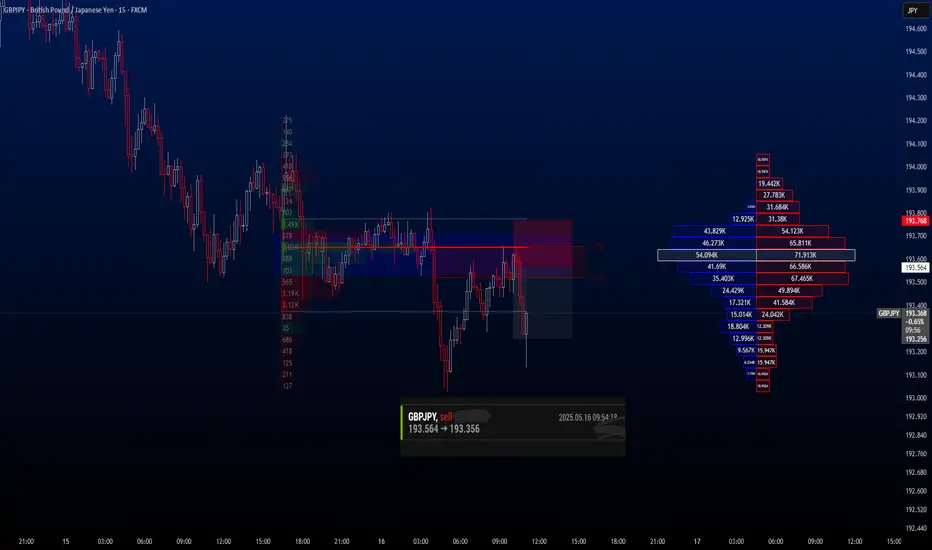
GBPJPYHello Traders,
Today’s first setup comes from GBPJPY. Based on current market conditions, I’ve identified a high-probability sell opportunity. The trade has already been executed on my end, with a Risk-to-Reward Ratio set between 1:1.5 and 1:2, depending on your individual risk appetite.
🔍 Trade Details:
✔️ Timeframe: 15-Minute
✔️ Risk-to-Reward Ratio: 1:1.50 / 1:2
✔️ Trade Direction: Sell
✔️ Entry Price: 193.564
✔️ Take Profit: 193.256
✔️ Stop Loss: 193.768
🔔 Disclaimer: This is not financial advice. I'm simply sharing a trade I’m personally taking, based on my own methodology. It is intended purely for educational purposes.
📌 If you're interested in a more systematic and data-driven approach to trading:
💡 Follow the page and turn on notifications to stay up to date with future trade ideas and market breakdowns.
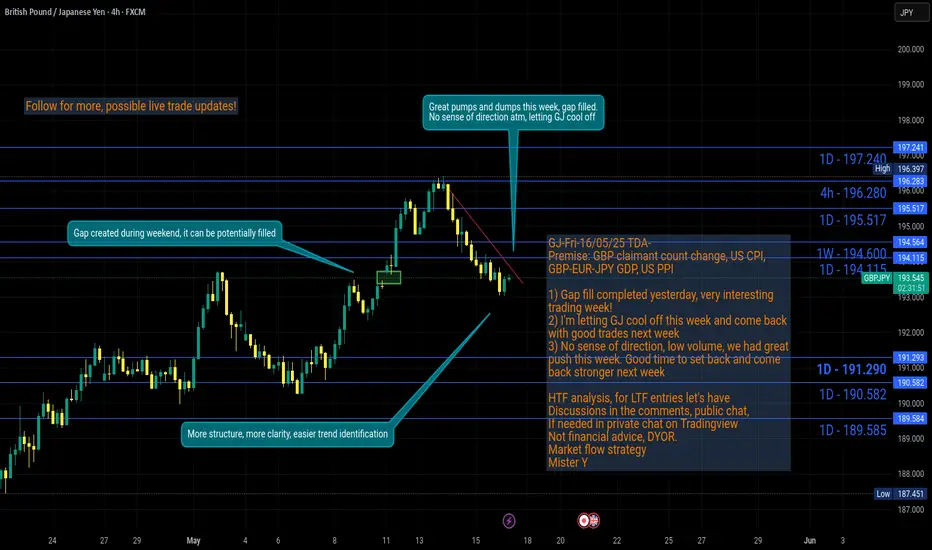
GJ-Fri-16/05/25 TDA-Finally Gap filled completely, interesting!Analysis done directly on the chart
Follow for more, possible live trade updates!
Push, set back, recharge.
Push again, set back, recharge again.
Rinse and repeat.
Not financial advice, DYOR.
Market Flow Strategy
Mister Y