#GBPJPY: 1170+ Massive Sell Opportunity! Get Ready For Big MoveDear Traders,
We have an excellent selling opportunity on GBPJPY, with over 1100+ selling move is likely to occur within next couple of weeks. Please use accurate risk management. For more chart related information read the chart carefully.
Gbpjpyanalysis
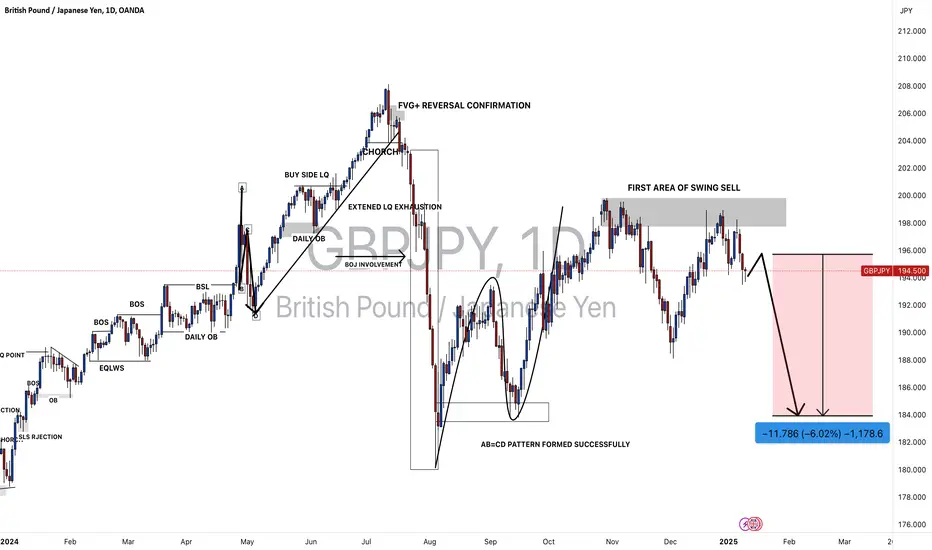
GBPJPY: A Big Swing Sell Worth 1500+ pips! Dear Traders,
We have an excellent selling opportunity on GBPJPY with move worth up to 1500 pips! Good luck and like and comment for more!

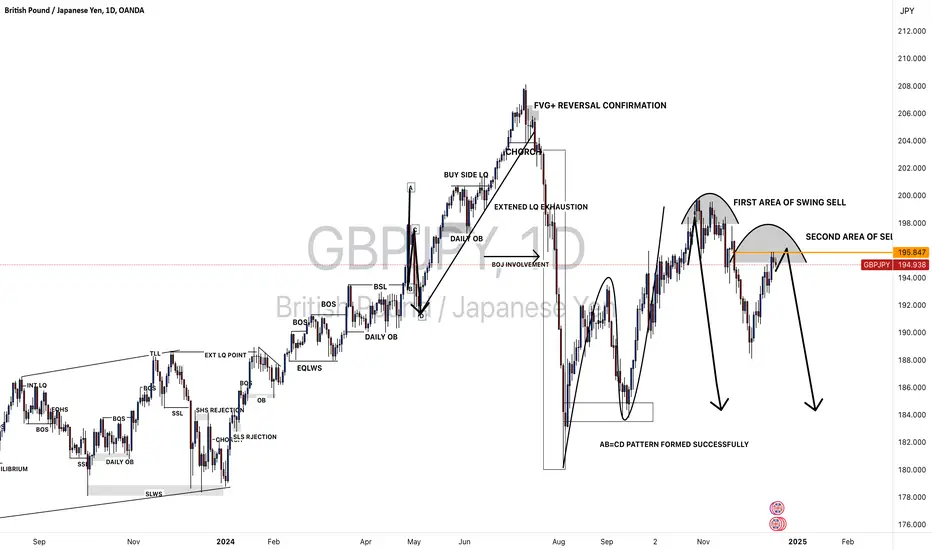
GBPJPY: Price is trading at crucial level, Possible Swing MoveDear Traders,
GBPJPY, price is currently trading at very crucial area from where we can expect price to reverse, currently the price momentum shows a strong bearish presence. This can be a swing sell after looking at the data, price can touch the previous yearly low.
#GBPJPY: Buyers and Sellers Both Has Equal Chances! Hey there! So, GBPJPY is at a pivotal moment, and we might see a mix of buying and selling activity in the market. Since the bulls aren’t exactly sure what to do next, here’s what we think:
- The GBPJPY pair is having a tough time breaking through the 194 region. The Japanese yen (JPY) is holding steady, making it hard to predict what will happen next. This has made trading JPY pairs a real challenge.
- Looking back at how prices have behaved in similar situations can give us some clues about what might happen in the future. But it’s important to do thorough research before we start trading. Just because something happened in the past doesn’t mean it will happen again.
- The Japanese yen (JPY) also tends to go down when the US dollar (USD) goes up. Since we’re bullish on the DXY index in the coming days, we think the JPY will probably take a hit, and it could go down a lot. It’s also worth keeping an eye on the GBP, which has been one of the most popular currencies since the market opened earlier today.
- In the meantime, we suggest setting two take-profit targets: one at 197 and another at 199. These levels are likely to see a lot of selling activity.
Now, let’s talk about what sellers should do:
- The price is currently in favour of sellers since it dropped from 195.50 to 193.50. And since the last two daily candles closed with strong bearish volume, it looks like the price is going to keep going down.
- If the price breaks below 190.50, that would be a great opportunity for sellers to make some money.
Good luck and trade safely!
Thank you for your unwavering support! 😊
If you’d like to contribute, here are a few ways you can help us:
- Like our ideas
- Comment on our ideas
- Share our ideas
Team Setupsfx_
❤️🚀
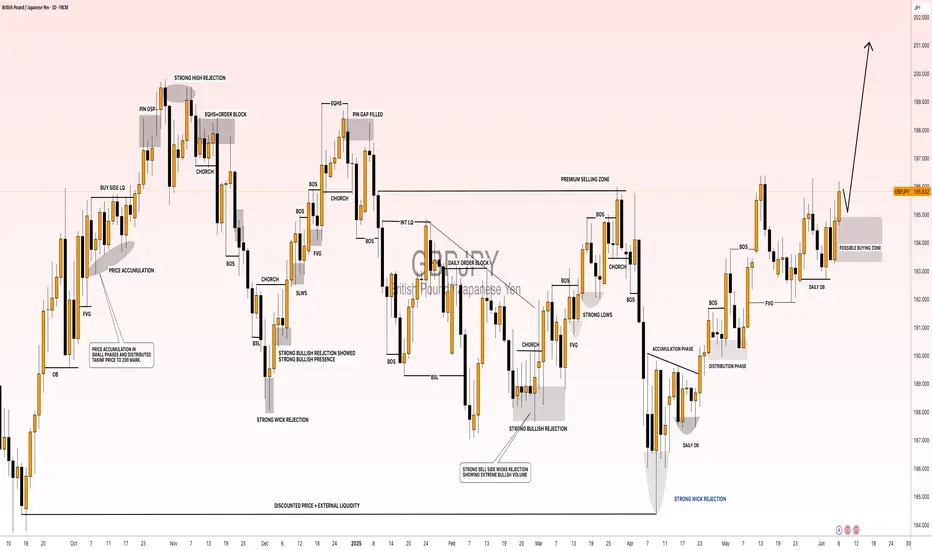
#GBPJPY: 600+ Pips Swing Move, JPY To Drop! GBPJPY has successfully rejected the area previously identified in our analysis of GJ. We had anticipated a price rejection and reversal with a strong bullish impulse, which has materialised. Following the positive candle close on Friday, we anticipate a continuation of the bullish trend and potential reaching of the 200 mark.
When trading, it is crucial to prioritise risk management. Conduct your own analysis and utilise this information solely for educational purposes.
Three potential targets have been identified: 198, 200, and 202. A stop loss can be positioned below our buying zone, as indicated by the black-marked zone.
Your support, expressed through likes, comments, and shares, is greatly appreciated and encourages us to continue providing valuable content.
❤️🚀
Team Setupsfx_
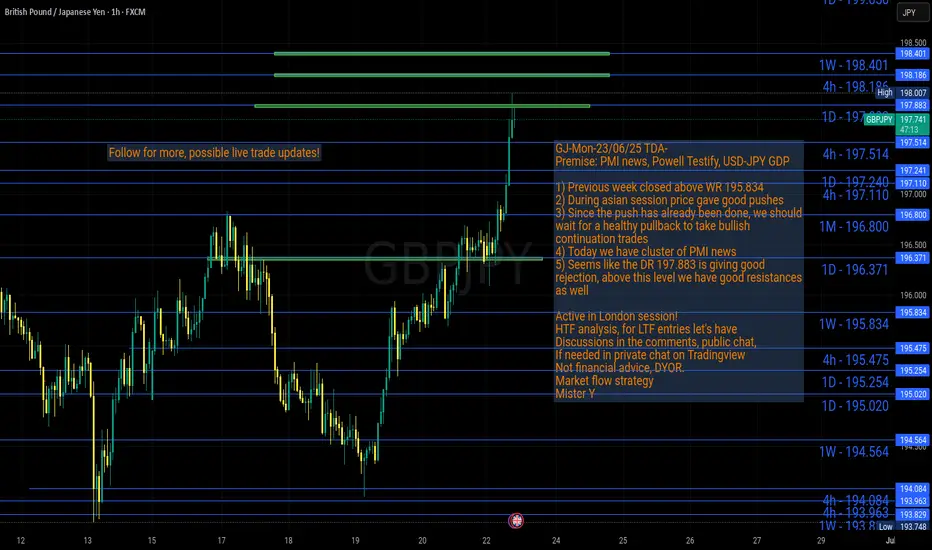
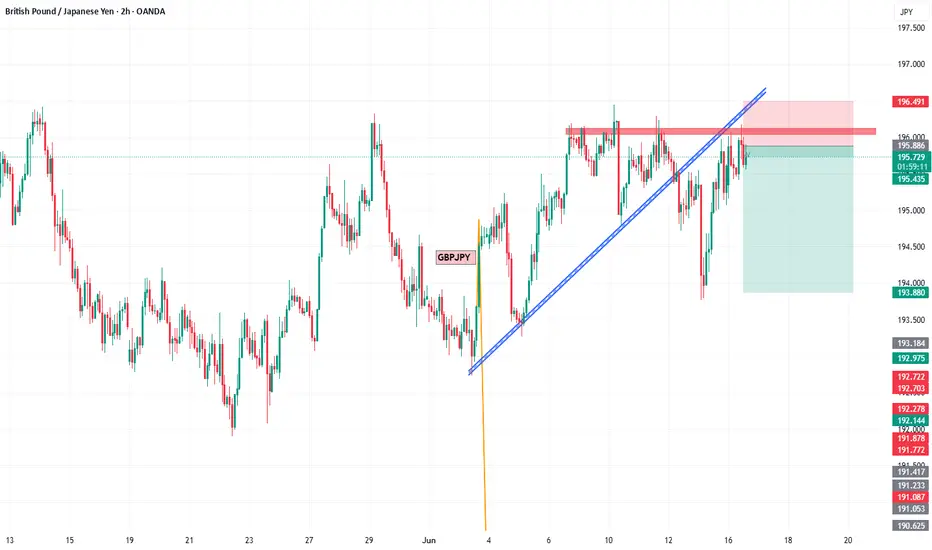
GJ-Mon-23/06/25 TDA-Asian session push, waiting for pullbackAnalysis done directly on the chart
Follow for more, possible live trades update!
Asian session push, if this is not your trading time.
There's nothing you can do to catch good moves,
The best thing we can do now is to wait for healthy
pullback before continuation!
Active in London session!
Not financial advice, DYOR.
Market Flow Strategy
Mister Y
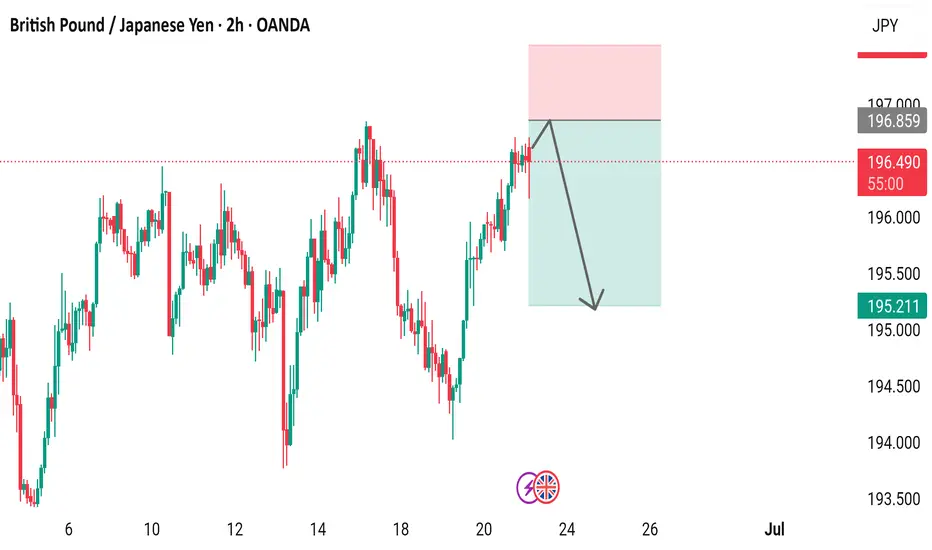
GBP/JPY 2-Hour Chart - OANDA2-hour price movement of the British Pound (GBP) against the Japanese Yen (JPY) from OANDA, showing a current value of 196.248 with a slight decrease of 0.256 (-0.13%). The chart includes candlestick patterns, a highlighted resistance zone (pink), and a support zone (cyan), with key levels marked at 197.016, 196.348, 195.002, and 194.000. The time frame spans from June 6 to July 3, 2025.
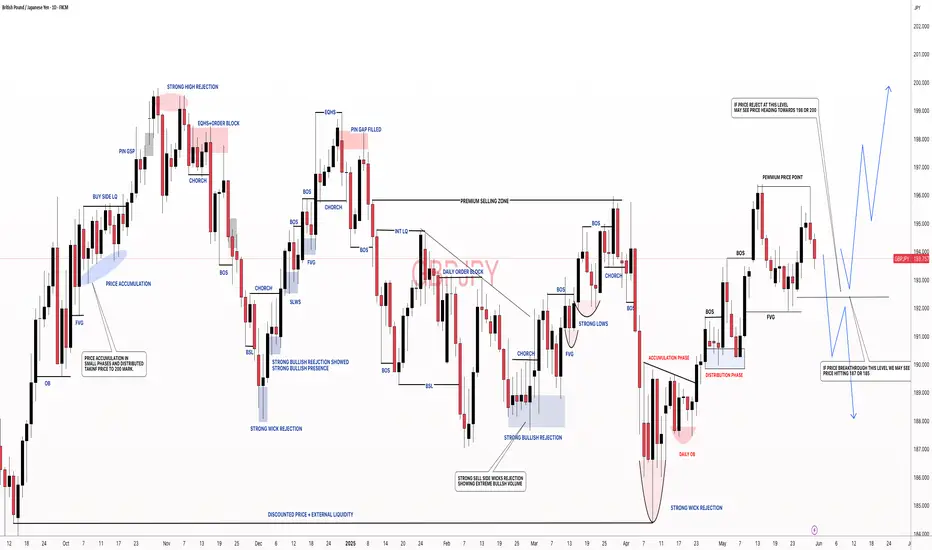
GBPJPY Bullish Move
Monthly Chart
Price respected the Major QP (190.00)
Price also formed a Triple Bottom
The previous monthly candle ended as a bullish engulfing
Short MAs are above Longer MAs and price is above both
Sentiment - Look for buys
Weekly Chart
Price found support at he weekly zone and made a bullish push
Price then sold off (retracement) and respected the 38.2 Fib Level and Minor AQ (192.5) before continuing the bullish trend
The price of the previous candle met resistance at the trend line & sold off but ultimately closed respecting the Minor QP (195.000).
This weeks candle found bullish support and closed bullish engulfing
Sentiment - Look for buys
Daily Chart
Price retraced and found support at the 50.0 Fib Level - confirming bullish trend continuation
Expecting price to continue bullish and test the 0.27 Fib, which also aligns with the Daily Supply Zone & Minor AQ (197.500).
Will look to enter long on lower time frame - 1H/2H
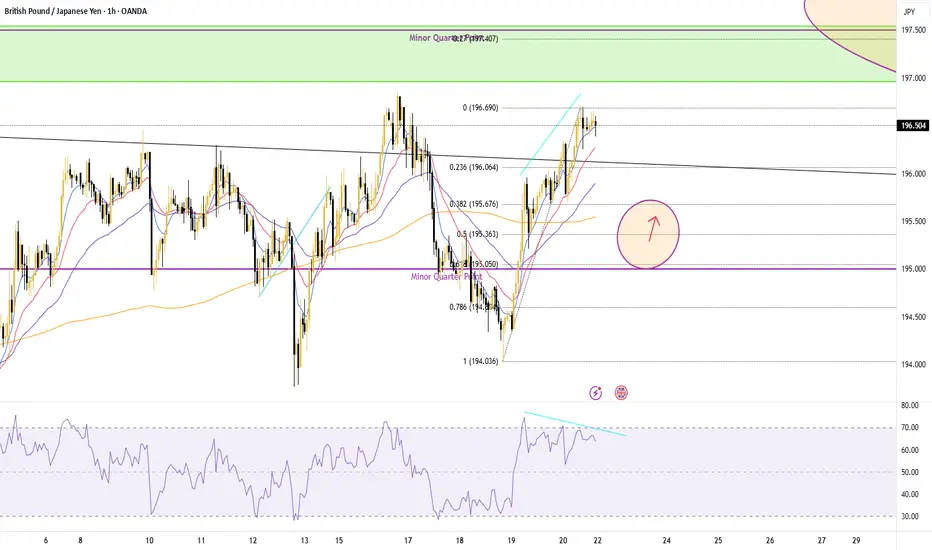
1 Hour Chart
Based on the RSI - a bearish divergence is present signaling some bearish pressure
This algins with the daily TF, as I am looking to enter long after a minor retracement on this timeframe.
Expecting to enter a long position near the 50.0-61.8 Fib area.
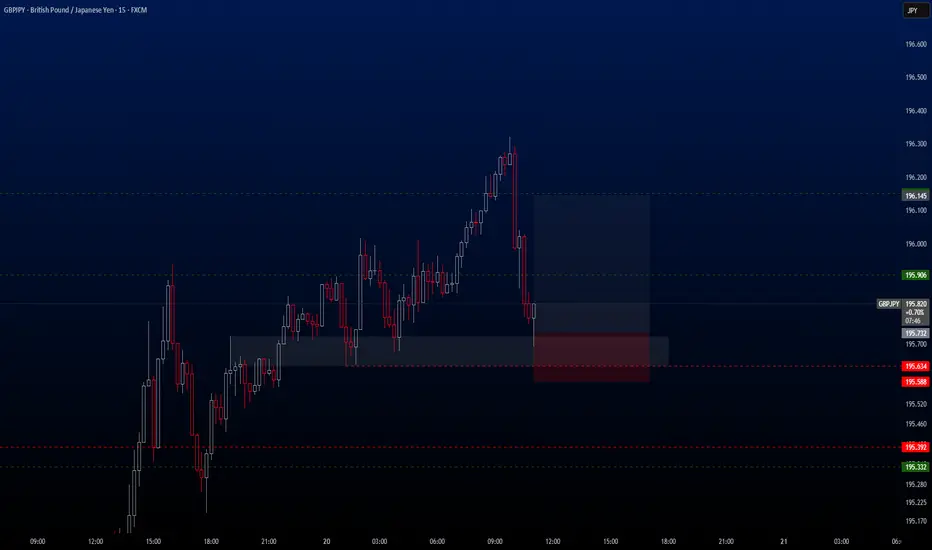
GBPJPY Hello traders. A new buy opportunity has emerged on the GBPJPY pair. As you may have noticed, the pair has been rallying non-stop for the past few days, and even on the M15 and M30 charts, it hasn’t offered many pullback opportunities for entries. But it seems that opportunity is finally here. I’ve activated the trade and wanted to share it with you as well.
🔍 Trade Details
✔️ Timeframe: 15-Minute
✔️ Risk-to-Reward Ratio: 1:2.78
✔️ Trade Direction: Buy
✔️ Entry Price: 195.732
✔️ Take Profit: 196.145
✔️ Stop Loss: 195.588
🔔 Disclaimer: This is not financial advice. I’m simply sharing a trade I’ve taken based on my personal trading system, strictly for educational and illustrative purposes.
📌 Interested in a systematic, data-driven trading approach?
💡 Follow the page and turn on notifications to stay updated on future trade setups and advanced market insights.
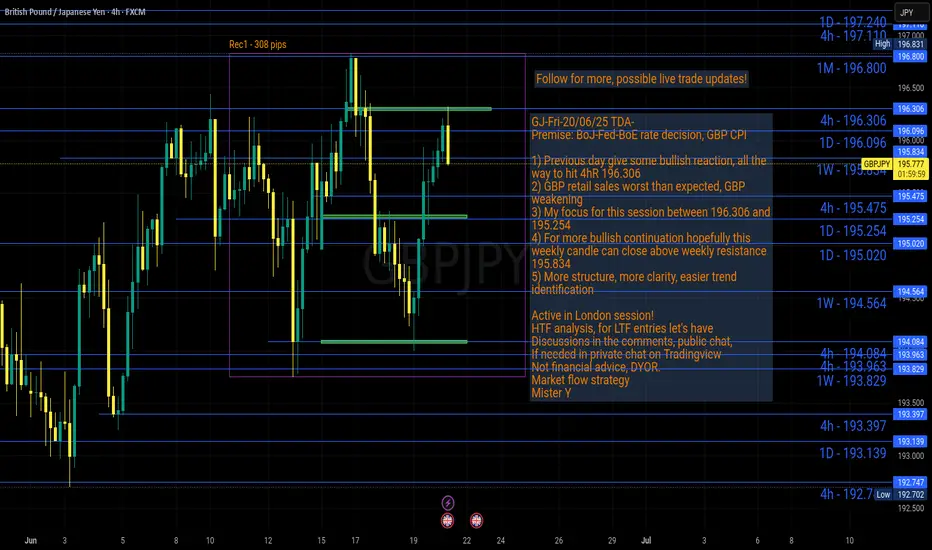
GJ-Fri-20/06/25 TDA-Will weekly candle close above WR 195.834?Analysis done directly on the chart
Follow for more, possible live trades update!
Feedback from you guys:
1) Is daily posting really helpful or better focus on
less posts?
2) Is there any way to improve more the quality
of posts?
Comment down below, really appreciate the responses!
Active in London session!
Not financial advice, DYOR.
Market Flow Strategy
Mister Y
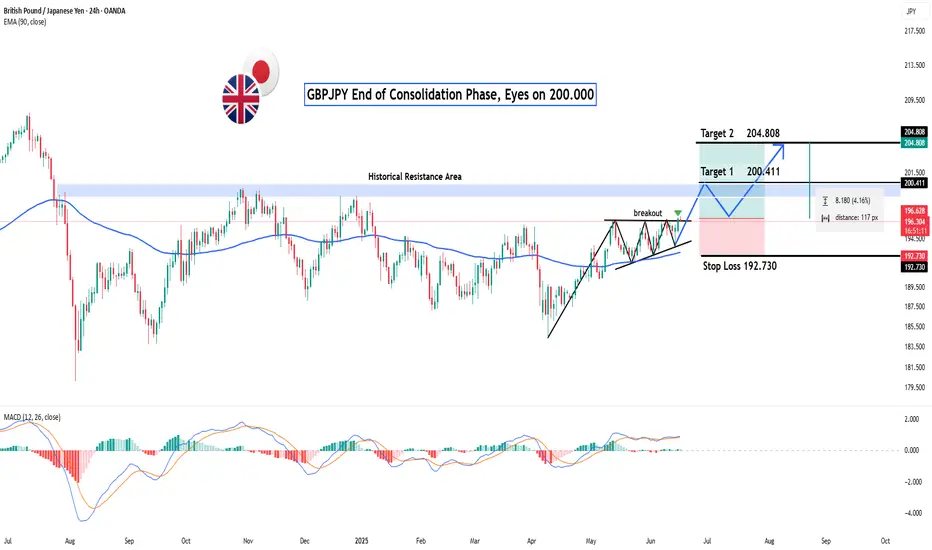
GBPJPY: End of Consolidation Phase, Eyes on 200.000?Hey Realistic Traders!
Could this be the beginning of a major bullish wave ?
Let’s Break It Down..
On the daily timeframe, GBPJPY has formed a Symmetrical Triangle Pattern, followed by a bullish breakout, a classic technical signal that typically marks the end of a consolidation phase and the start of a new bullish trend. This move is further confirmed by the appearance of a strong bullish candlestick, reflecting a surge in buying momentum.
Supporting this bullish scenario, the MACD indicator has also formed a bullish crossover, where the MACD line crosses above the signal line. This crossover is widely regarded as a momentum shift from bearish to bullish, strengthening the case for continued upward movement.
Given these technical signals, the price is likely to advance toward the first target at 200.411, with a potential extension to 204.808.
This bullish outlook remains valid as long as the price holds above the key stop-loss level at 192.730.
Support the channel by engaging with the content, using the rocket button, and sharing your opinions in the comments below.
Disclaimer: "Please note that this analysis is solely for educational purposes and should not be considered a recommendation to take a long or short position on OANDA:GBPJPY ".
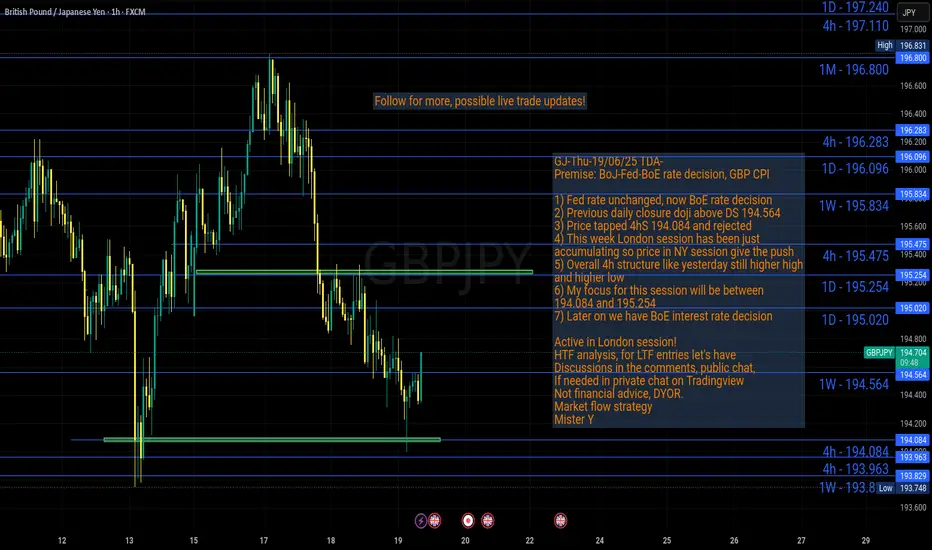
GJ-Thu-19/06/25 TDA-Eyes on BoE interest rate decisionAnalysis done directly on the chart
Follow for more, possible live trades update!
Focus on your trading time. If you have missed
a move but it wasnt in your trading time
then you haven't missed anything.
Active in London session!
Not financial advice, DYOR.
Market Flow Strategy
Mister Y
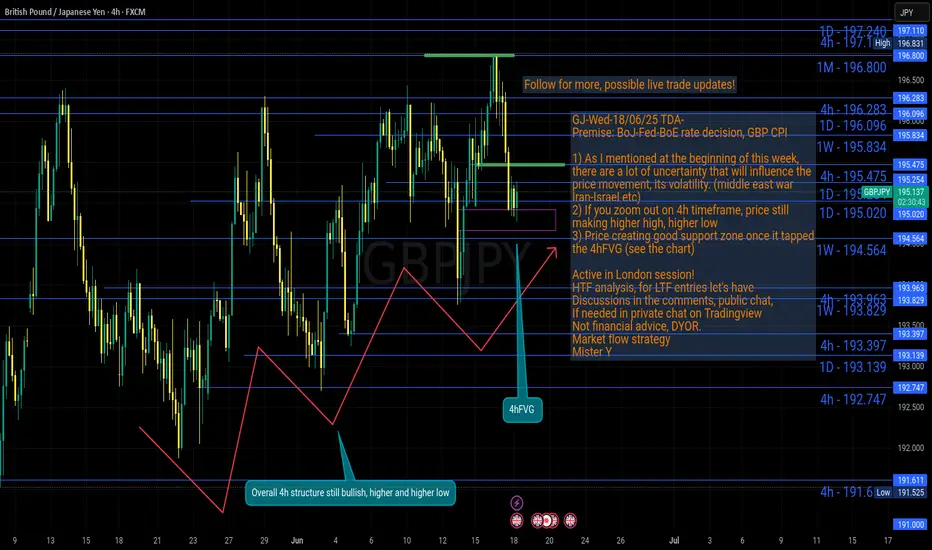
GJ-Wed-18/06/25 TDA-Uncertainty looms, play it safe!Analysis done directly on the chart
Follow for more, possible live trades update!
Today topic: what's something you do outside
of trading that helps you trade?
For me example: I exercise, letting the oxygen
flow through the whole body. If you want to
perform great then not just your mind but also
your body is has to be trained.
Comment down below your opinion!
Active in London session!
Not financial advice, DYOR.
Market Flow Strategy
Mister Y
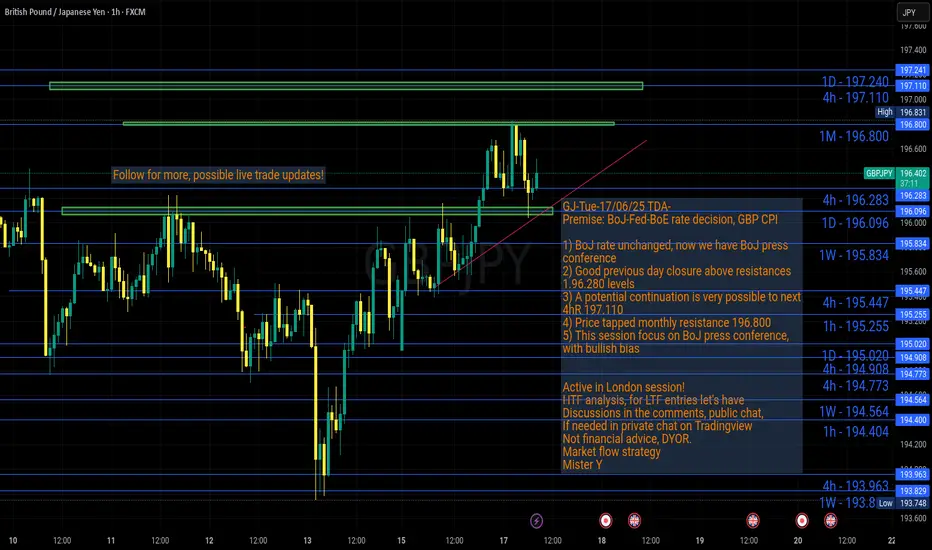
GJ-Tue-17/06/25 TDA-BoJ rate unchaged, press conference now!Analysis done directly on the chart
Follow for more, possible live trades update!
With previous daily closure above good resistances,
and more bullish structure to be created. GJ bullish
continuation is very possible.
Active in London session!
Not financial advice, DYOR.
Market Flow Strategy
Mister Y
GBPJPY Hello traders.
Today's first trade comes from the GBPJPY pair. The trade is currently active on my side, and I’m happy to share it with you as well.
🔍 Trade Details
✔️ Timeframe: 15-Minute
✔️ Risk-to-Reward Ratio: 1:2
✔️ Trade Direction: Buy
✔️ Entry Price: 195.715
✔️ Take Profit: 196.260
✔️ Stop Loss: 195.444
🔔 Disclaimer: This is not financial advice. I’m simply sharing a trade I’ve taken based on my personal trading system, strictly for educational and illustrative purposes.
📌 Interested in a systematic, data-driven trading approach?
💡 Follow the page and turn on notifications to stay updated on future trade setups and advanced market insights.
GBPJPY SELLBy utilizing levels, historical patterns, , we can formulate a hypothesis that the market might follow a similar trajectory if bearish sentiment prevails.
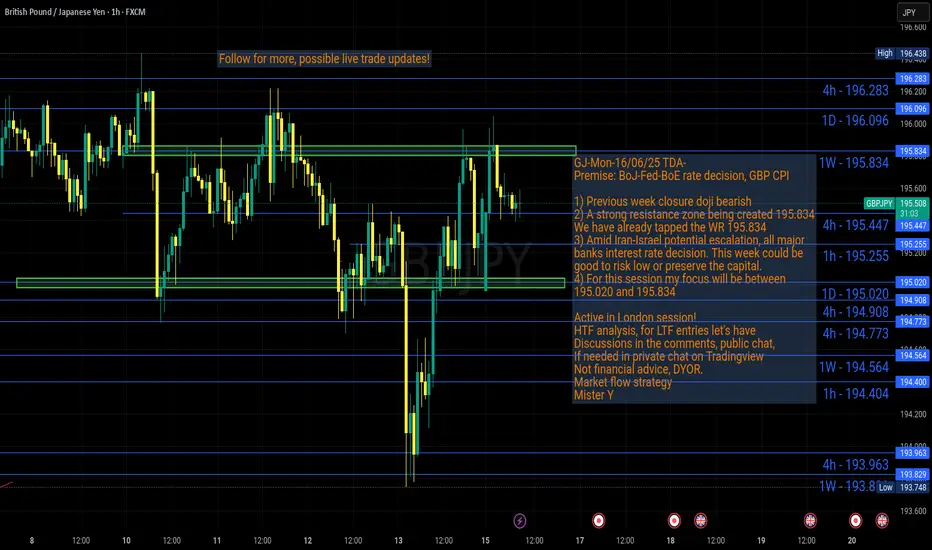
GJ-Mon-16/06/25 TDA-A lot of uncertainty this week, watch out!Analysis done directly on the chart
Follow for more, possible live trades update!
A lot of uncertainty ahead this week:
-BoJ interest rate decision
-GBP CPI
-Fed interest rate decision
-BoE interest rate decision
-Middle east tension between Israel-Iran
Stay up to date to latest global news, check
economic calendar.
Know when to increase your risks and when
to lower your risks (protect and preserve your
capital).
Active in London session!
Not financial advice, DYOR.
Market Flow Strategy
Mister Y
GBPJPY - Look for Long (INTRADAY) 1:4.5 and Short (SWING) 1:XXGBPJPY appears to remain in a distribution phase from the supply zone, making its way toward the next demand zone on the higher time frame. We might see a potential sell opportunity during any consolidation before the price continues trending toward the demand area.
Let’s wait and see how price action develops — there’s a chance for entries in both directions, but only if a clear consolidation forms. Otherwise, it’s best to remain patient and look for setups at the next key resistance level.
Disclaimer:
This is simply my personal technical analysis, and you're free to consider it as a reference or disregard it. No obligation! Emphasizing the importance of proper risk management—it can make a significant difference. Wishing you a successful and happy trading experience!

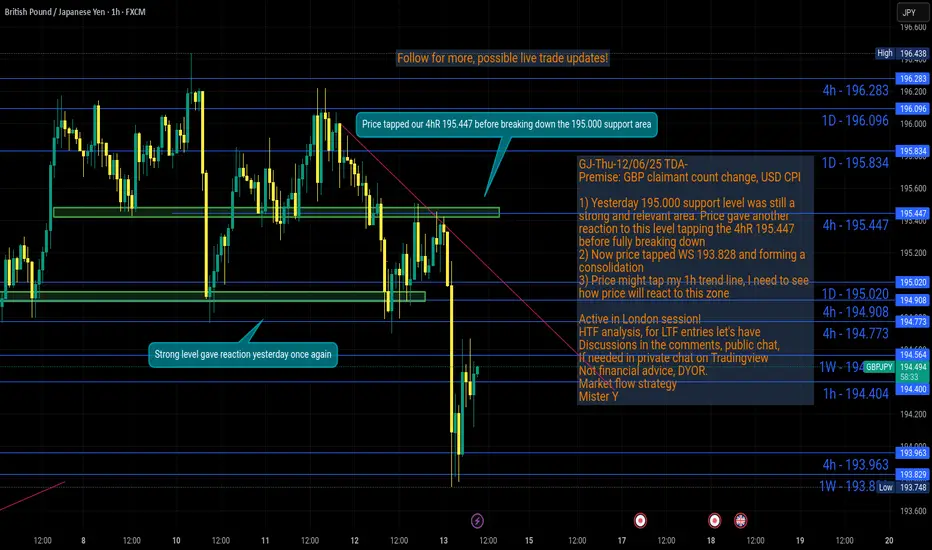
GJ-Thu-12/06/25 TDA-GJ breaking 195.000 support levelAnalysis done directly on the chart
Follow for more, possible live trades update!
No strategy has 100% win rate, this is when
risk management comes in handy.
We are humans, we all make humans errors
if you are manual trading and executing the
trades.
Active in London session!
Not financial advice, DYOR.
Market Flow Strategy
Mister Y
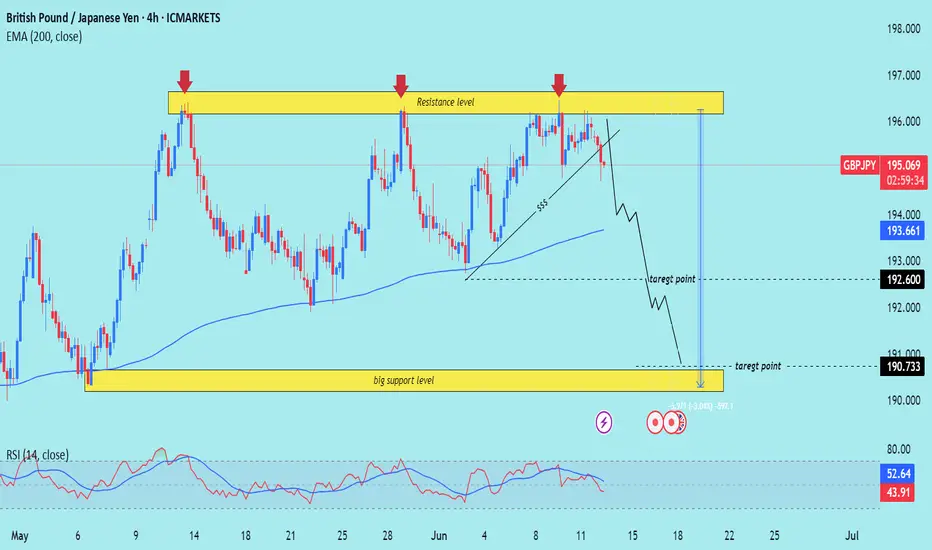
GBP/JPY) Bearish analysis Read The captionSMC trading point update
Technical analysis of GBP/JPY (British Pound / Japanese Yen) based on multiple Technical signals on the 4-hour timeframe. Let's break it down in detail:
---
Overall Analysis Summary
Direction Bias: Bearish
Timeframe: 4H
Price (at analysis time): 195.033
Tool Used: EMA 200, RSI, Support/Resistance, Chart Pattern
---
Technical Components
1. Strong Resistance Zone (~195.800 - 196.200)
Marked by 3 red arrows.
Price has rejected this level multiple times, forming a Triple Top pattern.
Suggests strong selling pressure and low probability of price breaking higher in the short term.
2. Trendline Break (Structure Shift)
Ascending support trendline (marked with "$$$") is broken.
This is a key market structure break, indicating the bullish momentum is weakening or reversing.
3. EMA 200 (193.661)
Price is currently just above the 200 EMA.
A clean break and close below the EMA would confirm trend reversal.
EMA often acts as dynamic support/resistance.
---
Target Zones
Two downside targets are indicated:
Target 1: 192.600
Minor support level, could be the first stop for bearish pressure.
Target 2: 190.733
Strong historical support zone (yellow box labeled big support level).
Also aligns with measured move from the top of the range to the base (height of the range).
---
RSI (Relative Strength Index)
RSI (14): ~43.40
Neutral zone (not oversold yet), meaning there’s room for more downside before oversold conditions are hit.
---
Trading Psychology & Risk Management
This setup assumes:
Sellers continue to defend the resistance zone.
Break of structure (trendline + EMA) confirms shift.
Traders may consider short entries below 194.800–195.000 with stops above 196.200.
---
Trade Idea (Based on This Chart)
Entry: Below 194.800 (after break confirmation)
Stop-Loss: Above 196.200
Take-Profit 1: 192.600
Take-Profit 2: 190.733
Risk-Reward: Favorable (~1:2+)
Mr SMC Trading point
---
Caution
If price reclaims 196.200 and closes above the resistance, bearish setup is invalidated.
Watch for fakeouts near EMA.
plesse support boost 🚀 this analysis)
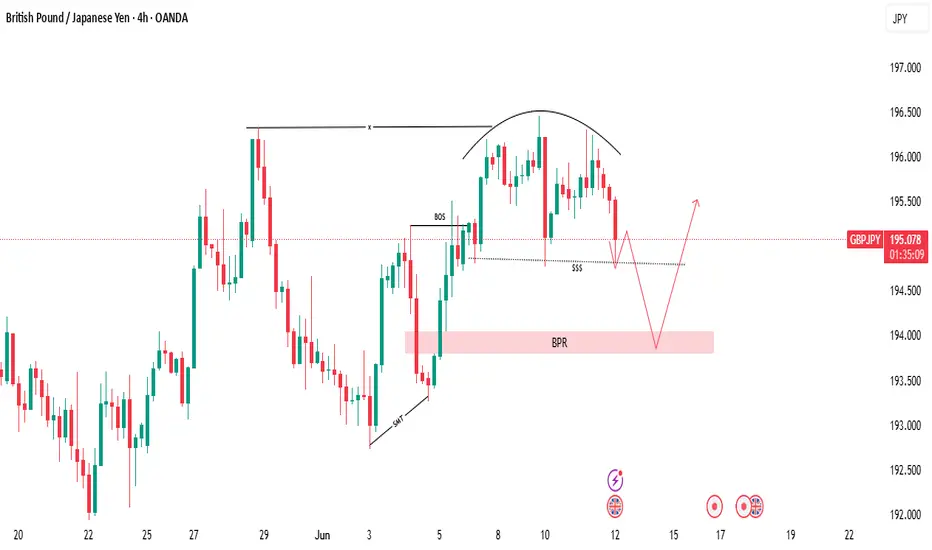
Why? Because liquidity is building at this support zone.🚨 GBP/JPY Traders — Don’t Get Trapped! 🚨
GBP/JPY has just touched a major support level, and on the surface, it looks like a golden buying opportunity. But here’s the catch: this is exactly where most retail traders get trapped.
Why? Because liquidity is building at this support zone. Smart money knows retail traders have stop losses and pending orders sitting right below — and they’re coming for it. 🧠💰
Here’s what the market is likely to do next:
📈 Step 1: A small bullish bounce to lure retail traders in. Everyone starts thinking, “This is the reversal!”
🔄 Step 2: Boom — a sharp move down. Stop hunts. Fakeouts. Panic sells. The market dips below support, grabbing liquidity.
🚀 Step 3: Once liquidity is swept and BPR (Break Point Range) is hit, then the real move begins.
This is a classic setup — trap retail, feed institutional orders, and then drive the market in the true direction.
⚠️ Don’t fall for the bait. Stay patient. Let the trap spring before you strike.
📊 Watch structure. Watch liquidity. Watch price behavior. That’s where the edge is.
DYOR — Do Your Own Research. This isn’t financial advice — it’s a trader’s insight.
Trade smart. Trade sharp. 💼🔥
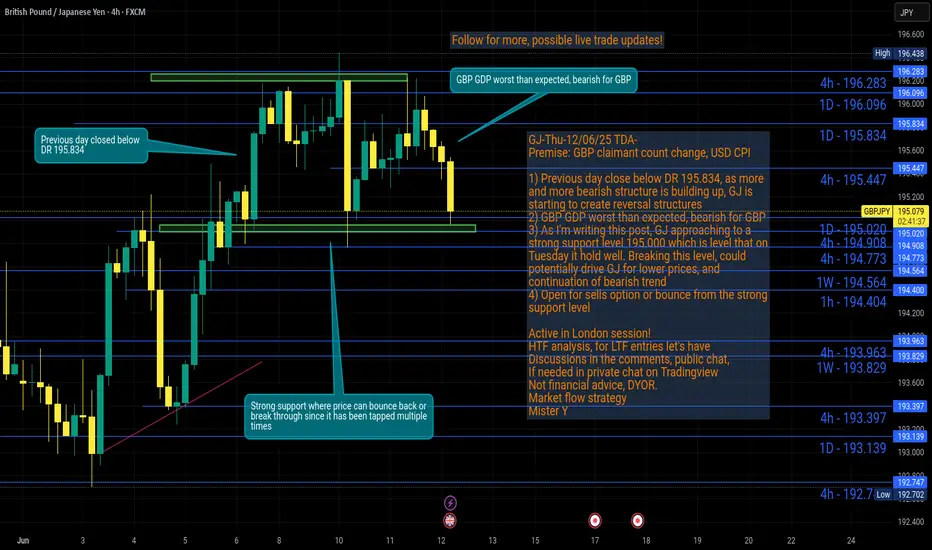
GJ-Thu-12/06/25 TDA-Bearish structure building up, will go down?Analysis done directly on the chart
Follow for more, possible live trades update!
If 195.000 support zone breaks, we can definitely
see GJ pushing lower and continue its bearish
momentum especially after GBP GDP worst than
expected which is bearish for GBP.
Active in London session!
Not financial advice, DYOR.
Market Flow Strategy
Mister Y