GBPJPY LONG/BUYBy utilizing Fibonacci retracement levels, historical patterns, , we can formulate a hypothesis that the market might follow a similar trajectory if bullish sentiment prevails.
Gbpjpyforecast
GBPJPY bullish reversal in play. Long from support!Hey traders,
GBPJPY has hit a key support zone, and I’m anticipating a strong bounce from this level. A powerful bullish engulfing candle has just formed on the 4-hour timeframe, swallowing the last three candles—a clear sign of buying pressure!
💡 Trading Idea:
🔹 Entry: Long from 192.90
🔹 Target 1: 193.935
🔹 Target 2: 195.959 (Major resistance)
🔹 Stop Loss: 191.998 (In case support fails)
⚠️ Remember to stick to your trading plan and manage your risk accordingly. This setup presents a great opportunity, but always trade responsibly!
🔥 If you find this idea useful, give it a boost—your support is greatly appreciated! 🚀

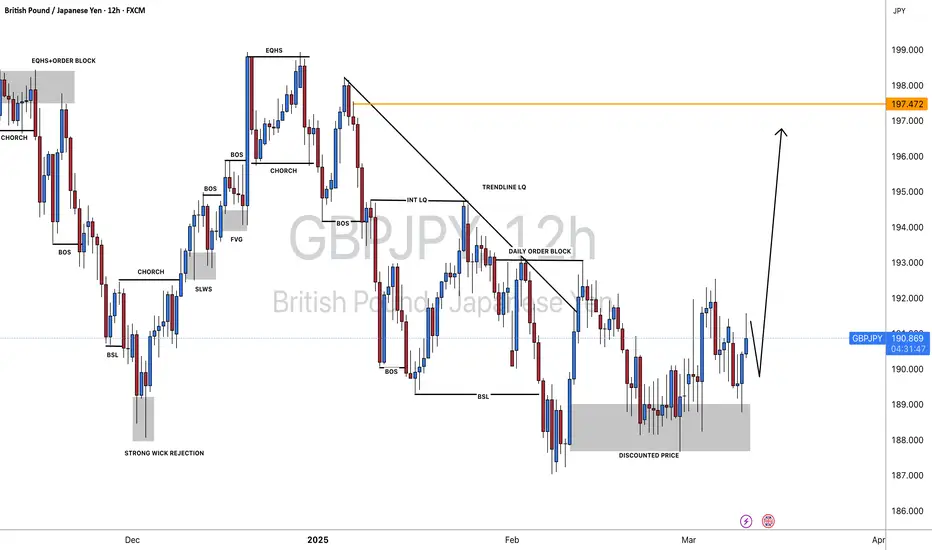
#GBPJPY: +250 Pips From Last Idea Expecting A Strong Bulls! The GBPJPY currency pair experienced a decline to the 190 area, which represents a discounted price range. Subsequently, the price reversed positively by approximately 250 pips. Our market analysis remains unchanged, and we anticipate that the price will continue to exert dominance.
It is possible that the price may experience a correction or a downward movement, as we anticipate the release of strong economic data this week. This data is likely to influence the future trajectory of the currency pair.
We encourage you to like and comment for further insights. Your support has been invaluable throughout our journey, and we sincerely hope that you achieve success in your own market endeavours.
Team Setupsfx_
❤️🚀

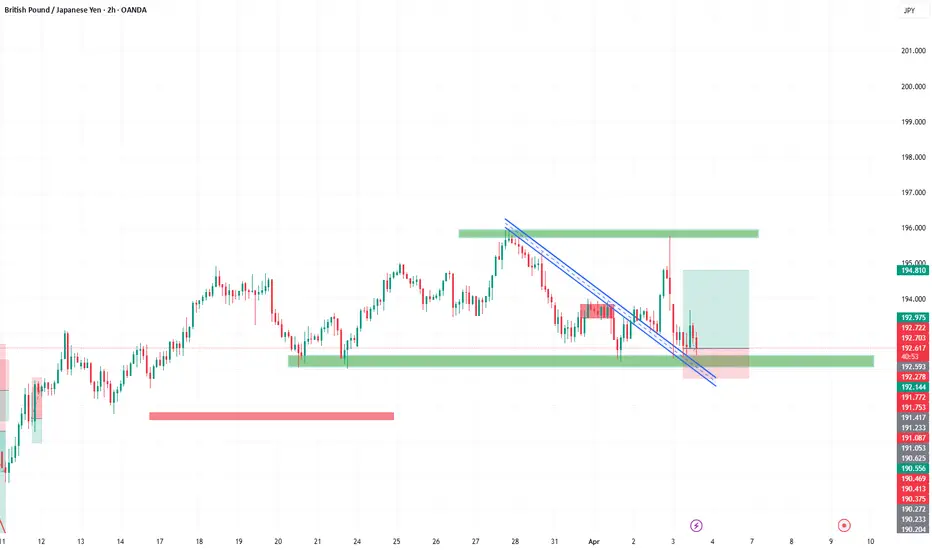
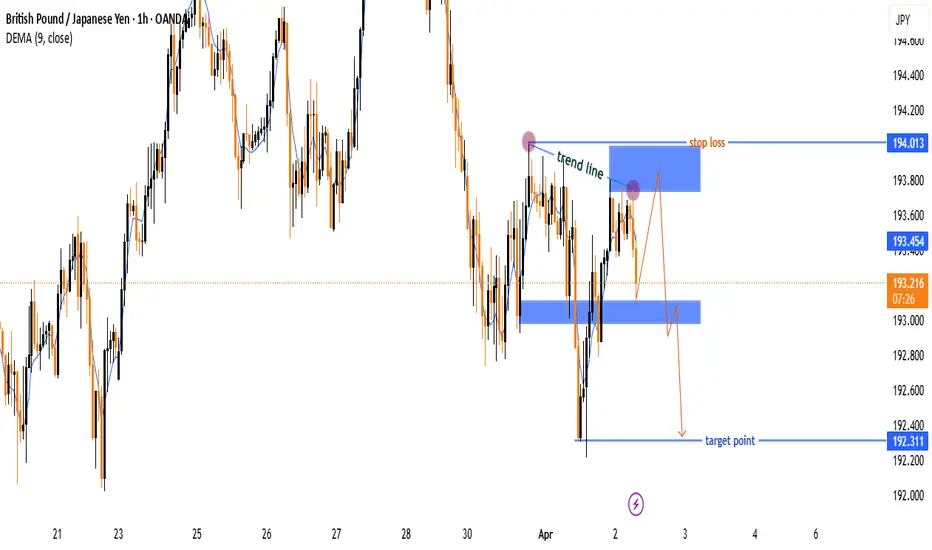
GBP/JPY Bearish Rejection – Short Trade Setup!🔹 Trendline Rejection ❌📈
Price tested the descending trendline and got rejected.
Bearish pressure increasing! 🚨
🔹 Resistance Zone (📍193.6 - 194.0) 🔵
Strong selling zone 📉
Stop Loss placed at 194.013 🚫
🔹 Support Zone (📍193.0) 🟦
Price might bounce here temporarily 🤔
If it breaks below, expect further drop 🚀📉
🔹 Target Level (📍192.311) 🎯
Bearish Target ✅
Ideal Take Profit 🏆
Trade Setup 💼
🔸 Entry: 📍193.5 - 193.6 📉
🔸 Stop Loss: ❌ 194.0 🚫
🔸 Take Profit: ✅ 192.3 🎯
Final Verdict: Sell Setup Active! 📉🔥
Watch for confirmation before entering! 👀🚀
GBPJPY Under Pressure: Potential Sell Opportunity.The GBPJPY pair has recently broken structure to the downside on the 4-hour timeframe, signaling bearish momentum. The pair is currently under significant selling pressure, with price action suggesting a potential continuation of the downtrend. Here's a deeper analysis of the situation:
Market Structure: The recent break of structure to the downside indicates that sellers are in control. The pair has failed to reclaim previous highs, reinforcing the bearish sentiment.
Key Levels:
Range High: The stop-loss level should be placed above the recent range high to manage risk effectively. This level acts as a key invalidation point for the bearish setup. 🚫
Range Low: The target is the previous range low, which aligns with a strong support zone. This level could act as a magnet for price, given the current bearish momentum. 🎯
Bearish Pressure: The pair is trading below key moving averages (e.g., 50 EMA and 200 EMA on the 4-hour chart), further confirming the bearish bias. Additionally, momentum indicators like RSI and MACD may show bearish divergence or oversold conditions, which could provide further confluence for the trade idea. 📊
Risk Management: As always, proper risk management is crucial. Ensure that the position size aligns with your trading plan, and avoid over-leveraging. 🔒
Fundamental Context: Keep an eye on any GBP or JPY-related news that could impact the pair, such as central bank decisions, economic data releases, or geopolitical developments. These factors could either accelerate or invalidate the current technical setup. 📰
Disclaimer ⚠️
This analysis is for educational and informational purposes only and does not constitute financial advice. Trading involves significant risk, and you should only trade with capital you can afford to lose. Always conduct your own research and consult with a financial professional before making any trading decisions. 📢

GBPJPY: Change in price behaviour, we may see possible upside! Dear Traders,
hope you are doing well, we have an excellent buying opportunity on gbpjpy where we can see price going up around 197 region where we can price see strong sell presence. Good luck and trade safe!

#GBPJPY: 681+ Pips Buying Chance from a Key Level. Dear Traders,
Since the Japanese Yen (JPY) experienced a significant decline in the market, prices have risen. This analysis examines two key areas: the complex bullish price behaviour and the rejection of prices at levels we are currently monitoring for potential entry. While this chart analysis serves as a secondary reference, it should complement your own trading strategies.
Best regards,
Team Setupsfx_

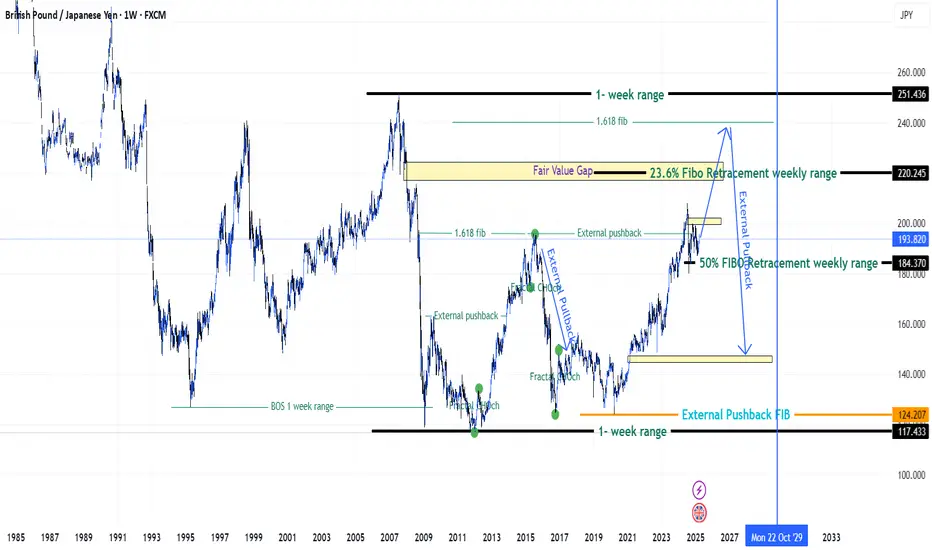
My Directional Bias on GBPJPY for the long run {29/03/2025}Educational Analysis says that GBPJPY may give countertrend opportunities from this range, according to my technical analysis.
Broker - FXCM
So, my analysis is based on a top-down approach from weekly to trend range to internal trend range.
So my analysis comprises of two structures: 1) Break of structure on weekly range and 2) External pushback to fill the remaining fair value gap
1) Break of structure on weekly range is down trend for the long run period of 10 years, may be it switch to new character or change its direction to bullish.
2) External pushback structure is the trading range where it trades on the smaller time frame,
On this structure range market on inside trading or smaller time frame is bullish towards fib of 1.618 and make turn to fill the fair value gaps of it.
Let's see what this pair brings to the table for us in the future.
Please check the comment section to see how this turned out.
DISCLAIMER:-
This is not an entry signal. THIS IS ONLY EDUCATIONAL PURPOSE ANALYSIS.
I have no concerns with your profit and loss from this analysis.
I HAVE NO CONCERNS WITH YOUR PROFIT OR LOSS,
Happy Trading, Fx Dollars.
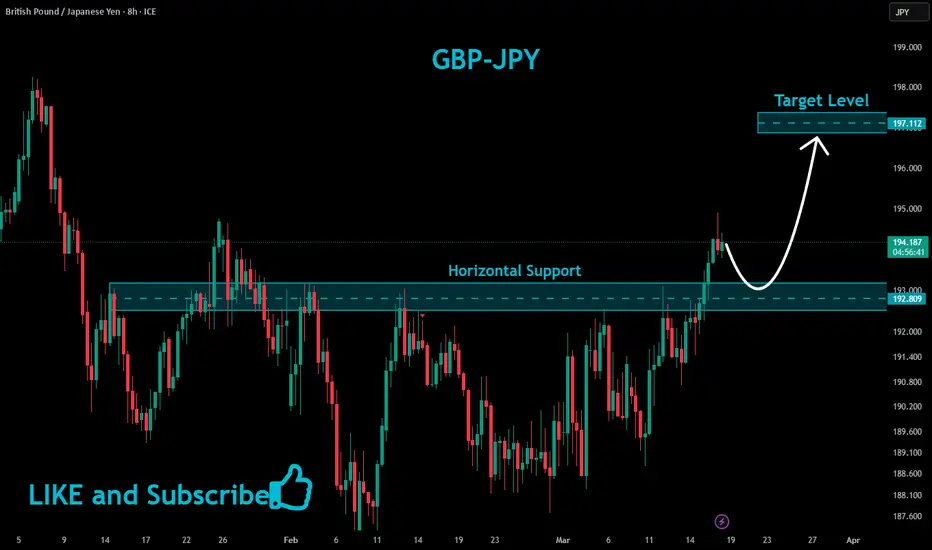
GBPJPY Bullish Bias!
HI,Traders !
GBPJPY is trading in an
Uptrend and the pair
Is making a local correction
But will soon hit a horizontal
Support of 192.809 from where
We will be expecting a local
Bullish rebound !
Comment and subscribe to help us grow !
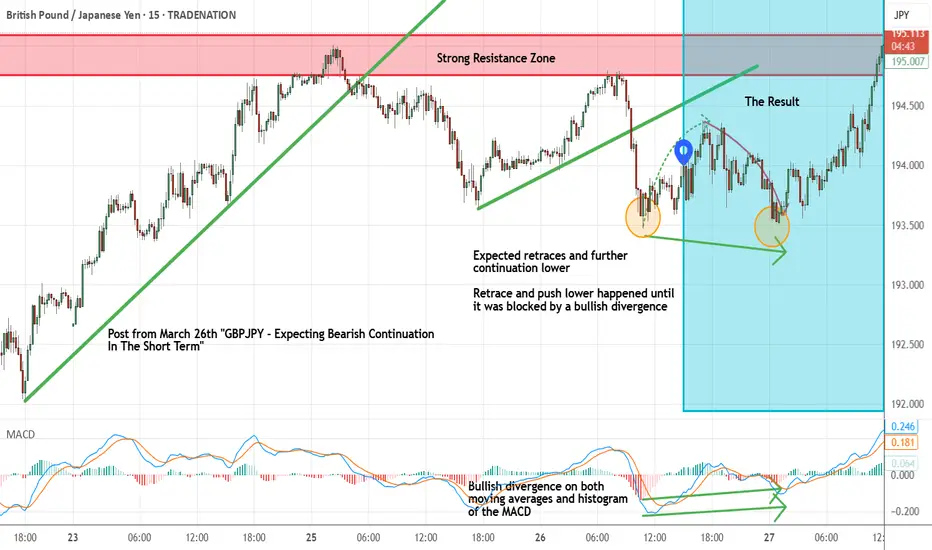
GBPJPY - Short Term Sell Idea Update!!!Hi Traders, on March 26th I shared this idea "GBPJPY - Expecting Bearish Continuation In The Short Term"
We expected to see retraces and further continuation lower. You can read the full post using the link above.
Retrace and push lower happened until it was blocked by a bullish divergence.
If you enjoy this idea, don’t forget to LIKE 👍, FOLLOW ✅, SHARE 🙌, and COMMENT ✍! Drop your thoughts and charts below to keep the discussion going. Your support helps keep this content free and reach more people! 🚀
-------------------------------------------------------------------------------------------------------------------
Disclosure: I am part of Trade Nation's Influencer program and receive a monthly fee for using their TradingView charts in my analysis.
GBP/JPY: Fibonacci Levels Signal Possible Bullish ContinuationTechnical Analysis: GBP/JPY Bullish Continuation 📈
The GBP/JPY chart provided highlights a bullish trend continuation setup, supported by Fibonacci retracement levels. Here's a detailed breakdown:
📊 Fibonacci Levels in Play
The swing low to swing high has been plotted, revealing key retracement levels.
The price is currently near the 50% retracement level (194.326), a critical support zone in bullish trends.
The 61.8% retracement level (194.165), often called the "golden ratio," serves as a stronger support below this.
📈 Bullish Bias
The overall trend remains bullish, with higher highs and higher lows visible on the chart.
The corrective pullback to Fibonacci levels suggests a potential continuation of the upward momentum.
🎯 Target Projection
The arrow on the chart points to a projected move toward the 195.683 level, aligning with the -50% Fibonacci extension.
This target aligns with the bullish trend and indicates a potential breakout above the recent high.
🔍 Confluence and Confirmation
The price action shows signs of rejection at the 50% retracement level, indicating buyer interest.
A bullish candlestick pattern or increased volume near this zone would further confirm the upward move.
⚠️ Risk Management
The 61.8% level (194.165) is a key invalidation point. A break below this level could signal a deeper retracement toward the 78.6% level (193.937) or even the swing low.
This analysis is for informational purposes only and does not constitute financial advice. Trading involves significant risk, and you should only trade with capital you can afford to lose. Always conduct your own research and consult with a financial advisor before making trading decisions.

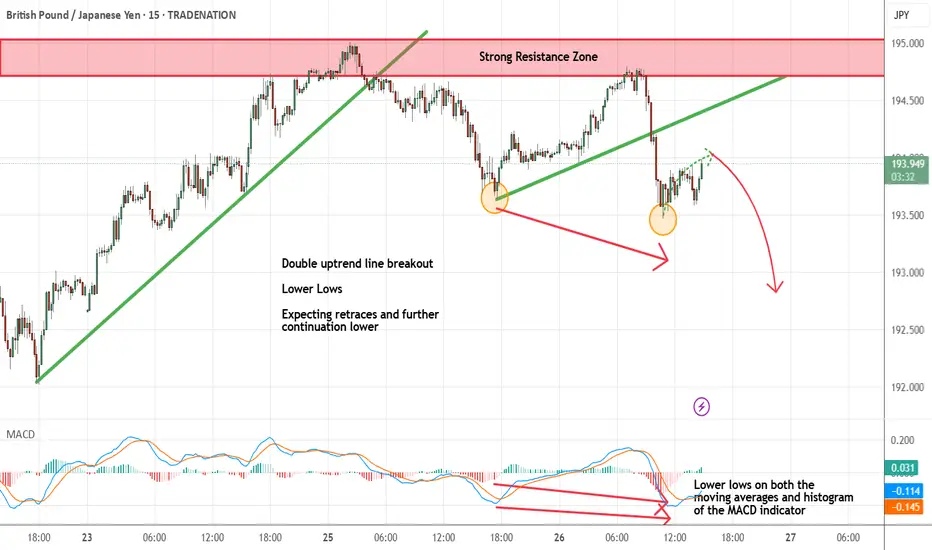
GBPJPY - Expecting Bearish Continuation In The Short TermM15 - Double uptrend line breakout
Lower Lows
Strong bearish momentum
Potential drop after retraces if the strong resistance zone will not be broken.
If you enjoy this idea, don’t forget to LIKE 👍, FOLLOW ✅, SHARE 🙌, and COMMENT ✍! Drop your thoughts and charts below to keep the discussion going. Your support helps keep this content free and reach more people! 🚀
-------------------------------------------------------------------------------------------------------------------
Disclosure: I am part of Trade Nation's Influencer program and receive a monthly fee for using their TradingView charts in my analysis.
GBPJPY: Are Bulls Ready To Rally?GJ is still in an uptrend so I am buying. My entry was 193.825
Bullish Confirmations
- M15 and M30 Bullish CHoCH
- M15 Bullish breaker blocks
- Formed new HH and HL
- Bullish FVGs
🟢BUY GJ
SL 43 pips
TP1 20 pips
TP2 50 pips
TP3 100 pips

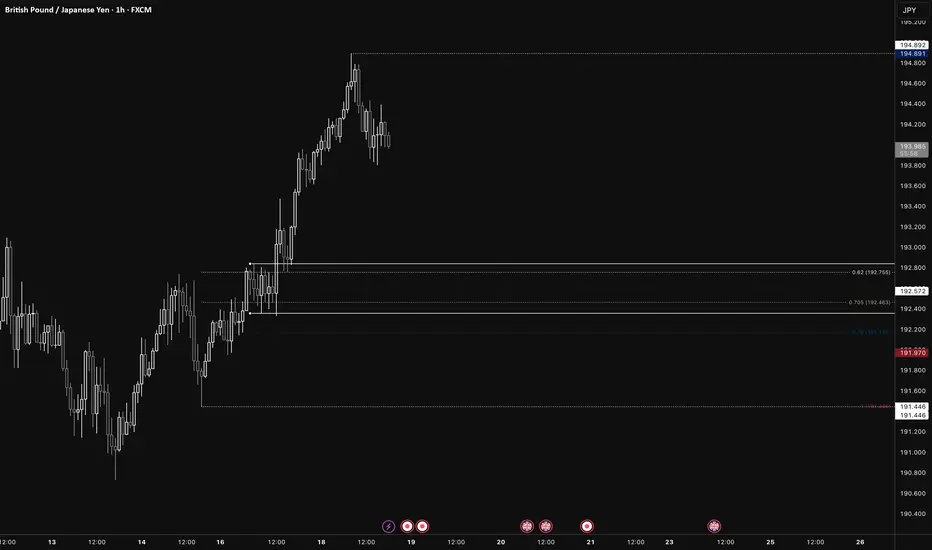
GBP/JPY (Long)Daily:
Price > 200EMA
Swing Period 10
Swing Low: 187.666
Swing Low: 194.892
Volume Imbalance: 2 Candles
Daily Order Block: 197.399 / 195.104
H4:
Price < 200EMA
Swing Period: 7
Swing High: 194.892
Swing Low: 190.728
Volume Imbalance: 2 Candles
H4 Order Block: 192.357 / 192.841
H1:
Swing Period: 5
Swing High: 194.892
Swing Low: 191.446
Volume Imbalance: 11 Candles
H1 Order Block: 192.357 / 192.841
Model 1:
Entry Price: 192.572
Stop Loss: 191.970
TP1: 191.970 @ 1:1 / 50%
TP2: 193.775 @ 1:2 / 25%
SL: Breakeven
TP3: 194.891 @ 1:3 / 25%
Model 2:
Entry Price: 192.750 - 192.159
Entry Trigger: 9EMA X 21EMA
SL: Above recent swing low
TP1: 1:2
SL: Trailing 9EMA
gbpjpy sell signal. Don't forget about stop-loss.
Write in the comments all your questions and instruments analysis of which you want to see.
Friends, push the like button, write a comment, and share with your mates - that would be the best THANK YOU.
P.S. I personally will open entry if the price will show it according to my strategy.
Always make your analysis before a trade

GBPJPY: +1200 Pips Swing Move in Making! Our last update on GBPJPY we had explained that price will bounce from the area that we had identified. We still think price will bounce again as price currently gathering enough volume before it makes any move.
Like and comment
❤️
GBPJPY - MASSIVE Swing Potential Buy - Happening Now (March)This is a longer term swing idea.
Top down analysis from HTF indicates that:
- Push lower on JPYX Yen index
- Retrace higher on XXXJPY pairs
- Divergence in the Yen pairs, confirming a low
- Price Action has created a lot of liquidity on the downside, which has been taken, signifying upside.
Comment below if you have questions. Happy to help.
Peaceful Trading to you all.

GBPJPY Bulls Are Back In TownAs explained in the video, we have several bullish confirmations...
Key Sup 190.3
Key Res 193
- Bullish CHoCH
- Formed a new HH and HL
- H4 TL break and retest
- Retest of bullish OB
- Multiple bullish FVGs
- Bullish MACD
I have a small position open...
🟢BUY GJ 192.315
SL 191.6
TP1 192.515
TP2 192.815
TP3 193.315
TP4 194.315
Will scale in another position if we get a break and close above 193.

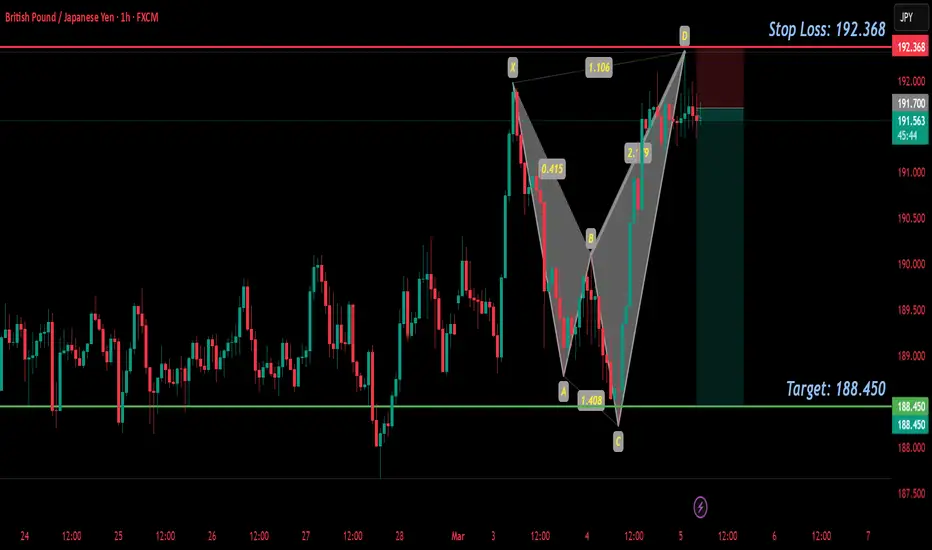
GBP/JPY SELL IDEA (R:R=4.8)I just placed a sell order for GBP/JPY at 191.700. We have a wonderful X BAT that just formed on the 1 HOUR chart.
Please trade with proper risk management, since we have news announcements coming out at 8:15 AM EST today.
ADP Non-Farm Employment Change
Stop Loss: 192.368 (Daily High)
Take Profit: 188.450
Happy Trading!
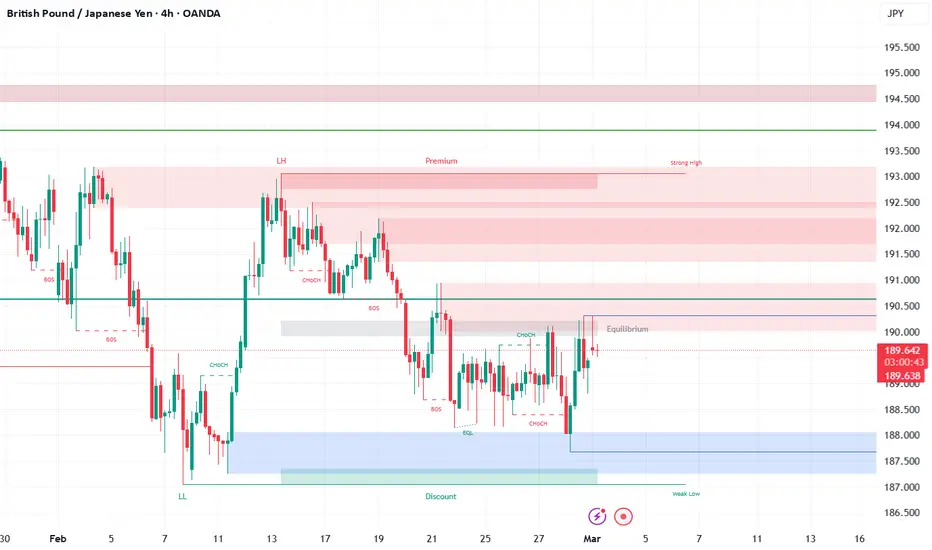
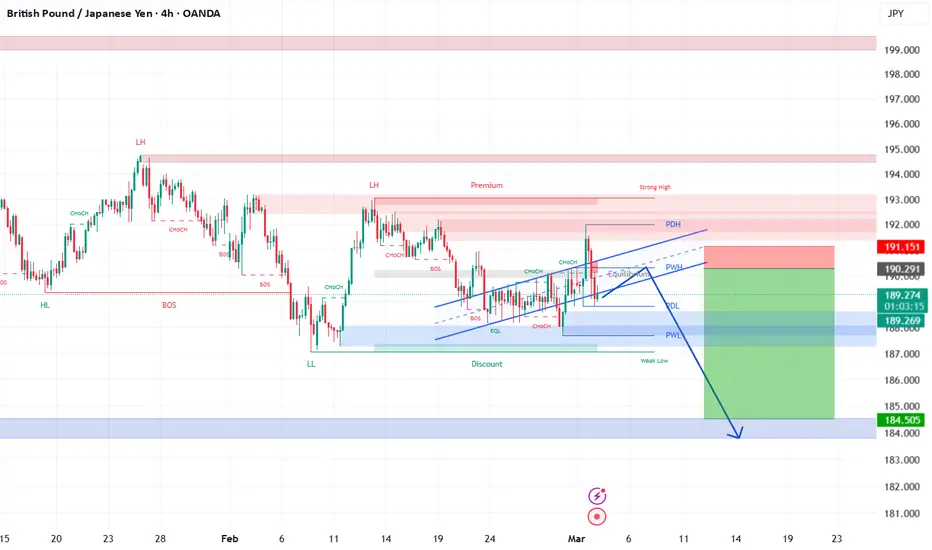
GBP/JPY e Analysis & Probability Estimation March 4 2025Key Observations Across Timeframes:
1. Market Structure & Trend Analysis:
Short-term (M15, M30):
Price is consolidating near 189.200, testing the previous daily low (PDL) for liquidity.
A Break of Structure (BOS) occurred, signaling short-term bearish control.
The price is hovering at a key demand zone (PWL - 188.500/187.800).
If price breaks below 188.800, further downside is likely.
Mid-term (H1, H4):
The price rejected equilibrium (~189.800 - 190.000), showing weakness.
A Change of Character (ChOCH) to the downside suggests a bearish trend continuation.
Liquidity below PWL (187.800) could be a target before a potential bounce.
Long-term (D1):
The price is in a larger downtrend, failing to break above premium zones (~190.500 - 192.000).
Liquidity below PWL (~188.000 - 187.500) is uncollected, making it a likely target.
The next major support lies in the discount zone (~185.500 - 186.500).
2. Key Liquidity Zones & Supply/Demand Areas:
Premium Zone (~190.500 - 192.000): Major resistance; rejection happened here.
Equilibrium (~189.800 - 190.000): Price failed to hold above, signaling weakness.
Discount Zone (~187.500 - 186.500): Next strong demand area if price continues lower.
Previous Daily Low (PDL - 188.800): Price is testing this level for liquidity; a break here could lead to further downside.
Previous Weekly Low (PWL - 187.500): Untapped liquidity below, making it a strong target for price movement.
Probability-Based Scenarios:
1. Bearish Continuation to 187.800 - 186.500 (Break Below PDL & PWL)
Probability: 65%
Reasons:
Failure to hold above equilibrium (189.800).
Bearish BOS & ChOCH confirmations on H1/H4 suggest a move down.
Liquidity below 188.000 (PWL) remains uncollected.
Strong daily downtrend supports further downside.
Bearish Confirmation:
If price breaks and holds below 188.800, expect a move toward 187.500 - 186.500.
2. Bullish Reversal from Discount Zone (Bounce from 188.500 - 187.500)
Probability: 35%
Reasons:
Potential liquidity grab at PWL (188.000 - 187.500) before reversing.
Demand zone at 187.500 - 186.500 could cause a bullish reaction.
If price holds above 188.800, we may see a bounce to 189.800 - 190.000.
Bullish Confirmation:
If price fails to break below 188.500, a push back toward equilibrium (189.800) is possible.
Final Thoughts & Trade Plan:
Bearish bias (65% probability) for continuation toward 187.800 - 186.500.
Key Confirmation Levels:
Below 188.800: Bearish toward 187.500 - 186.500.
Above 189.200: Potential bullish recovery toward 189.800 - 190.000.
Trade Setup Overview:
Bias: Bearish (65% probability)
Entry Type: Breakout & Retest
📉 Sell (Short) Trade Setup:
🔴 Entry: Below 188.800 (Confirmed BOS)
🎯 Take Profit (TP) Targets:
TP1: 188.200 (PWL - Previous Weekly Low)
TP2: 187.800 (Liquidity sweep level)
TP3: 186.500 (Major discount zone)
🛑 Stop Loss (SL): 189.400 (Above minor liquidity)
📊 Risk-to-Reward (R:R):
TP1: ~1:2
TP2: ~1:3
TP3: ~1:5
🔹 Confirmation Needed:
Strong candle close below 188.800 (Break & retest scenario)
No immediate bullish rejection at 188.500
📈 Buy (Long) Trade Setup (Lower Probability - 35%)
🟢 Entry: Above 189.200 (Bullish rejection & BOS)
🎯 Take Profit (TP) Targets:
TP1: 189.800 (Equilibrium zone)
TP2: 190.500 (Supply zone)
TP3: 191.500 (Major resistance)
🛑 Stop Loss (SL): 188.700 (Below structure low)
📊 Risk-to-Reward (R:R):
TP1: ~1:2
TP2: ~1:3
TP3: ~1:5
🔹 Confirmation Needed:
Price needs to hold above 189.200 with strong bullish momentum.
No immediate rejection from equilibrium (189.800).
🛠️ Execution Tips:
🔄 Wait for a clear breakout & retest before entering.
⚖️ Adjust lot size based on risk tolerance (~1-2% per trade).
🕰️ Monitor price action on the lower timeframes (M15/M30) for entry precision.
GBPJPY Finally Breaks Out Of Range: Should We Buy?I am buying GJ...
- BOS
- Bullish CHoCH
- Creating new HHs and HLs
- Retest of Bullish OB
- Sell side liquidity grab
Entry 189.347
SL 188.6
TP1 189.547
TP2 189.847
TP3 190.347
TP4 191.347
I have a price alert set for 190. Let's see how it goes...

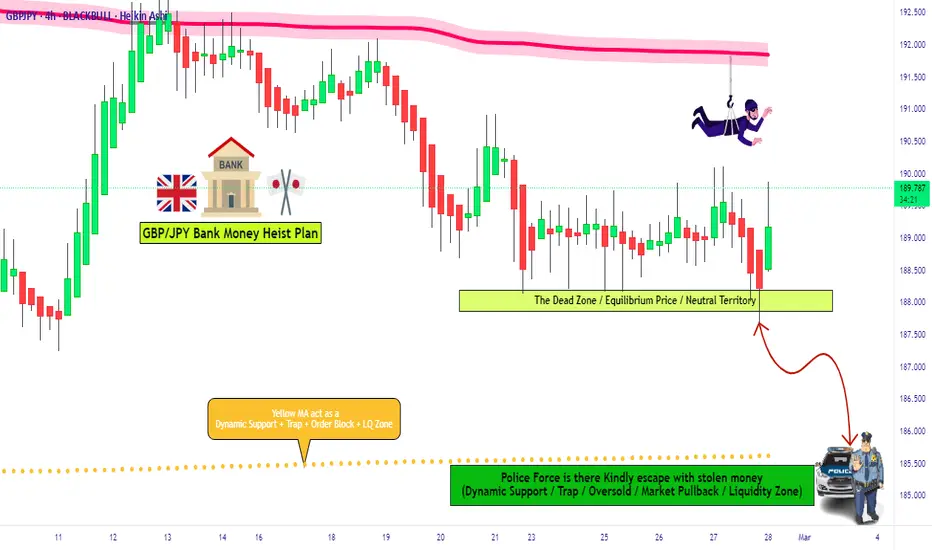
GBP/JPY "The Beast" Forex Market Heist Plan🌟Hi! Hola! Ola! Bonjour! Hallo! Marhaba!🌟
Dear Money Makers & Thieves, 🤑 💰🐱👤🐱🏍
Based on 🔥Thief Trading style technical and fundamental analysis🔥, here is our master plan to heist the ˗ˏˋ ★ ˎˊ˗GBP/JPY "The Beast" ˗ˏˋ ★ ˎˊ˗ Forex Market. Please adhere to the strategy I've outlined in the chart, which emphasizes short entry. Our aim is the high-risk Green Zone. Risky level, oversold market, consolidation, trend reversal, trap at the level where traders and bullish thieves are getting stronger. 🏆💸Book Profits Be wealthy and safe trade.💪🏆🎉
Entry 📈 : "The heist is on! Wait for the breakout (187.700) then make your move - Bearish profits await!" however I advise placing Sell limit orders within a 15 or 30 minute timeframe. Entry from the most recent or closest low or high level should be in retest.
Stop Loss 🛑: Thief SL placed at (190.500) swing Trade Basis Using the 3H period, the recent / swing high or low level.
SL is based on your risk of the trade, lot size and how many multiple orders you have to take.
Target 🎯: 185.000 (or) Escape Before the Target
🧲Scalpers, take note 👀 : only scalp on the Short side. If you have a lot of money, you can go straight away; if not, you can join swing traders and carry out the robbery plan. Use trailing SL to safeguard your money 💰.
📰🗞️Fundamental, Macro, COT Report, Sentimental Outlook:
GBP/JPY "The Beast" Forex Market is currently experiencing a Bearish trend in short term, driven by several key factors.
˗ˏˋ ★ ˎˊ˗Fundamental Analysis˗ˏˋ ★ ˎˊ˗
Interest Rates: BoE at 4-4.5% (easing cycle), BoJ at 0.25-0.5%—yield gap narrows, mildly bearish for GBP/JPY.
Inflation: UK at 2.5-3% (cooling), Japan at 2.5% (persistent)—neutral, balances GBP vs. JPY strength.
Growth: UK GDP ~1-1.5%, Japan ~1%—both modest, neutral impact.
Trade: UK exports lag, Japan benefits from U.S. tariff shifts—bullish for JPY, bearish for GBP/JPY.
Risk Sentiment: Safe-haven JPY gains in risk-off—bearish pressure.
˗ˏˋ ★ ˎˊ˗Macroeconomic Factors˗ˏˋ ★ ˎˊ˗
U.S.: Fed at 3-3.5%, PCE 2.6%—USD softness aids GBP/JPY—bullish (Eurostat/U.S. data).
Eurozone: PMI 46.2—stagnation weakens EUR, indirectly supports GBP—bullish (Eurostat).
Global: China 4.5%, Japan 1%—slow growth, JPY safe-haven appeal—bearish (ECB forecasts).
Commodities: Oil $70.44—stable, neutral for GBP/JPY (global data).
Trump Policies: Tariffs shift trade to Japan—JPY strength, bearish for GBP/JPY.
˗ˏˋ ★ ˎˊ˗Global Market Analysis˗ˏˋ ★ ˎˊ˗
Forex Markets: GBP/USD at 1.2650, USD/JPY at 150.00—GBP resilience vs. JPY strength—mixed.
Equity Markets: FTSE 100 stable, Nikkei range-bound—neutral correlation.
Crypto/Commodities: Gold at $2,930—risk-off supports JPY—bearish.
˗ˏˋ ★ ˎˊ˗Commitments of Traders (COT) Data˗ˏˋ ★ ˎˊ˗
Speculators: Net short JPY ~140,000 contracts (down from 150,000)—fading bearishness, mildly bullish JPY.
Hedgers: Net long JPY ~90,000—exporters expect JPY strength, bearish for GBP/JPY.
Open Interest: ~280,000 contracts—steady interest, neutral.
˗ˏˋ ★ ˎˊ˗Market Sentiment Analysis˗ˏˋ ★ ˎˊ˗
Retail: 65% short GBP/JPY at 189.50 (global X posts)—contrarian upside—bullish potential.
Institutional: Cautious, favoring JPY in risk-off—bearish outlook.
Corporate: UK/Japan firms hedge at 190-192—neutral.
Social Media Trends: Bearish setups to 185.00—short-term bearish sentiment.
˗ˏˋ ★ ˎˊ˗Positioning Analysis˗ˏˋ ★ ˎˊ˗
Speculative: Longs target 192.00-194.00, shorts aim for 188.00-185.00.
Retail: Shorts at 190.00-191.00—squeeze risk if price rises.
Institutional: Leaning short GBP/JPY, eyeing JPY strength.
˗ˏˋ ★ ˎˊ˗Quantitative Analysis˗ˏˋ ★ ˎˊ˗
SMAs: 50-day ~194.00, 200-day ~193.00—price below both, bearish signal.
RSI: 45 (daily)—neutral, fading bearish momentum.
Bollinger: 188.50-190.50—price near lower band, potential bounce.
Fibonacci: 38.2% from 198.94-189.31 at 190.50—resistance above.
Volatility: 1-month IV 10%—±1.80 daily range.
˗ˏˋ ★ ˎˊ˗Intermarket Analysis˗ˏˋ ★ ˎˊ˗
GBP/USD: 1.2650—GBP holds vs. USD, bullish for GBP/JPY.
USD/JPY: 150.00—JPY weakens vs. USD, bullish for GBP/JPY.
XAU/USD: $2,930—gold rise, JPY safe-haven—bearish.
FTSE 100: Stable—neutral.
Bonds: UK 10-year 4%, Japan 0.9%—yield gap narrows, bearish.
˗ˏˋ ★ ˎˊ˗News and Events Analysis˗ˏˋ ★ ˎˊ˗
Recent: Trump tariff threats (25% Mexico/Canada, 10% China, Feb 25)—risk-off lifts JPY—bearish.
Upcoming: U.S. PCE today (Feb 28)—hot data strengthens USD, pressures GBP/JPY; soft data boosts risk-on, supports GBP—mixed impact.
Impact: Bearish bias today, PCE reaction pivotal.
˗ˏˋ ★ ˎˊ˗Next Trend Move˗ˏˋ ★ ˎˊ˗
Technical:
Support: 188.50-188.00
Resistance: 190.50-192.00
Below 188.50 targets 185.00; above 190.50 aims for 194.00.
Short-Term (1-2 Days): Dip to 188.00 if PCE lifts USD; rebound to 190.50 if risk-on prevails.
Medium-Term (1-3 Months): Range 185.00-195.00, tariff/JPY strength key.
˗ˏˋ ★ ˎˊ˗Overall Summary Outlook˗ˏˋ ★ ˎˊ˗
GBP/JPY at 189.50 faces bearish short-term pressure from JPY safe-haven demand (tariffs, risk-off) and technicals (below SMAs), despite GBP resilience vs. USD. COT shows fading JPY shorts, sentiment leans bearish, and PCE today could sway direction. A short-term dip to 188.00 is likely, with medium-term consolidation unless macro shifts favor GBP.
˗ˏˋ ★ ˎˊ˗Future Prediction˗ˏˋ ★ ˎˊ˗
Bullish: 192.00-195.00 by Q2 2025 if USD softens (DXY to 105), risk-on resumes, or BoE holds rates.
Bearish: 185.00-188.00 if JPY strengthens (USD/JPY to 145), tariffs escalate, or risk-off persists.
Prediction: Bearish short-term to 188.00 (PCE/USD strength), then cautiously bullish to 192.00 by mid-2025 (risk-on recovery).
📌Keep in mind that these factors can change rapidly, and it's essential to stay up-to-date with market developments and adjust your analysis accordingly.
⚠️Trading Alert : News Releases and Position Management 📰 🗞️ 🚫🚏
As a reminder, news releases can have a significant impact on market prices and volatility. To minimize potential losses and protect your running positions,
we recommend the following:
Avoid taking new trades during news releases
Use trailing stop-loss orders to protect your running positions and lock in profits
💖Supporting our robbery plan 💥Hit the Boost Button💥 will enable us to effortlessly make and steal money 💰💵. Boost the strength of our robbery team. Every day in this market make money with ease by using the Thief Trading Style.🏆💪🤝❤️🎉🚀
I'll see you soon with another heist plan, so stay tuned 🤑🐱👤🤗🤩
GBP/JPY Multi-Timeframe Analysis & Probability Estimation **Timeframes Covered:**
- **30-Minute (M30)**
- **1-Hour (H1)**
- **4-Hour (H4)**
- **Daily (D1)**
**Key Observations Across Timeframes:**
**1. Market Structure & Trend Analysis:**
- **Short-term:** (M30, H1) Price is trading near **equilibrium (~189.600 - 189.800)** with minor bullish structure.
- **Mid-term:** (H4) Price is rejecting from a previous **liquidity zone**, but still inside a bearish structure.
- **Long-term:** (D1) Overall, **GBPJPY is still bearish** with price bouncing from the **discount zone (188.000 - 187.500)** but failing to break above **key resistance (190.500 - 191.000).**
**2. Supply & Demand Zones:**
- **Premium Zone (~190.500 - 193.000):** Strong supply zone, price may reject if it reaches this level.
- **Discount Zone (~187.500 - 186.500):** Strong demand zone where price recently found buyers.
- **Equilibrium (~189.600 - 189.800):** Price is currently consolidating, meaning market is undecided.
**3. Liquidity Areas & Key Levels:**
- **Previous Daily High (PDH ~190.000) & Previous Weekly High (PWH ~192.000):** These levels may act as liquidity magnets.
- **Previous Weekly Low (PWL ~187.500):** If price drops, this will be the next area of interest for liquidity.
- **Weak High near 190.500:** If price struggles here, expect a reversal.
---
**Probability-Based Scenarios:**
**1. Bullish Scenario (Move Towards 190.500 - 192.000)**
- **Probability: 50%**
- **Reasons:**
- Short-term bullish momentum (M30 & H1) suggests price might push toward the **premium zone (190.500 - 192.000).**
- If price **breaks and holds above 189.800**, it could push higher.
- Liquidity above **PDH (190.000) could be a target** before a potential rejection.
**2. Bearish Scenario (Drop Below 188.500 Towards PWL)**
- **Probability: 50%**
- **Reasons:**
- **H4 & D1 remain bearish**, meaning a continuation of the downtrend is still possible.
- If price **fails to hold above 189.600**, expect a move lower towards **188.500 or even 187.500 (PWL).**
- The **0.618 Fibonacci level (190.626) is acting as strong resistance.**
**Final Thoughts & Trade Plan:**
- **Market is currently in a neutral zone (50/50 probability)**, meaning it can go either way.
- **Key Confirmation Levels:**
- **Above 189.800:** Bullish towards **190.500 - 192.000**.
- **Below 189.600:** Bearish towards **188.500 - 187.500**.