GBPJPY top-down analysisHello traders, this is a complete multiple timeframe analysis of this pair. We see could find significant trading opportunities as per analysis upon price action confirmation we may take this trade. Smash the like button if you find value in this analysis and drop a comment if you have any questions or let me know which pair to cover in my next analysis.
Gbpjpysignals

GBPJPY short term long-we have a really strong weekly wick rejection on 166.000 so its only short term long
-we broke 163.500 4h level
Short term long. Overall im bearish

GBPJPY Approaching the most optimal sell levelThis is an update to our GBPJPY analysis at the start of the month:
As you see the price followed exceptionally well the Symmetrical trade suggested and broke above both the 1D MA50 (blue trend-line) and 1D MA200 (orange trend-line). As it is now approaching the Symmetrical Resistance Zone, while the 1D RSI is near the 70.00 Overbought barrier, we are turning bearish on GBPJPY again. Our target is first the dashed Higher Lows trend-line and if broken, the Symmetrical Support level.
-------------------------------------------------------------------------------
** Please LIKE 👍, FOLLOW ✅, SHARE 🙌 and COMMENT ✍ if you enjoy this idea! Also share your ideas and charts in the comments section below! **
-------------------------------------------------------------------------------
💸💸💸💸💸💸
👇 👇 👇 👇 👇 👇

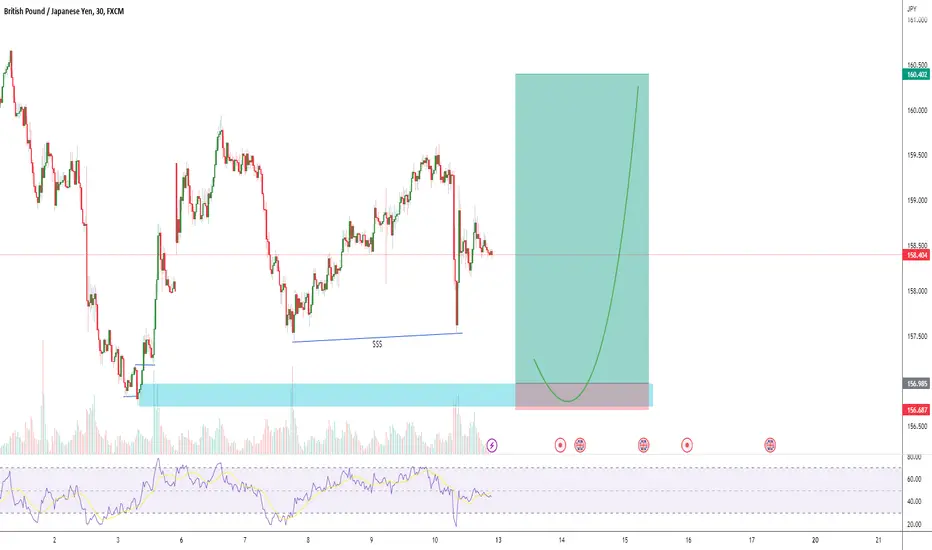
GBPJPY, M30 Expecting down before up moveGBPJPY, M30 Expecting down before up as the price will go down to take liquidity from POI
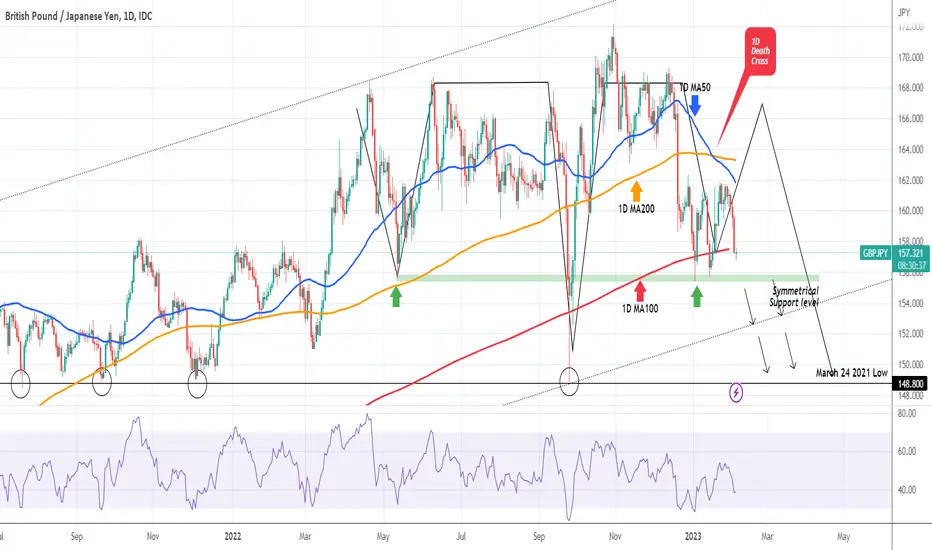
GBPJPY Bearish as long as it's below the 1D MA50.The GBPJPY pair has been trading below its 1D MA50 (blue trend-line) since December 16 2022. With a 1D Golden Cross having formed on January 17, the price is about to test for the 3rd time in a month the 155.770 - 155.400 Symmetrical Support Zone. A break below it would target the dotted line (multi-year Channel Up bottom) and below that the 148.800 Support which has held 5 times since the March 2021 Low.
On the other hand if the Symmetrical Support holds, it will make a Triple bottom and it will be a short-term buy opportunity towards the 1D MA50. Any time that breaks, it will extend the rebound above 166.00, which based on the Symmetrical pattern since May 2022, it will be the most optimal long-term sell opportunity.
-------------------------------------------------------------------------------
** Please LIKE 👍, FOLLOW ✅, SHARE 🙌 and COMMENT ✍ if you enjoy this idea! Also share your ideas and charts in the comments section below! **
-------------------------------------------------------------------------------
💸💸💸💸💸💸
👇 👇 👇 👇 👇 👇
GBPJPY top-down analysisHello traders, this is a complete multiple timeframe analysis of this pair. We see could find significant trading opportunities as per analysis upon price action confirmation we may take this trade. Smash the like button if you find value in this analysis and drop a comment if you have any questions or let me know which pair to cover in my next analysis.

GBPJPY - FUNDAMENTALS WITH SECHNICAL BIAS#GBPJPY
- According to the GBPJPY analysis we gave the previous day, the GBPJPY SELL SIDE WAVE was moving very well in the previous days. The reason for that was FUNDAMENTALLY STRONG JP10Y STRONG JPY STRONG causing GBP WEAK. And because the MARKET SENTIMENT is STRONG. XXXJPY has been selling very fast since last week.
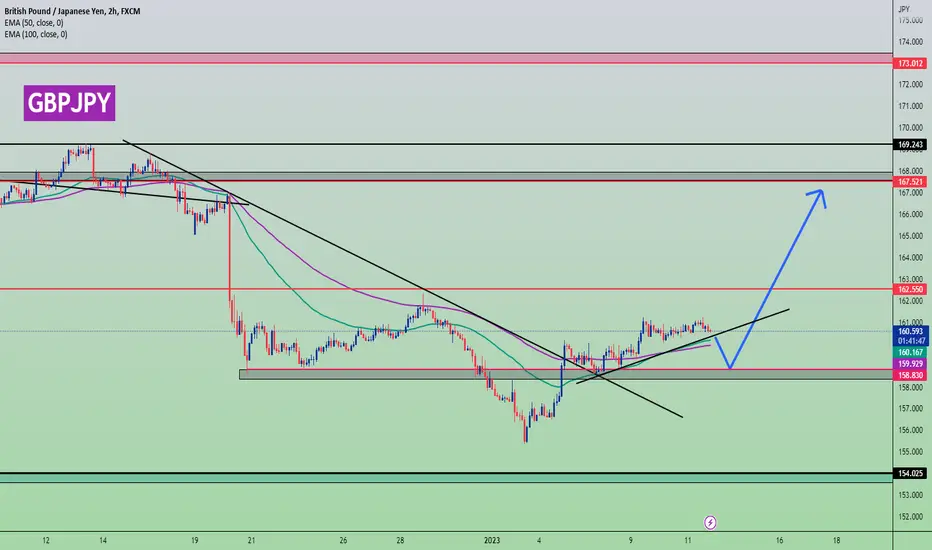
- JPY has become somewhat STRONG as VIX is slightly UP. Due to this, STOCKS and XXXJPY CURRENCY were slightly SELL. GBPJPY also SELL because of that. But now there is a bit of RISK ON BIAS. Therefore, GJ can be BUY in the future.
- Currently GBPJPY LONG TERM can move up to the LEVEL 167.52. Also, according to the GBPJPY STRUCTURE, before BUY, you can move down to the SUPPORT LEVEL of 158.83 to the SUPPORT LEVEL.
Therefore, attention should be paid to MARKET UPDATES and MARKET SENTIMENT. Currently, the MARKET is somewhat RISK ON. Therefore, XXXJPY will be a BUY in the future. Therefore, pay attention to the CURRENT MARKET SENTIMENT.
GbpJpy- Buy dips for 165 target and great R:RLike all Jpy pairs, GbpJpy also reversed strongly from support yesterday.
Now the pair is trading in a resistance zone, but, considering the power of reversal from yesterday, in my opinion, this resistance will fall.
At this moment GbpJpy is correction yesterday's up move, and this drop could offer traders a good chance to enter buy trades at a good price.
My target for GbpJpy is 165 zone and a drop under yesterday's low would negate this bullish scenario

GBPJPY NEW Entries/ExitsMy course is finally available! If you would like it in order to understand how to play my analysis FULLY, please let me know privately.
All likes/comments and feedback are very much appreciated!
How to play my chart:
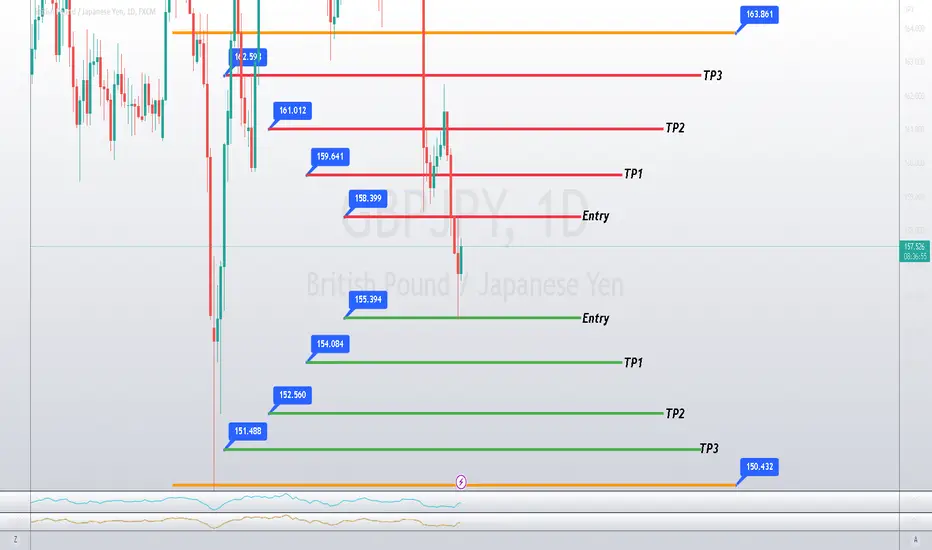
Buy at support, sell at resistance. When you open this chart you'll see a green entry and a red entry. When the candlestick hits the green entry, you place a buy. If however that support buy doesn't go into profit and goes negative -35 or -60 pips (depending if it was a fast break/or if the break landed on a minute 15 zone), if it breaks you would then exit your buy and immediately enter the sell. You would then ride that sell down to green TP1, or you could then repeat and play the buy/break there.
The same exact thing goes for resistance sell/break plays!
All likes/comments and feedback are very much appreciated!
How to play my chart:
Buy at support, sell at resistance. When you open this chart you'll see a green entry and a red entry. When the candlestick hits the green entry, you place a buy. If however that support buy doesn't go into profit and goes negative -35 or -60 pips (depending if it was a fast break/or if the break landed on a minute 15 zone), if it breaks you would then exit your buy and immediately enter the sell. You would then ride that sell down to green TP1, or you could then repeat and play the buy/break there.
The same exact thing goes for resistance sell/break plays!
GBPJPY top-down analysisHello traders, this is a complete multiple timeframe analysis of this pair. We see could find significant trading opportunities as per analysis upon price action confirmation we may take this trade. Smash the like button if you find value in this analysis and drop a comment if you have any questions or let me know which pair to cover in my next analysis.

GBPJPY top-down analysisHello traders, this is a complete multiple timeframe analysis of this pair. We see could find significant trading opportunities as per analysis upon price action confirmation we may take this trade. Smash the like button if you find value in this analysis and drop a comment if you have any questions or let me know which pair to cover in my next analysis.

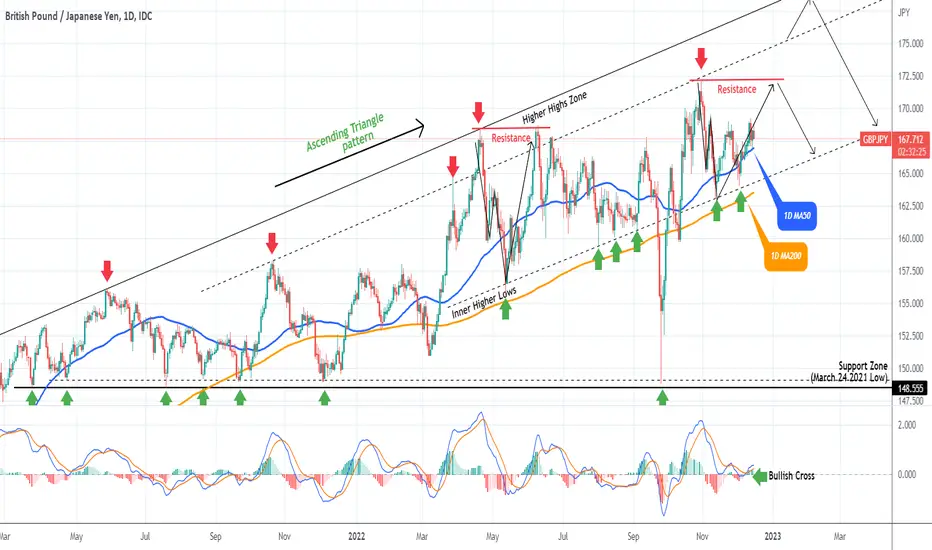
GBPJPY targeting 172.250 on the medium-term.The GBPJPY pair has been rebounding strongly since the November 11 Low within the 1D MA50 (blue trend-line) and the 1D MA200 (orange trend-line). The Low was made on the Inner Higher Lows trend-line, that has had five hit-and-holds since May 12.
Based on the 1D MACD also, this sequence resembles the April 20 - June 09 fractal , whose rebound reached the previous High, which is now the Resistance at 172.250. This is the short-term target.
On the long-term you see that the pattern is an Ascending Triangle (since March 2021 and we are close to the Higher Highs Zone. Every hit either on the dashed or top trend-line is a sell opportunity, until the pattern is invalidated.
-------------------------------------------------------------------------------
** Please LIKE 👍, SUBSCRIBE ✅, SHARE 🙌 and COMMENT ✍ if you enjoy this idea! Also share your ideas and charts in the comments section below! This is best way to keep it relevant, support me, keep the content here free and allow the idea to reach as many people as possible. **
-------------------------------------------------------------------------------
You may also TELL ME 🙋♀️🙋♂️ in the comments section which symbol you want me to analyze next and on which time-frame. The one with the most posts will be published tomorrow! 👏🎁
-------------------------------------------------------------------------------
💸💸💸💸💸💸
👇 👇 👇 👇 👇 👇
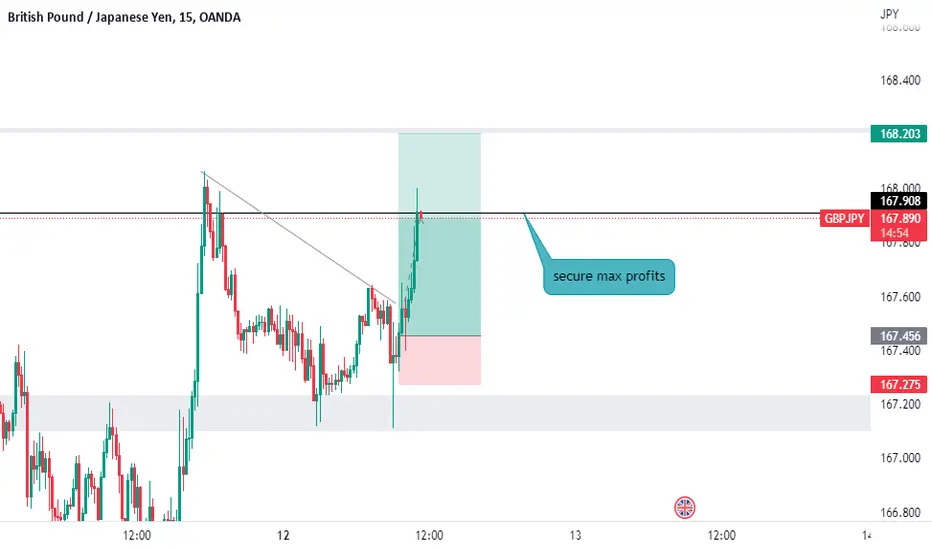
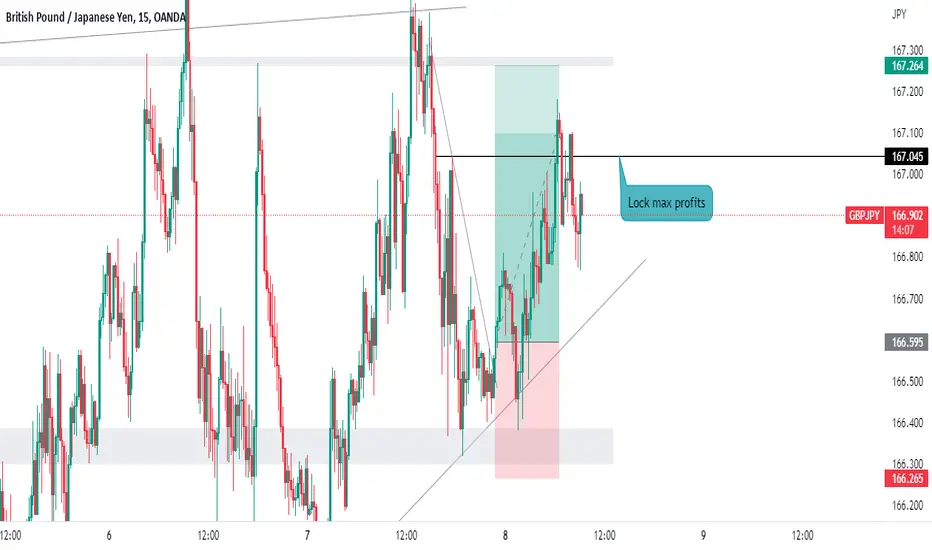
GBPJPYGBPJPY i secured my max profits hitted my target.Lets not be greedy and take what the markets gives you.Remenber be desciplined
GBPJPY top-down analysisHello traders, this is a complete multiple timeframe analysis of this pair. We see could find significant trading opportunities as per analysis upon price action confirmation we may take this trade. Smash the like button if you find value in this analysis and drop a comment if you have any questions or let me know which pair to cover in my next analysis.

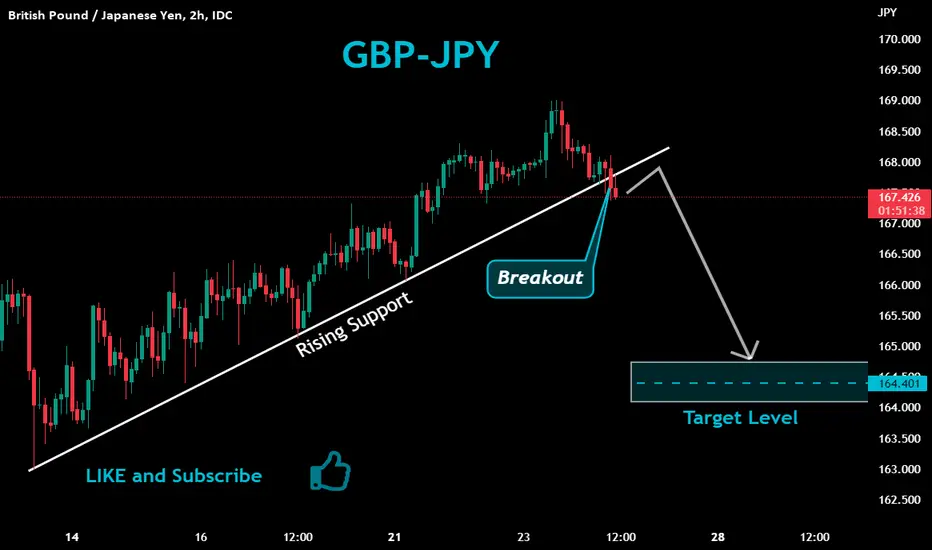
GBPJPY Will Keep Falling! GBP-JPY was trading in an uptrend
But then we saw a bearish breakout
Of the rising support
I think it will re-test the growing rising support
then Will fall even further down
Towards the target below
GBPJPY targeting 172.250. Excellent long-term pattern.The GBPJPY pair has been rebounding strongly since the November 11 Low within the 1D MA50 (blue trend-line) and the 1D MA200 (orange trend-line). The Low was made on the Inner Higher Lows trend-line, that has had four hit-and-holds since May 12.
Based on the 1D MACD also, this sequence resembles the April 20 - June 09 fractal, whose rebound reached the previous High, which is now the Resistance at 172.250. This is the short-term target.
On the long-term you see that the pattern is an Ascending Triangle (since March 2021 and we are close to the Higher Highs Zone. Every hit either on the dashed or top trend-line is a sell opportunity, until the pattern is invalidated.
-------------------------------------------------------------------------------
** Please LIKE 👍, SUBSCRIBE ✅, SHARE 🙌 and COMMENT ✍ if you enjoy this idea! Also share your ideas and charts in the comments section below! This is best way to keep it relevant, support me, keep the content here free and allow the idea to reach as many people as possible. **
-------------------------------------------------------------------------------
You may also TELL ME 🙋♀️🙋♂️ in the comments section which symbol you want me to analyze next and on which time-frame. The one with the most posts will be published tomorrow! 👏🎁
-------------------------------------------------------------------------------
👇 👇 👇 👇 👇 👇
💸💸💸💸💸💸
👇 👇 👇 👇 👇 👇

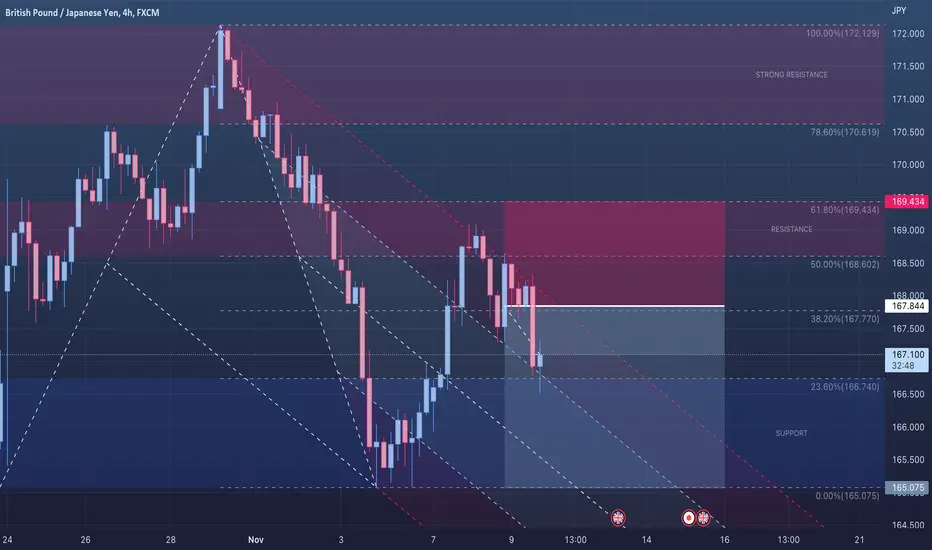
🔴 GBPJPY - 4H (09.11.2022)🔴 GBPJPY
TF: 4H
Side: Short
SL: ¥169.434
Entry: ¥167.844
TP 1: ¥166.740
TP 2: ¥165.075
GBP is losing strength so it's time to start selling it.
GBPJPY - FUNDAMENTALS WITH SECHNICAL BIAS#GBPJPY
- According to the GBPJPY analysis we gave the previous day, the GBPJPY SELL SIDE WAVE was moving very well in the previous days. The reason for that was, FUNDAMENTALLY JPY STRONG, GBP WEAK. And because the MARKET SENTIMENT is STRONG. XXXJPY has been selling very fast since last week.
- JPY has become somewhat WEAK because VIX is slightly DOWN. Due to this, STOCKS and XXXJPY CURRENCY were slightly BUY. GBPJPY also became BUY because of that. But now there is a RISK ON BIAS. Therefore, GJ can be BUY in the future.
- Currently GBPJPY LONG TERM can move up to the LEVEL 173.00. Also, according to the GBPJPY STRUCTURE, before BUY, you can move down to the SUPPORT LEVEL of 162.56 to the SUPPORT LEVEL.
Therefore, attention should be paid to MARKET UPDATES and MARKET SENTIMENT. A BOJ INTERVENTION MAY NOT HAPPEN AGAIN. Currently the MARKET is RISK ON. Therefore, XXXJPY should be BUY. Therefore, pay attention to the CURRENT MARKET SENTIMENT.

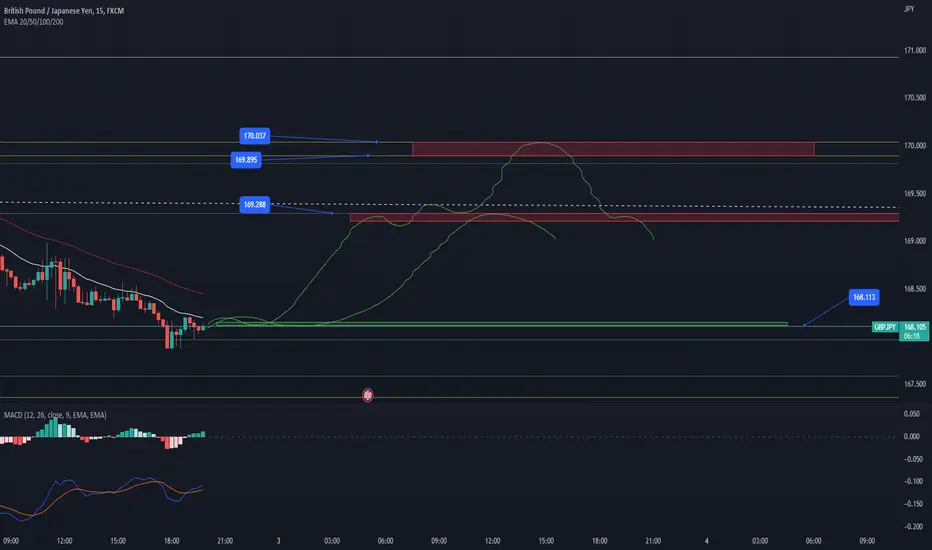
GBPJPY Possible Long swing/Short swingat the moment i am waiting for a entry to long gbpjpy to 169.288 (.236 lvl) and that will be my first tp
my entry i would need the hourly to close above 168.113 then i think it can run back up to 169.288 if a 15 - 30 min candle does not close above then i will short but reall i want it to break over and run all the way up to 169.895 - 170.037 as my short entry the rest for that is its my 10% zone (rejection zone) and it'll form a head and shoulders so its the safest entry and the r/r is alot better and my tp will be 168.113 short
Long entry : Hourly close and stays above 168.113
TP 1: 169.288
TP2 : 169.895 - 170.037
Short entry:
Entry 1: 169.288
TP 1: 168.113
Tp 2: 163.390 (swing)
Entry 2 : 170.037 - 169.895
TP 1: 169.288
TP 2: 168.113
TP 3: 163.390 (swing)
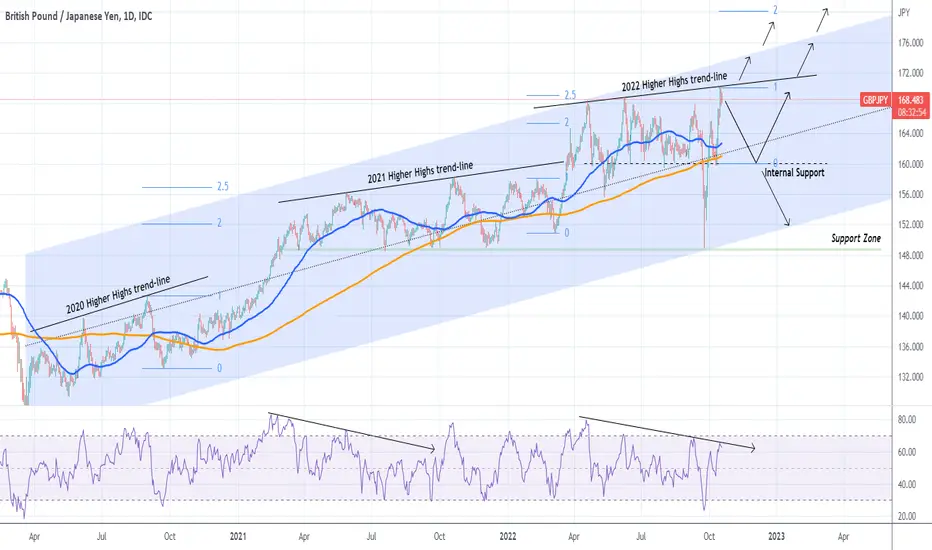
GBPJPY Highly important trend-lines to watch.The recent volatility on the GBPJPY pair has been extreme. This price action can only be traded on the long-term by taking break-out positions on key Support and Resistance levels.
As you see, the long-term trend has been a Channel Up ever since the March 2020 COVID bottom. Recently, the 148.600 - 149.000 Support Zone that has been holding since March 24 2021, was successfully tested and provided a massive rebound to the pair. On Monday this rebound hit the Higher Highs trend-line of 2022. As long as it holds, expect a pull-back towards the 1D MA50 (blue trend-line) and the 1D MA200 (orange trend-line), even the Internal Support of 160.000.
As per the 2021 fractal there are high chances of a rebound there but a weekly close below can put the bottom of the 2 year Channel Up to test again. Any time we close above the 2022 Higher Highs trend-line, consider a short-term break-out buy targeting the top of the Channel Up. This pattern can break to the upside if the 2.0 - 2.5 Fibonacci fractal seen at the end of each Higher Highs sequence is repeated again. In that case, take the Fib from the last low of 2022 and calculate the 2.0 - 2.5 extension zone.
-------------------------------------------------------------------------------
** Please LIKE 👍, SUBSCRIBE ✅, SHARE 🙌 and COMMENT ✍ if you enjoy this idea! Also share your ideas and charts in the comments section below! This is best way to keep it relevant, support me, keep the content here free and allow the idea to reach as many people as possible. **
-------------------------------------------------------------------------------
You may also TELL ME 🙋♀️🙋♂️ in the comments section which symbol you want me to analyze next and on which time-frame. The one with the most posts will be published tomorrow! 👏🎁
-------------------------------------------------------------------------------
👇 👇 👇 👇 👇 👇
💸💸💸💸💸💸
👇 👇 👇 👇 👇 👇
GBPJPY top-down analysisHello traders, this is a complete multiple timeframe analysis of this pair. We see could find significant trading opportunities as per analysis upon price action confirmation we may take this trade. Smash the like button if you find value in this analysis and drop a comment if you have any questions or let me know which pair to cover in my next analysis.
