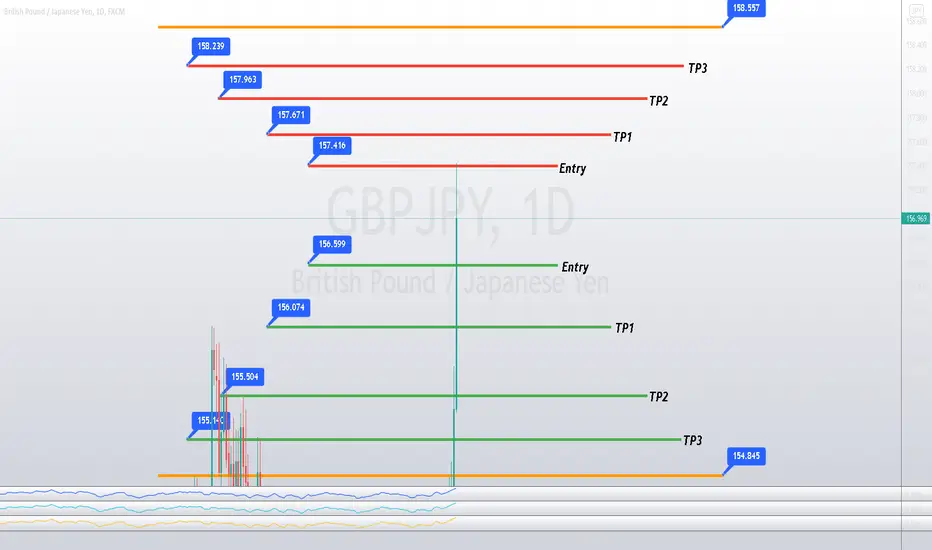
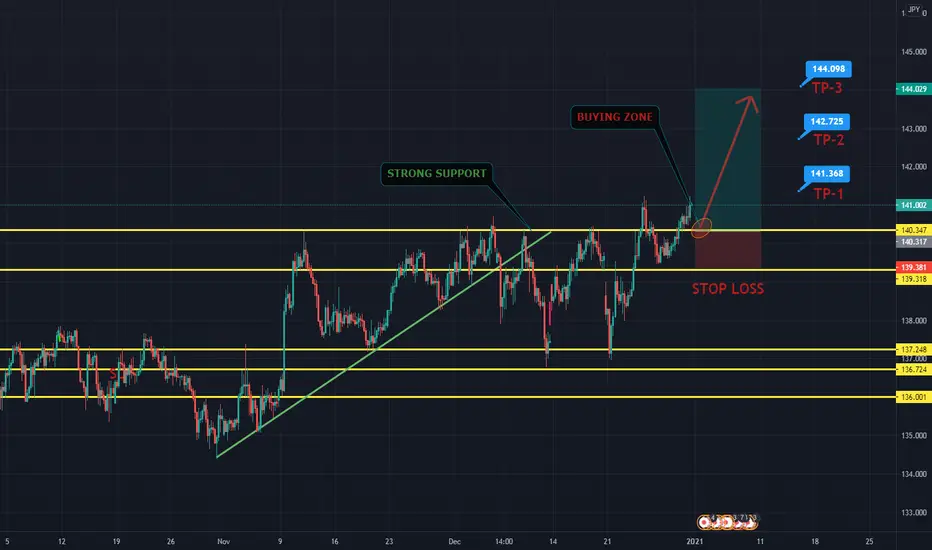
GBPJPY Entries + Exits FOR FREE!The ENTRY/TP zones are your entries as well as your exits.
Everything above the current candlestick is resistance, you would treat every zone above as a sell/potential buy break.
Everything below the current candlestick is support, which you would then treat every zone below as a buy/potential sell break if it hits the pip rule.
More info on the strategy and how to play it:
How To Play The Chart Entries/Exits:
Buy at green support entry, if it breaks by -35 pips (count it out) then enter a sell and ride to TP1, 2 and 3. Trail stop at each TP which means place your stop loss in profit but with enough room to be able to continue the sell if it continues. Same thing at resistance, sell but if broken by 35 pips then enter the buy and ride to TP1. Each TP is a support or resistance zone , so you could then even take a sell after TP1 for the buys have been hit and if it breaks out then just repeat.
All likes/comments and feedback are very much appreciated! Thank you to all of those who support me on a weekly basis, it really does mean a ton to me!
Gbpjpysignals
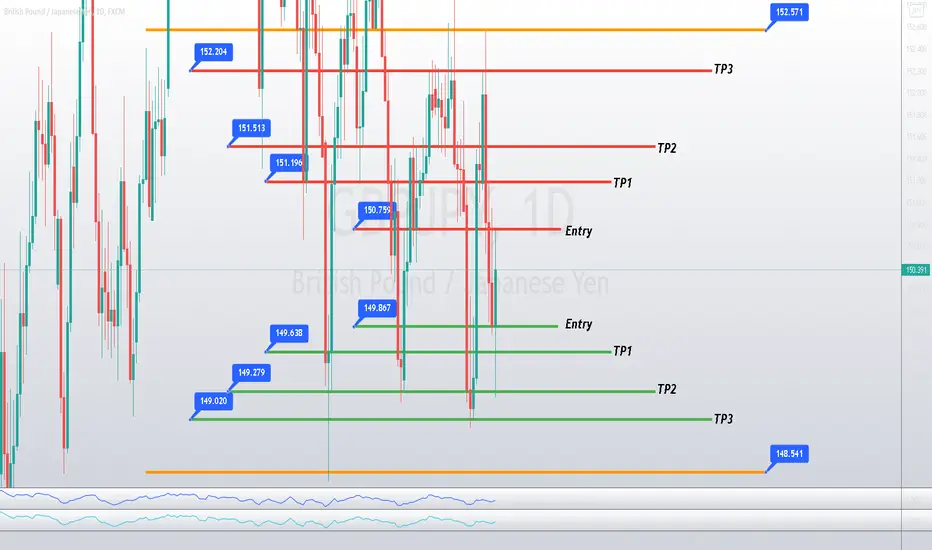
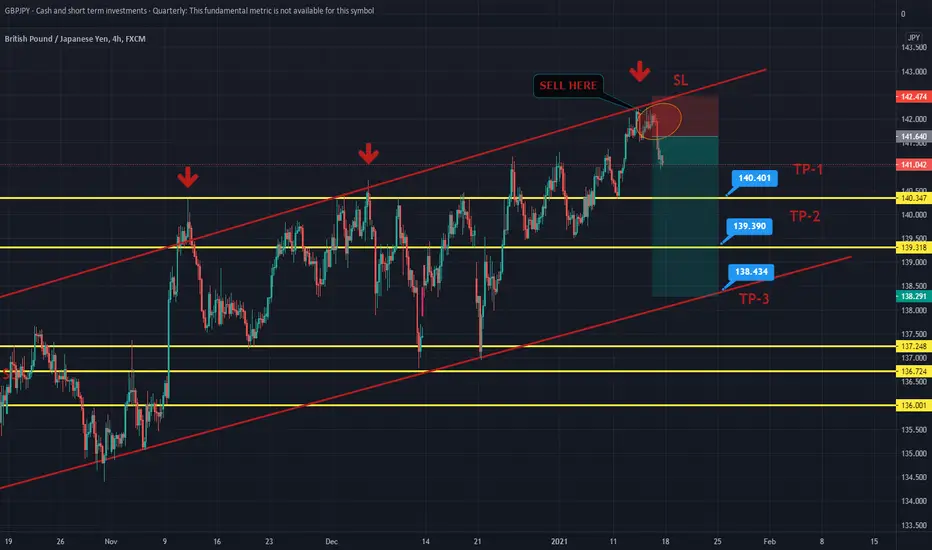
GBPJPY Entries + Exits! REVERSE IS GUARENTEED IF PLAYED CORRECTHow To Play The Chart Entries/Exits:
Buy at green support entry, if it breaks by -35 pips (count it out) then enter a sell and ride to TP1, 2 and 3. Trail stop at each TP which means place your stop loss in profit but with enough room to be able to continue the sell if it continues. Same thing at resistance, sell but if broken by 35 pips then enter the buy and ride to TP1. Each TP is a support or resistance zone , so you could then even take a sell after TP1 for the buys have been hit and if it breaks out then just repeat.
All likes/comments and feedback are very much appreciated! Thank you to all of those who support me on a weekly basis, it really does mean a ton to me!
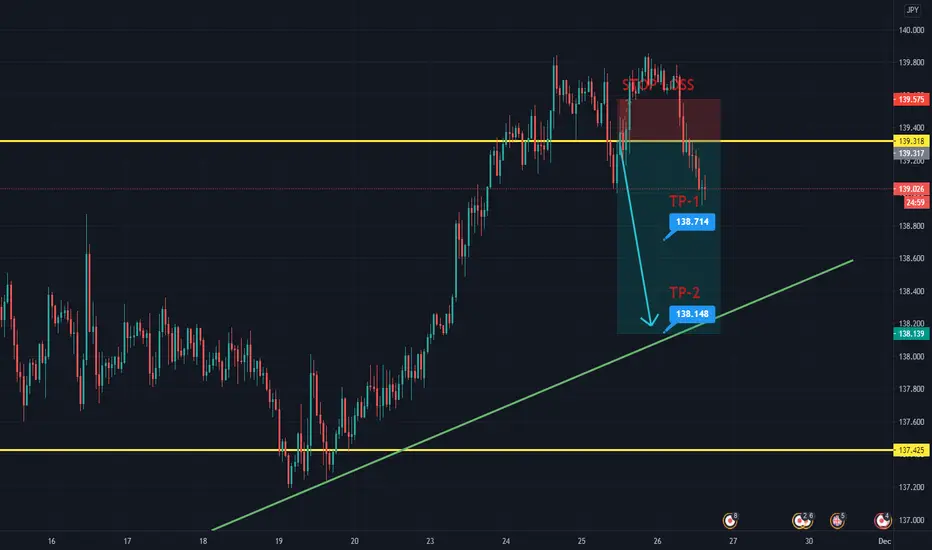
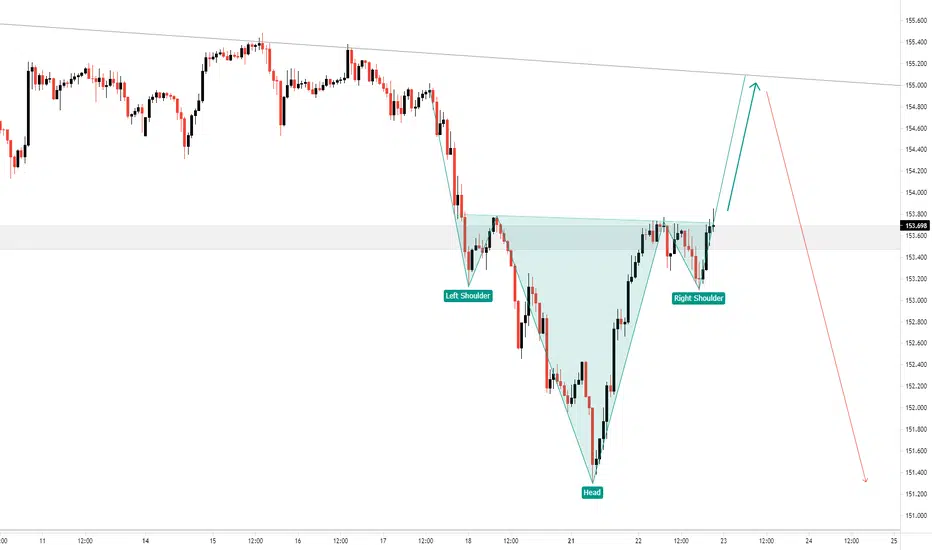
sell for GBPJPYThis is just an idea and not a signal. Depending on the pattern of the head and shoulders, it can be seen that the situation may continue to decline.

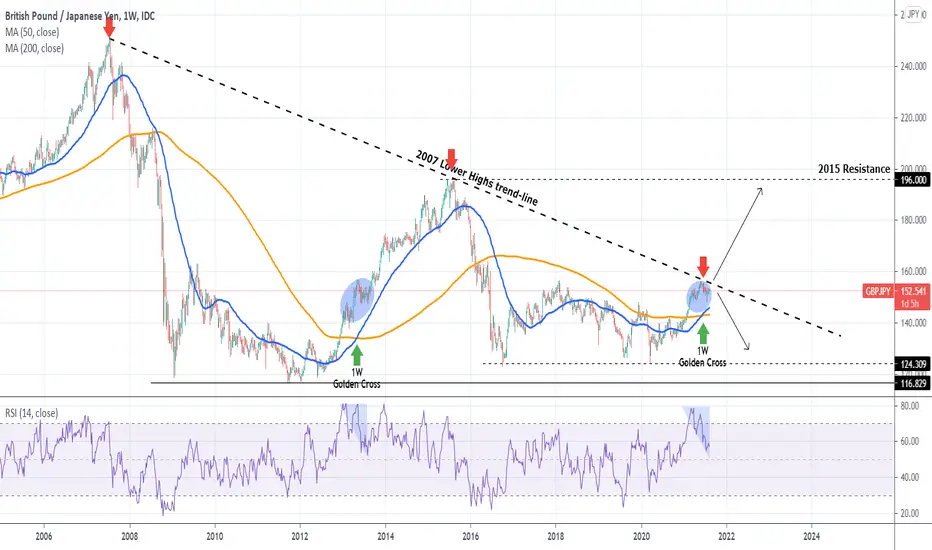
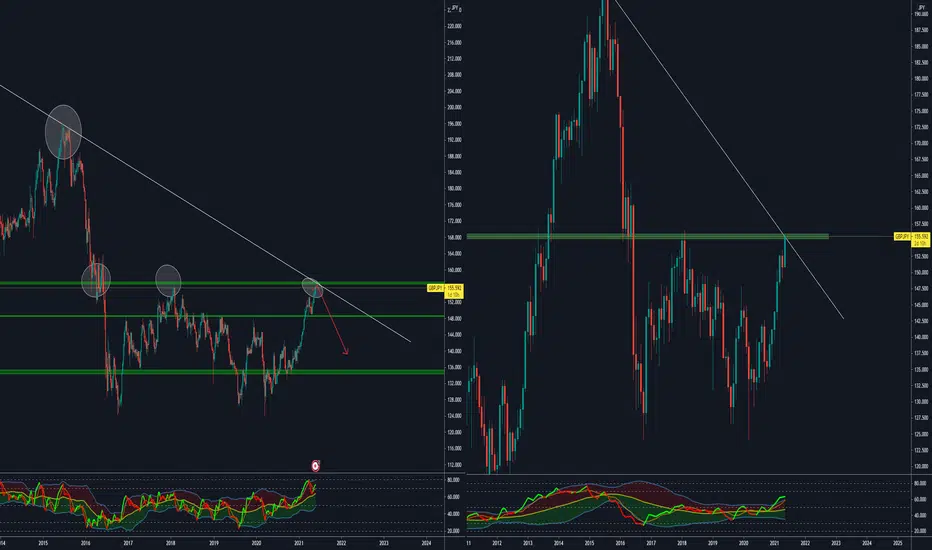
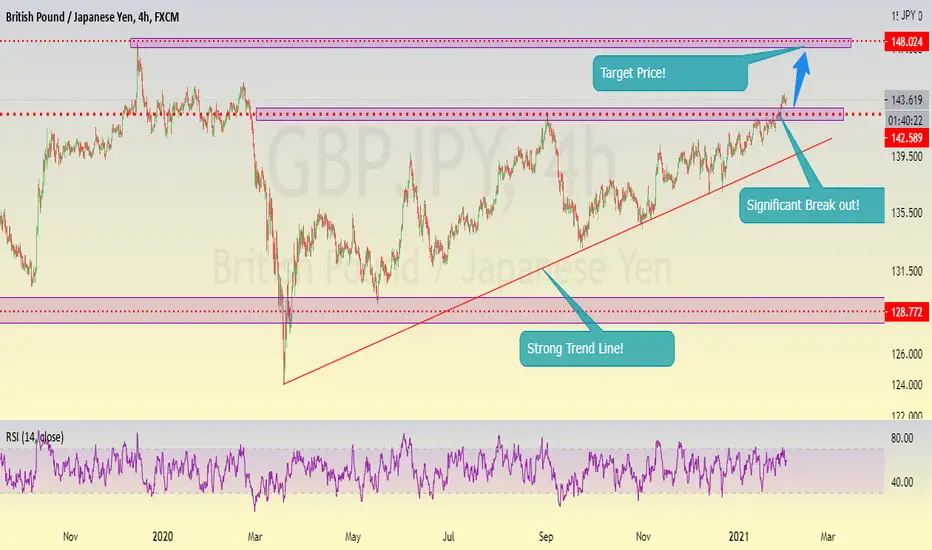
GBPJPY Major Resistance from 2007!GBPJPY is ahead of a "Make or break" situation as it is facing the Lower Highs trend-line that started all the way back from the 2007 subprime mortgage crisis. As long as it holds, the pair will most likely reverse back towards the lower Support levels.
However if the 2007 line breaks, then it will most likely enter a new 1-2 year Bull Phase towards the 205 Resistance. Both the 1W RSI and the Golden Cross are in similar places as in July-August 2013. We may be repeating the same fractal.
Which of the two do you think will prevail?
Most recent GBPJPY idea:
** Please support this idea with your likes and comments, it is the best way to keep it relevant and support me. **
--------------------------------------------------------------------------------------------------------
!! Donations via TradingView coins also help me a great deal at posting more free trading content and signals here !!
🎉 👍 Shout-out to TradingShot's 💰 top TradingView Coin donor 💰 this week ==> nevada999
--------------------------------------------------------------------------------------------------------
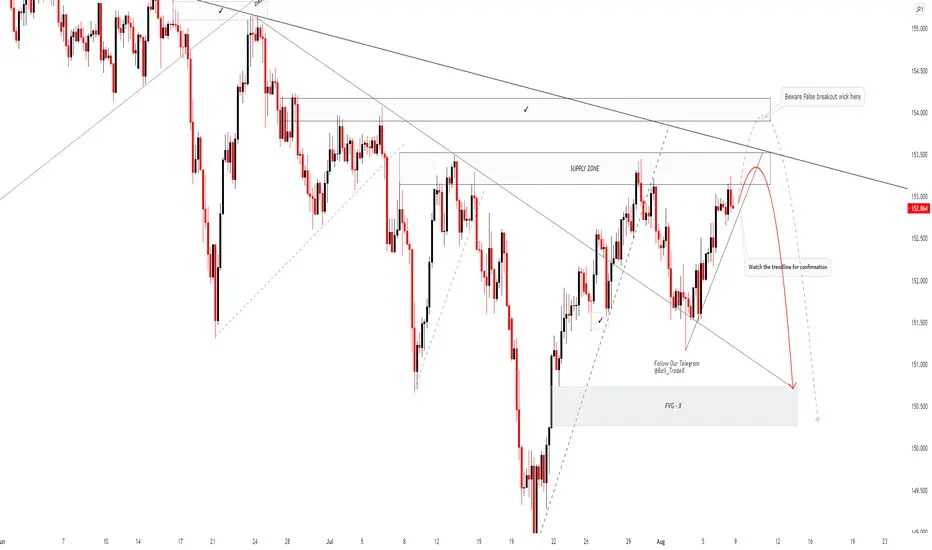
GBPJPY: BEWARE FALSE BREAKOUT SOON.Since last week, Japan has big problem again with Corona Delta variant and very common could delay economic recovery in Japan.
you check on Daily chart of #CoronaVirus cases in Japan.
Just worry it will create false breakout on the chart.
Play safe and wait confirmation and do not rush your trade
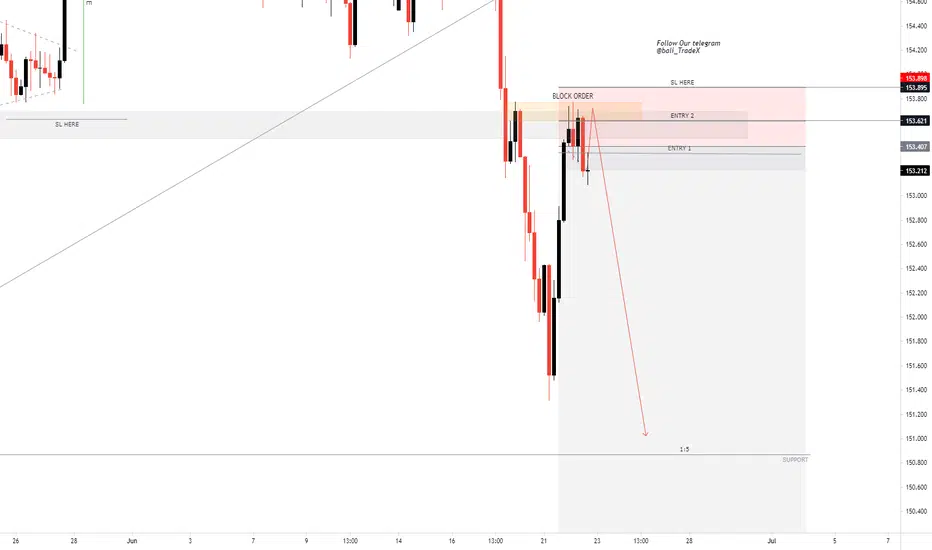
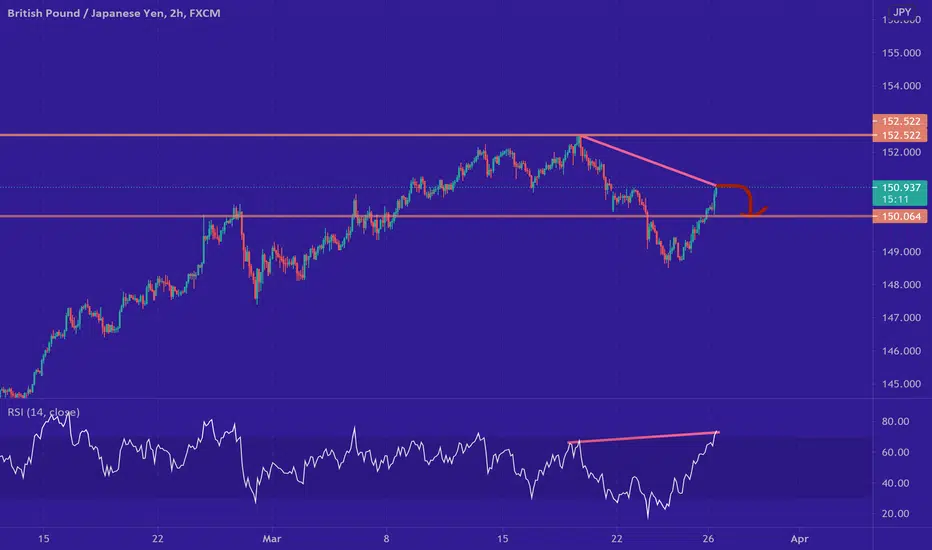
GBPJPY | Perspective for the new weekIt has been a while since I looked at this pair from a long term perspective but the temptation in the present contraction in the market can not be resisted as I identify a trading opportunity building up for an explosion!
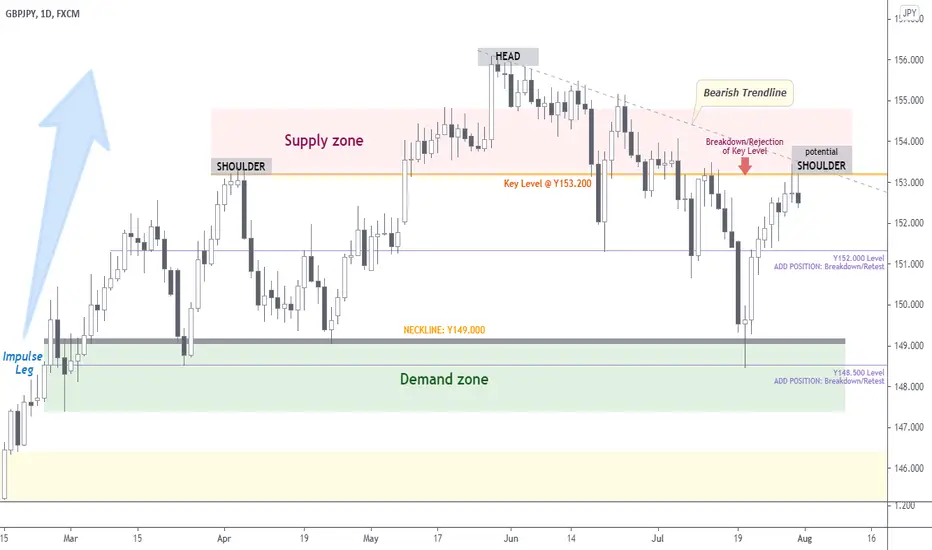
The British pound rallied from the Demand zone during the course of the last two weeks but since the 9th of July 2021, I have noticed that the buyers appear to be struggling to break above Key level @ Y153.200 area to confirm rally continuation. The appearance of a shooting star on the last trading day (Friday, 30th July 2021) expresses another sharp rejection of this level with a potential to transform into a Head and Shoulder pattern thereby signalling a Bearish perspective to this pair for me in the coming week(s).
It is worthy to note that there is a general notion that the Japanese Yen is still considered to be a “safety currency”.
Tendency: Downtrend (Bearish)
Structure: Trendline | Supply & Demand | Reversal pattern (Head & Shoulder)
Observation: i. Since mid-March 2021, we have witnessed a surge in the value of the Pound over the Yen which hit a peak of Y156.200 after which the price continued to find lower lows.
ii. Multiple rejections of Key level @ Y153.200 gives further significance to the strength of sellers at this juncture in the market.
iii. Head and Shoulder: A baseline with three peaks (the outside two is expected to be close in height and the middle is highest). The completion of this pattern will signal with a degree of accuracy that the prevailing uptrend is nearing its end.
iv. Even as we await completion of Head & Shoulder, selling potentials exist below the Key level @ Y153.200 with potential to add position at Breakdown/retest of Y152.000 level.
v. The completion of a bullish-to-bearish trend reversal is confirmed as soon as the price breaks down the Neckline @ Y149.000 (Demand zone) - another window to add a position.
vi. CAUTION: Considering the Bullish perspective from a long term scale, we might see price do a correction into 61.8/78.6% retracement of Impulse Leg (see weekly chart) to incite rally continuation. However, should price breakout/reset Key level @ Y153.200 and Bearish Trendline our perspective shall shift to a rally continuation... Trade consciously!😊
Trading plan: SELL confirmation with a minimum potential profit of 500 pips.
Risk/Reward : 1:5
Potential Duration: 10 to 20days
NB: This speculation might be considered to make individual decisions on the lower timeframe.
Watch this space for updates as price action is been monitored.
Risk Disclaimer:
Margin trading in the foreign exchange market (including commodity trading, CFDs, stocks etc.) has a high risk and is not suitable for all investors. The content of this speculation (including all data) is organized and published by me for the sole purpose of education and assistance in making independent investment decisions. All information herein is for your reference only and I take no responsibility.
You are hereby advised to carefully consider your investment experience, financial situation, investment objective, risk tolerance level, and consult your independent financial adviser as to the suitability of your situation prior to making any investment.
I do not guarantee its accuracy and is not liable for any loss or damage which may result directly or indirectly from such content or the receipt of any instruction or notification therewith.
Past performance is not necessarily indicative of future results.
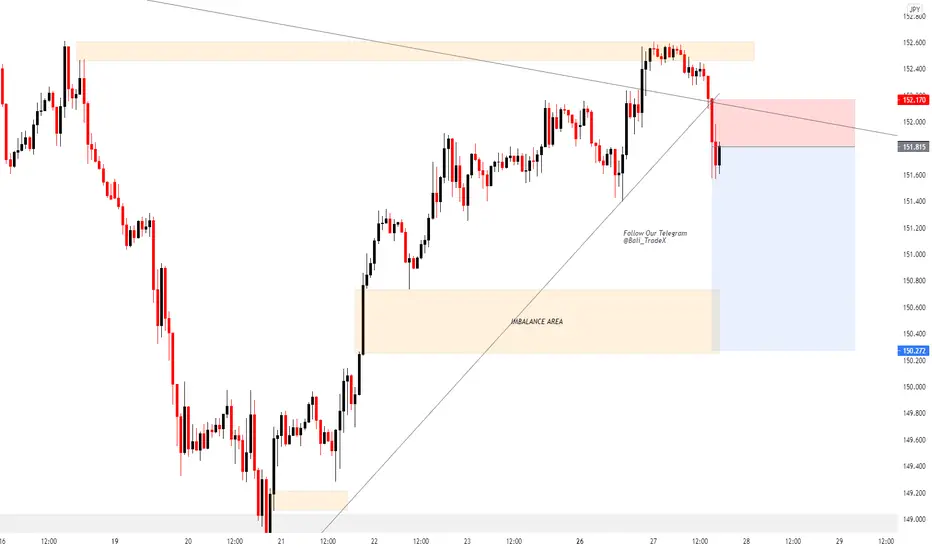
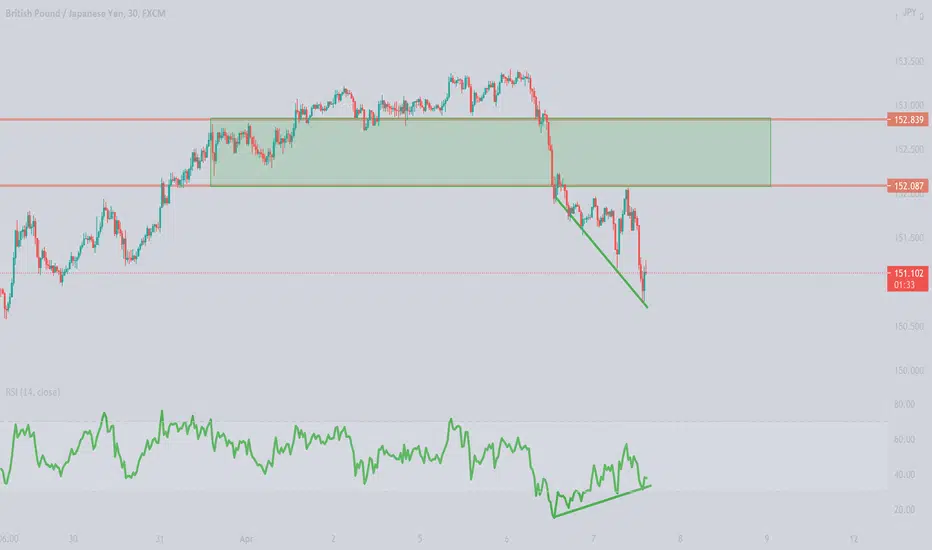
GBPJPY: SIGNAL FOR TRADEprice has been retest and have confirmation time to sell now
my target 100 PIPS +
good luck
GBPJPY: TRADING SIGNAL (Continue The Trend)GBPJPY still short trend, time to continue the trend.
Here is my entry position

GBPJPY: Still Continue the trendAs my previous prediction run as welll.
To continue the chart on this week. GJ create liltle correction still try reach the resistance.
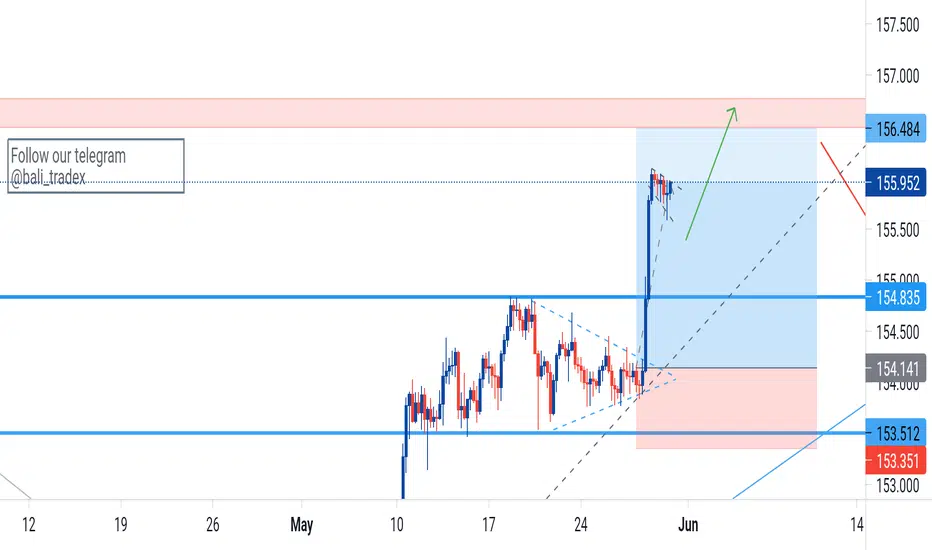
GBPJPYAs i said last weeks ...As I said GJ he climbed to Fibonacci 786 he broke in a few hours and closed above the 153,500 and even far over ...
This week I will wait for a retracement to the area 153,500 and there ... I think GJ will test the area 155.500-156,000
THIS WEEK...as I said last weeks GJ has reached 155,600
NOW...If we make a parallel between the chart on a week and one month because the month of May closes we can see that GJ has reached the trend line formed for 1 month and 1 week and from here I expect a withdrawal movement of at least 700-1000 pips if it closes the month below 155,600 ... even if GJ will go up maybe 40-50 pips this week.
I want to mention that the trend line formed by GJ for 1 month is the most perfect trend line we have ever drawn and I expect it not to be exceeded at all ...
NOTE: Please, give a LIKE if you find this idea useful!
GREAT ATTENTION:
*This information is not a Financial Advice.
Gbp/Jpy : Eyeing 157 handle Feb 2018 High ? As of now price is consolidating in a 100 pip range (153.50-154.65) , Speculative sentiment index is around 35% and trend is strong on higher time frames indicating the test of 2018 high around 157 handle which stands as the major resistance / Top.
Trend : Up
Signal : Long Scalp ( 153.50-154.65 range)
Positional trade # 1: Long above 151.70 ( EMA 50)
Stop Loss : 150.50
Target : 157 handle
Positional Pending trade #2 : Sell limit @ 156.70-157.30
Stop Loss : 158.50
Target : Open

GBPJPY SELL ON DIPSHI FRIEND
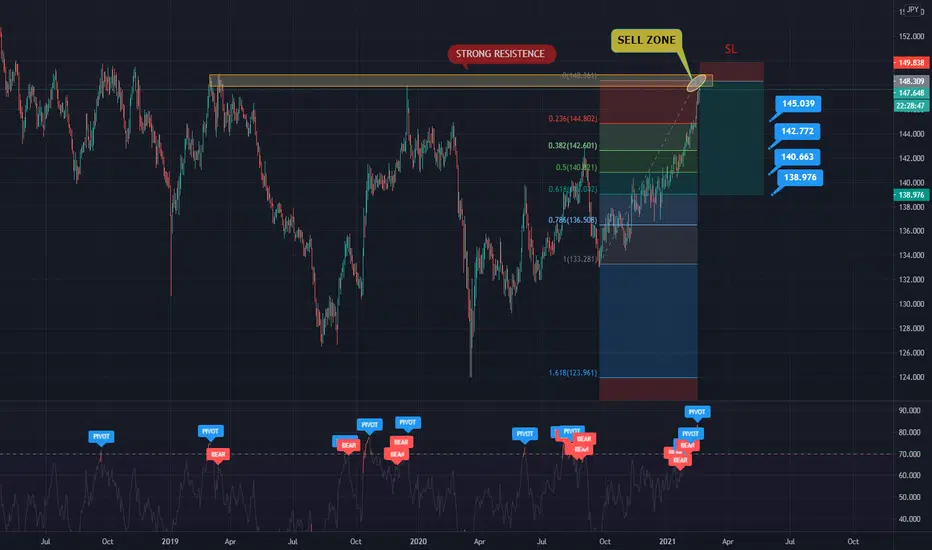
as i can see this pair is moving toward a strong historical resistance zone AND SHOW US A FAKE BREAKOUT and trading in resistance zone
as we are getting ready to sell this pair with a very low risk and looking for a higher rewards from given support zone
Friends Push like and comments It help alote to promote the idea to other peoples
Follow us for more updates
have a deep look on given GBPJPY trade made ALOTE OF PIPS in our previous analysis
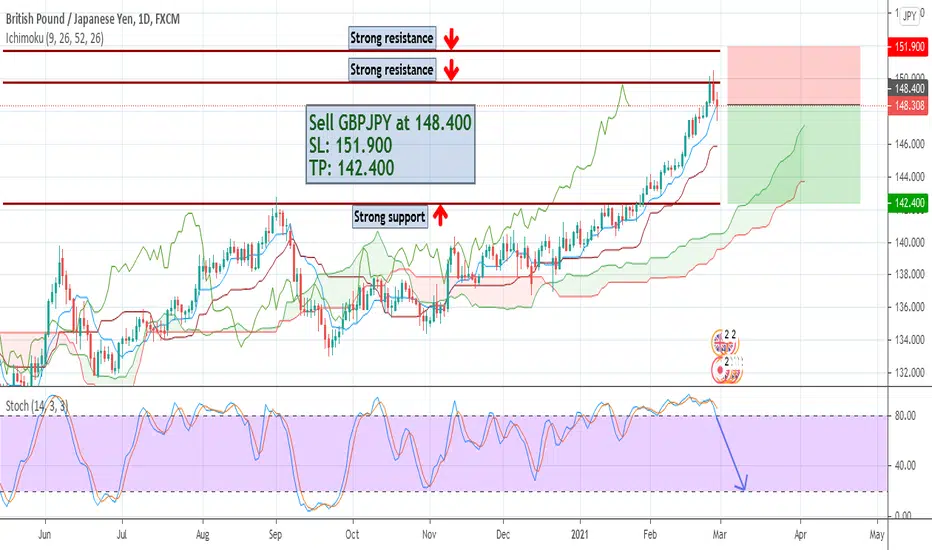
GBPJPY SELL FROM KEY LEVELHI FRIEND
as i can see this pair is moving toward a strong historical resistance zone
as we are getting ready to sell this pair with a very low risk and looking for a higher rewards from given support zone
Friends Push like and comments It help alote to promote the idea to other peoples
Follow us for more updates
have a deep look on given GBPJPY trade made ALOTE OF PIPS in our previous analysis
GBPJPY SELLAS i can see this pair is rejecting from top of the channel and now it is going to dip more
so we are selling this pair now with a small risk and looking for higher rewards
Friends push like and comments we love an appreciate that
FOLLOW US FOR MORE UPDATES
GBPJPY BUY FROM SUPPORT ZONEas i can see this pair has break a strong zone which now turn as a support
so we are planing to buying this pair from support zone till design new TP
Friend push like and comment we love ur support
Follow us for more updates
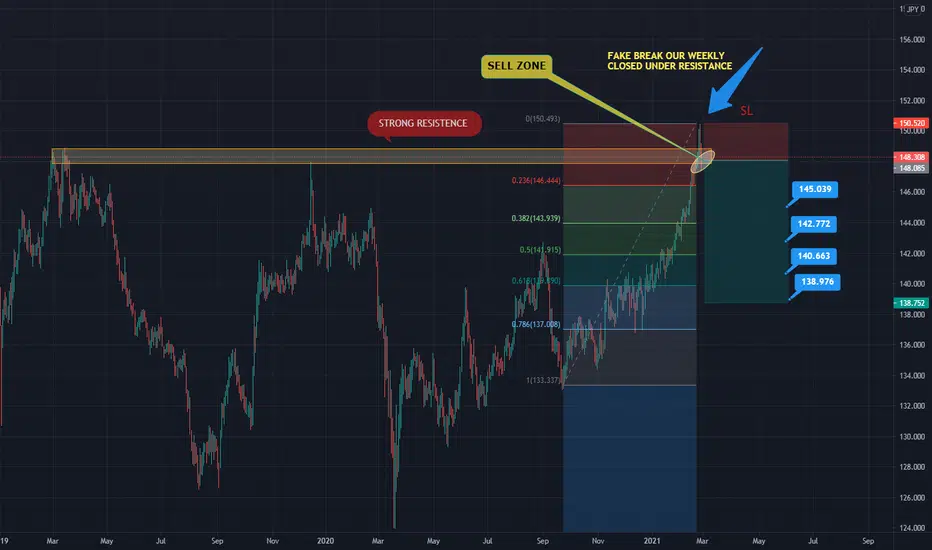
GBPJPY SELL ON DIPS !As i can see this pair make a fake break out and Thursday it was closed under a resistances when Bexit deal was announced
Bexit deal is done but UK is leaving EU which is fundamentally not good for UK economy and we are selling this pair with a a small risk
and looking for higher rewards Friend push like and support the idea it will help us and alote of other traders
we appreciate ur comments and ur love is a like Follow us for more updates
GBPJPY SELL WITH NO EMOTIONS !!!as we can see weakness in GBP and this pair is @ great entry with a very small risk & higher rewards
friends push like and comment follow us for more updates stay tune