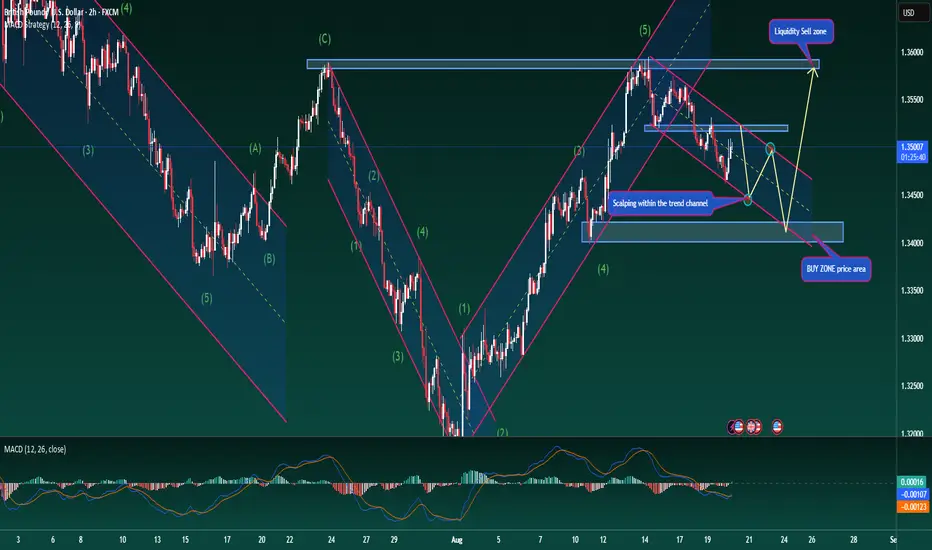
GBPUSD Trend Update – Following the ChannelGBPUSD Trend Update – Following the Channel
The GBPUSD pair is currently moving within a well-defined descending channel. Price behaviour in currency pairs often shows more sustainability, as their values are consistently balanced by fiscal and monetary policies. This makes the present structure an important reference for the coming sessions.
On the H1 timeframe, the 1.3400 level appears to be the next key area to watch. Price may either start a new bullish leg from here or at least stage a meaningful corrective bounce within the channel. This area could also serve as a potential long-term buying zone for GBPUSD.
Until then, traders can take advantage of intraday reactions when price retests the descending trendline near 1.3490 and 1.3445. These levels provide opportunities for short-term scalping setups, with profit targets of around 30–40 pips.
Meanwhile, the 1.3600 region stands as a solid resistance zone. If the long scenario plays out, this would be an important target for longs, or alternatively, a strong level to consider short positions for those looking at longer-term setups.
Overall, the channel is holding well and offering clear structure for trade planning. Traders can use this framework to align entries with market behaviour.
#GBPUSD #Forex #TechnicalAnalysis #PriceAction #Trendline #ChannelTrading #Scalping #SwingTrading
Gbpusd-trading
Sell to Buy ModelTho the sell hit sl but still went according to plan. Still Bullish and holding this buy for NFP happening tomorrow

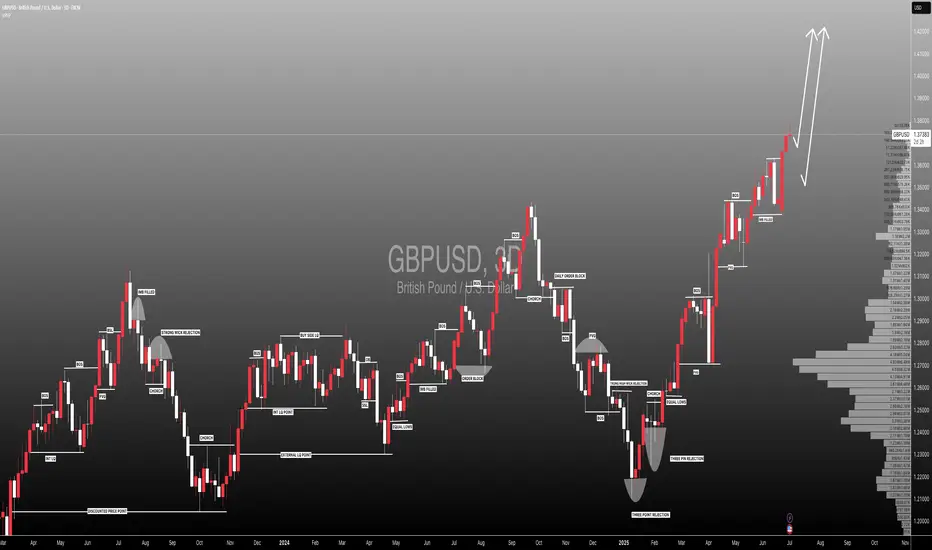
#GBPUSD: Detailed View Of Next Possible Price Move! GBPUSD exhibited a favourable movement after rejecting a pivotal level previously identified. We anticipate a smooth upward trajectory, potentially reaching approximately 1.45. Conversely, the US Dollar is on the brink of collapse around 90, which will directly propel the price into our take-profit range.
During GBPUSD trading, it is imperative to adhere to precise risk management principles. Significant news is scheduled to be released later this week.
We kindly request your support by liking, commenting, and sharing this idea.
Team Setupsfx_
GBPUSD SHORTThe GBP/USD pair has been showing signs of exhaustion after a recent rally, and I'm looking for a potential pullback to enter a short position.
While GBP/USD has shown resilience, the technical and fundamental setup suggests a potential short opportunity on a pullback. Confirmation through price action (e.g., bearish engulfing patterns, break of structure) will be crucial before entering.

The Calm Before the Storm: All Eyes on UK CPI & Central BanksGBPUSD 17/06 – The Calm Before the Storm: All Eyes on UK CPI & Central Banks
The GBPUSD pair is coiling in a tight range near the mid-1.3500s as traders brace for two high-impact events: UK CPI data on Wednesday and interest rate decisions from both the Fed and BoE this week. Price remains supported above the 200 EMA and is compressing within a symmetrical triangle – typically a precursor to a major breakout.
📊 Macro & Fundamental Outlook
🔹 Federal Reserve (FOMC): Expected to hold rates steady, but growing anticipation of a dovish tilt toward September is weighing slightly on the USD.
🔹 Bank of England (BoE): Markets are pricing in deeper rate cuts following recent UK GDP weakness, pressuring the GBP in the short term.
🔹 Geopolitical Risks: Rising Middle East tensions are fuelling demand for USD as a safe haven, reinforcing its strength ahead of data events.
📝 Bottom Line: The CPI release could be the first trigger to shift GBPUSD’s current consolidation. A hot inflation print might push GBP higher; a miss could fuel further downside.
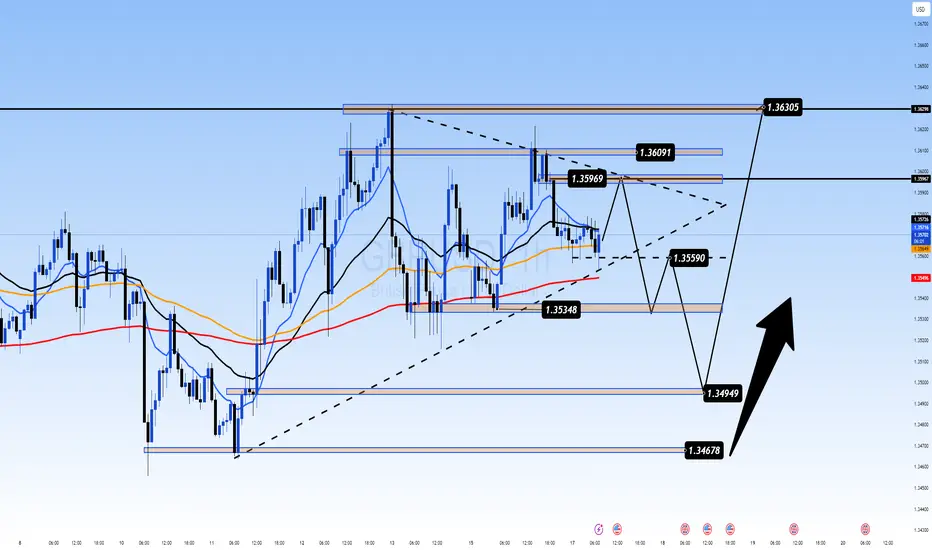
🔧 Technical Analysis (H1 Chart)
Price is ranging between 1.3535 (support) and 1.3609 (resistance)
EMAs 13/34 crossing below EMA 89 → signal of potential bearish continuation
Uptrend line from 1.3467 is still intact and acting as dynamic support
Break below 1.3559 may lead to a move toward 1.3495 and 1.3467
A confirmed breakout above 1.3609 opens the door to 1.3630+
🎯 Trade Scenarios
Scenario 1 – Buy from Trendline Support
Buy Zone: 1.3495 – 1.3467
Stop Loss: 1.3440
Targets: 1.3535 → 1.3559 → 1.3596 → 1.3630
🟢 Best setup if price prints a bullish engulfing or hammer candle on key support + UK CPI surprise.
Scenario 2 – Sell on Resistance Rejection
Sell Zone: 1.3609 – 1.3630
Stop Loss: 1.3660
Targets: 1.3590 → 1.3559 → 1.3535 → 1.3495
🔴 Only valid with strong rejection signals + softer UK data or hawkish Fed tone.
💡 Market Sentiment
Retail traders are trapped in a waiting zone – expecting a breakout
Institutions may push price into one direction pre-data to collect liquidity
Risk appetite is fragile, and traders are cautious ahead of back-to-back central bank announcements
📌 Final Thoughts
GBPUSD is preparing for volatility. Instead of chasing moves, let the market come to your key zones and react with discipline. The 1.3467–1.3495 support area could be crucial for the next directional move.
Stay patient. Wait for confirmation. Respect your risk.
GBPUSD – Sterling Slips Amid Geopolitical Risk |GBPUSD – Sterling Slips Amid Geopolitical Risk | Will Support Hold for a Bounce?
🌍 Macro & Geopolitical Overview
The British Pound (GBP) is under pressure as risk sentiment deteriorates following a sharp escalation between Israel and Iran.
Israel launched a major military campaign, striking dozens of nuclear and military facilities in northeastern Tehran.
PM Netanyahu announced the start of "Operation Rising Lion", aimed at eliminating the Iranian nuclear threat.
US President Donald Trump voiced support, stating that Iran “must never have a nuclear bomb.”
Investors reacted by fleeing to safe-haven assets, pushing the US Dollar (DXY) from 97.60 to nearly 98.30.
Meanwhile, next week’s Bank of England (BoE) and Federal Reserve meetings are in focus. Both are expected to hold rates steady, but weak UK economic data may pressure the BoE to adopt a more cautious or dovish tone.
📉 Technical Analysis – H1 Chart
🔸 Trend Structure
GBPUSD broke down from its recent high at 1.36288 and is now approaching key support between 1.35350 and 1.34957.
As long as 1.3495 holds, the move appears to be a technical correction, not a reversal.
🔸 Fibonacci & Moving Averages
Current price sits near Fibonacci 0.236 retracement of the recent swing.
Price is trading below the EMA 13 & 34, but EMA 200 near 1.353x still acts as potential support.
🔸 Resistance to Watch
The next upside target sits at 1.3588, followed by the previous high at 1.3628.
🧠 Market Sentiment
Risk aversion is dominating due to geopolitical headlines.
GBP is vulnerable as a risk-sensitive currency.
However, if tensions ease and central bank decisions next week come in line with expectations, GBP could rebound from its currently discounted levels.
🎯 Trade Setup Suggestion
✅ BUY ZONE: 1.35350 – 1.34957
Stop-Loss: 1.3460
Take-Profit Targets: 1.3588 → 1.3628
Enter only on bullish price action confirmation around the support zone.
✅ Conclusion
GBPUSD is trading under geopolitical stress, but the technical setup around 1.3495 – 1.3535 offers a potential bounce zone. A short-term recovery could unfold if sentiment stabilizes and central banks maintain the expected policy stance.

GBPUSD – Is the Recovery Losing Steam? GBPUSD – Is the Recovery Losing Steam? Watch for Technical Pullback Ahead of NFP
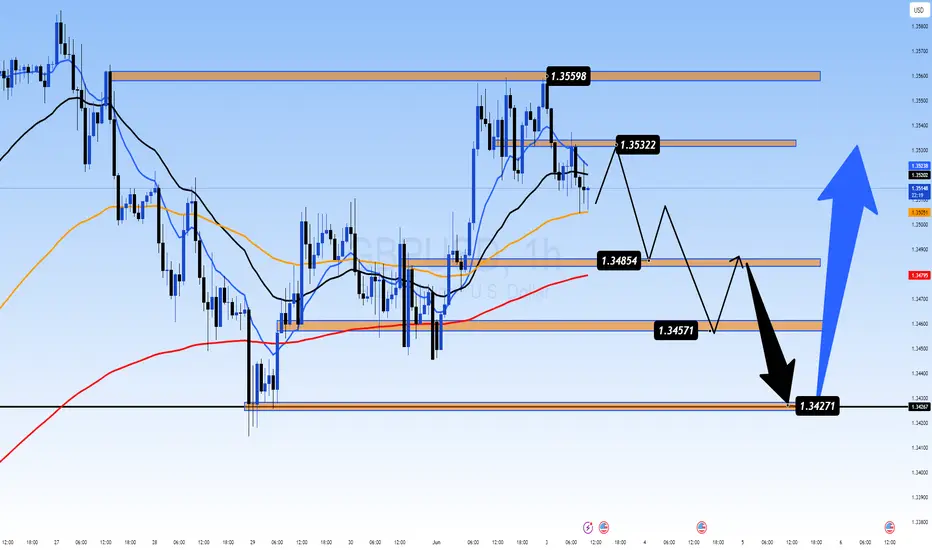
The GBPUSD pair has recently rebounded impressively from the 1.3427 key support zone, reflecting short-term USD weakness and growing speculation of rate cuts by the Fed. However, after the strong bullish move, the market is now showing signs of exhaustion and potential profit-taking—especially with high-impact US employment data just around the corner.
🔍 Macro & Fundamental Overview:
United States: All eyes are on this week’s JOLTS and Non-Farm Payrolls (NFP) reports. Weak jobs data could strengthen the case for rate cuts by the Fed in Q3, weighing on the US Dollar. On the flip side, a solid print would revive “higher for longer” rate expectations and likely support USD strength.
United Kingdom: Although inflation remains above the Bank of England’s 2% target, political uncertainty ahead of July’s general election may keep GBP on the defensive, especially if BoE signals a dovish turn.
Bond Yield Spread (UK vs US): A widening spread in favor of the USD is exerting downward pressure on GBPUSD in the medium term.
📈 Technical Outlook (H1 Chart):
Structure: Price has formed a double-top pattern at 1.35598 and 1.35322, with multiple rejections—signaling a weakening bullish momentum after a sustained rally.
EMA 13 – 34 – 89 – 200 Setup: Price is currently testing the EMA89 zone (~1.34854). A clean break below this moving average could accelerate the downside correction.
FVG Zone (Liquidity Pool): The 1.3427 – 1.3457 area offers a potential liquidity sweep and may serve as a springboard for the next bullish leg.
📊 Trade Scenarios:
🔻 Short-Term SELL SCALP:
Entry: 1.3532 – 1.3545
Stop Loss: 1.3565
Take Profit: 1.3485 → 1.3457 → 1.3427
→ Ideal if price fails to hold above recent highs and forms bearish rejection candles.
🔵 BUY ZONE Setup:
Entry: 1.3427 – 1.3440
Stop Loss: 1.3400
Take Profit: 1.3475 → 1.3505 → 1.3535 → 1.3555
→ High-probability entry if price reacts positively to the FVG zone and maintains bullish structure.
📌 Final Thoughts:
GBPUSD is currently in a delicate zone where both technical and macro forces are converging. While the broader trend remains bullish, momentum is slowing. With critical US jobs data due, traders should stay cautious and rely on clear confirmations around key price levels. Maintain strict risk management and look for liquidity-driven moves around FVG zones.
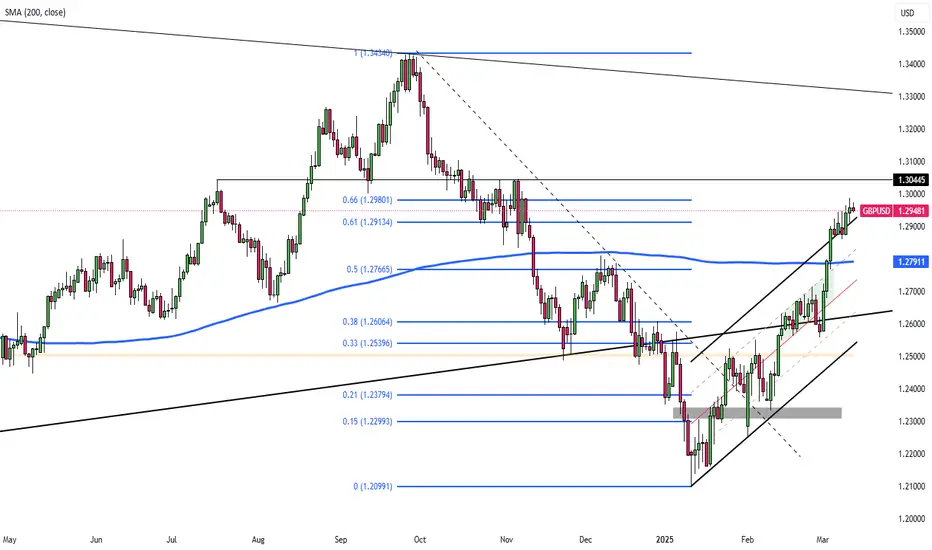
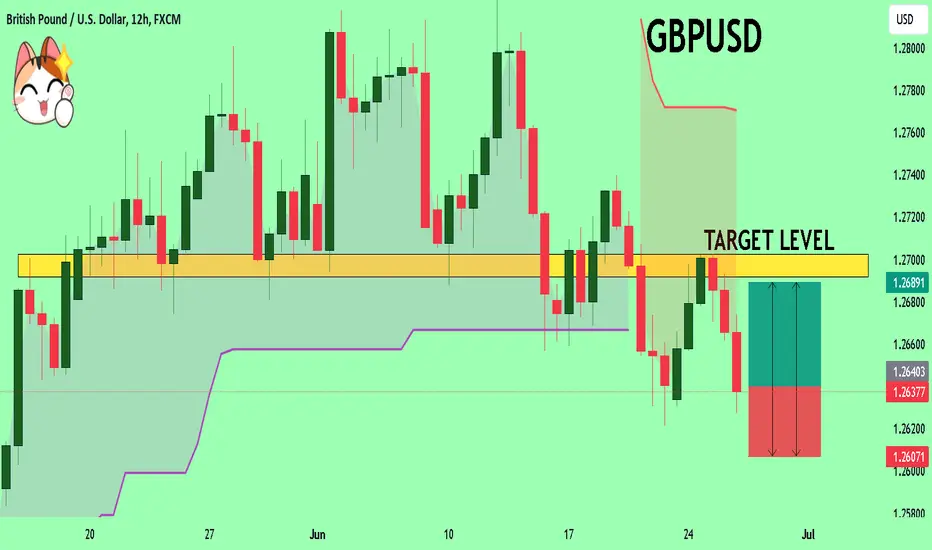
GBP/USD Climbs to 1.2960, Dollar Under PressureGBP/USD trades around 1.2960 in Thursday’s Asian session, extending gains for a third day as the US Dollar weakens with recession fears linked to Trump’s policies.
The dollar faces further pressure after February inflation slowed more than expected, raising speculation of an earlier Fed rate cut. Headline inflation fell from 0.5% to 0.2% monthly and from 3.0% to 2.8% yearly, while core inflation dropped to 0.2% monthly and 3.1% yearly. Markets now await US PPI and jobless claims data for further economic signals.
If GBP/USD breaks above 1.2980, the next resistance levels are 1.3050 and 1.3100. On the downside, support stands at 1.2860, with further levels at 1.2760 and 1.2660 if selling pressure increases.
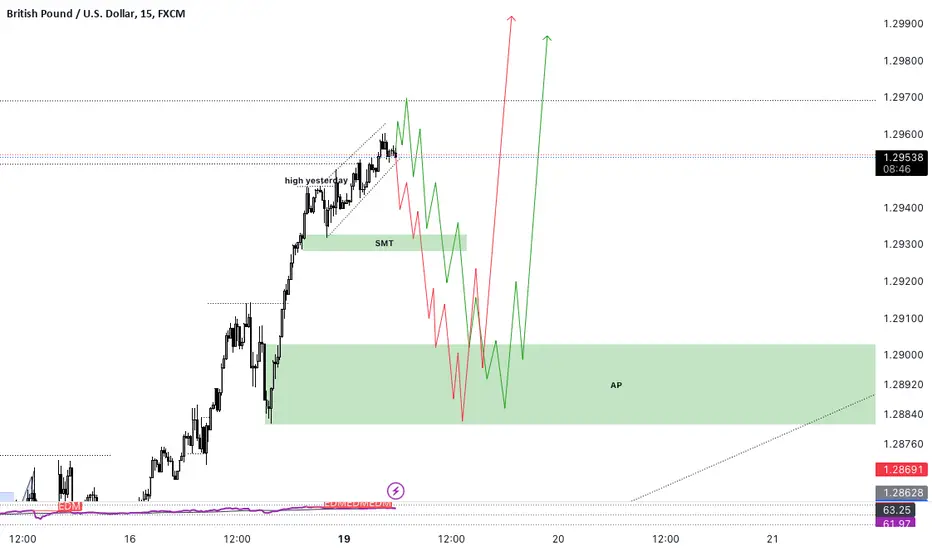
GBP/USD - Institutional Backed Long Setup📌 Trade Execution & Technicals
Pair: GBP/USD
Timeframe: 15M
Trade Type: Long Position
Entry: 1.2816 – Price rejected key Fibonacci retracement level (0.62 Fib) after a liquidity sweep
Stop Loss: Below 1.2800
Take Profit Levels:
TP1: 1.2862 (-0.27 Fib extension) ✅ Target
TP2: 1.2883 (-0.62 Fib extension) ✅ Target
Technical Confluence:
Fibonacci Retracement Levels: Price bounced off the 0.62 retracement (1.2816)
Market Structure: Higher low formation confirmed bullish continuation
Institutional Liquidity Grab: Price swept sell-side liquidity before reversing bullish
📊 Trade Outcome
✅ High-Probability Long Setup
Both TP1 & TP2 levels hit with strong bullish momentum
Risk-to-Reward Ratio (RRR) > 1:3
Price action confirmed bullish institutional positioning
🌍 High-Impact News That Influenced GBP/USD
UK S&P Global Services PMI (Actual: 51.0 vs Forecast: 51.1) – Slightly weaker, but still expansionary
US ADP National Employment (77K vs Forecast: 140K) – Weaker than expected, USD pressured
BoE Treasury Select Hearing (Hawkish Bias) – Supporting GBP strength
US ISM Manufacturing Prices & Business Activity Upcoming – Expected to increase USD volatility
💡 News Summary:
Weaker-than-expected US jobs data pressured the USD, providing momentum for GBP/USD upside
GBP remained resilient despite mixed PMI data, benefiting from USD weakness
📈 Volatility & Liquidity Insights
🔍 Prime Market Terminal Key Data:
GBP/USD Average True Range (ATR):
1-week ATR: 0.81%
1-month ATR: 0.86%
Institutional Liquidity Insights:
High liquidity buildup in the 1.2800-1.2820 range, acting as support
Strong order flow pushing GBP/USD higher post-US employment data release
🏦 Institutional Positioning & Market Flow
📊 Commitment of Traders (COT) Data & Smart Money Insights:
Dealer Positioning:
GBP Net Positioning: +56,707 contracts (Bullish institutional sentiment)
USD Net Positioning: -11,542 contracts (Bearish outlook on USD)
Open Interest & Retail Sentiment:
Retail Short Bias: 72% Short, 28% Long – Potential short squeeze
Smart Money Accumulation Zone: 1.2800-1.2820
📌 Conclusion
🔹 Why This Trade Worked:
✔ Liquidity Grab Below 1.2816 Before Reversal
✔ Institutional Positioning Confirmed Bullish Momentum
✔ Weaker US Jobs Data Weighed on USD, Pushing GBP/USD Higher
🚀 Next Steps:
Monitoring 1.2860 for continuation towards 1.2900 key level
Watching upcoming US ISM data for potential volatility spike
🔥 What’s your outlook on GBP/USD? Comment your thoughts below!

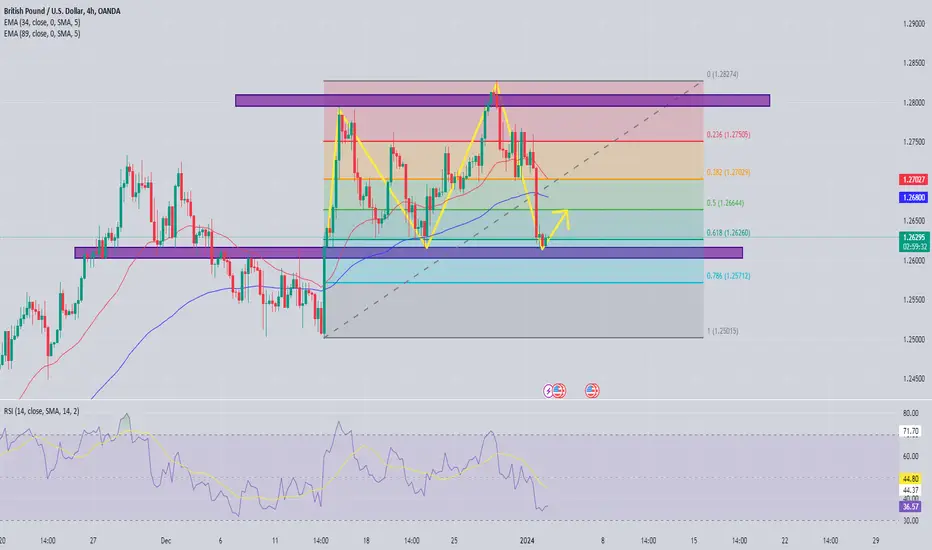
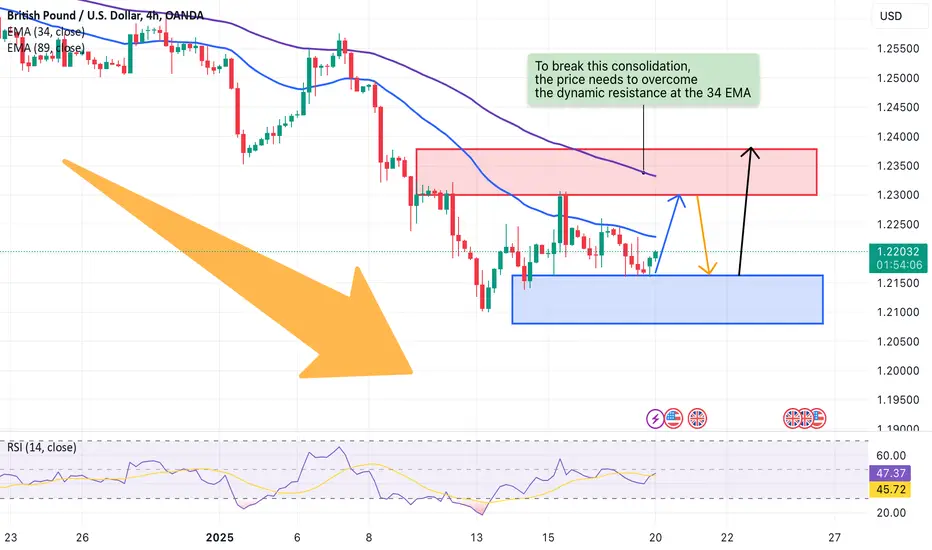
GBP/USD: Consolidation at Key SupportLooking at the 4-hour chart of GBP/USD, I see that the pair is currently trading around 1.2202, with signs of consolidation at a strong support zone. The 34 EMA and 89 EMA are still sloping down, indicating that the bearish bias is still dominant. However, the gap between the price and the EMA is narrowing, which could be a sign that the bearish pressure is waning.
In addition, the pair has successfully tested the 1.2170 support zone in recent sessions, creating a solid foundation for a short-term recovery. To break this consolidation, the price needs to overcome the dynamic resistance at the 34 EMA, located around 1.2230. If this happens, the next target will be the 1.2300 zone – a strong psychological resistance.
Where is GBPUSD Heading? FX:GBPUSD To make things clear! We are in a Bullish Long Term Trend, under which were are going through a Bearish Retest. Buyers are eager for a reversal, buying at every possible retest and failing. They are not back from the Party from last week.
In the mean time, I would short now, it has a side to it. A Little risk is not gonna hurt while it can reward big. At the max it can cost a BE.
Pending Order in place in case if the reversal happens with the Event.
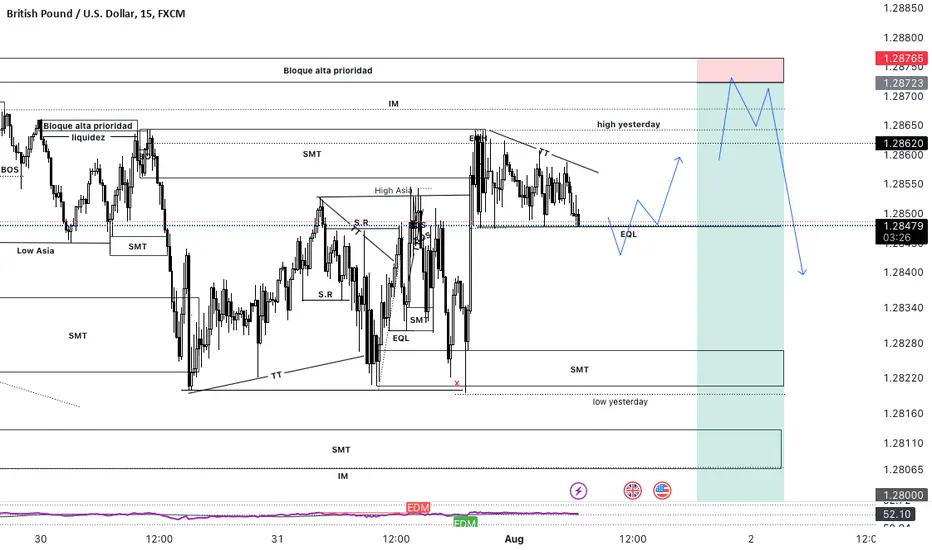
GBPUSDGood morning traders, new week sale of new opportunities, I hope you have a week full of many profits. Today without any fundamentals in the middle we can see that the price can give very interesting entries both in sales in the London day and some succulent purchases for the NY day. Remember that we react, we do not predict.
GBPUSDnew day new opportunity, yesterday the price met my expectation, today I will try to take advantage of the gasoline of the fundamentals to join the movement due to all the liquidity that is above and I will be looking for longs throughout the day. I wish you good luck and many benefits

GBPUSDIn general terms, I can see that the price is in a bearish channel, accumulating a large part of the supply and inducing it to continue selling. I stick with my plan to sell until my psychological point of 1.27772 since in a week that is my breakout of the BOS. Once I get that liquidity point I will be very attentive since it is a greater induction therefore I will take advantage of all that offer and I will join the sharks to buy and take my part. But since the market is present today, it is giving me a beautiful sales opportunity.
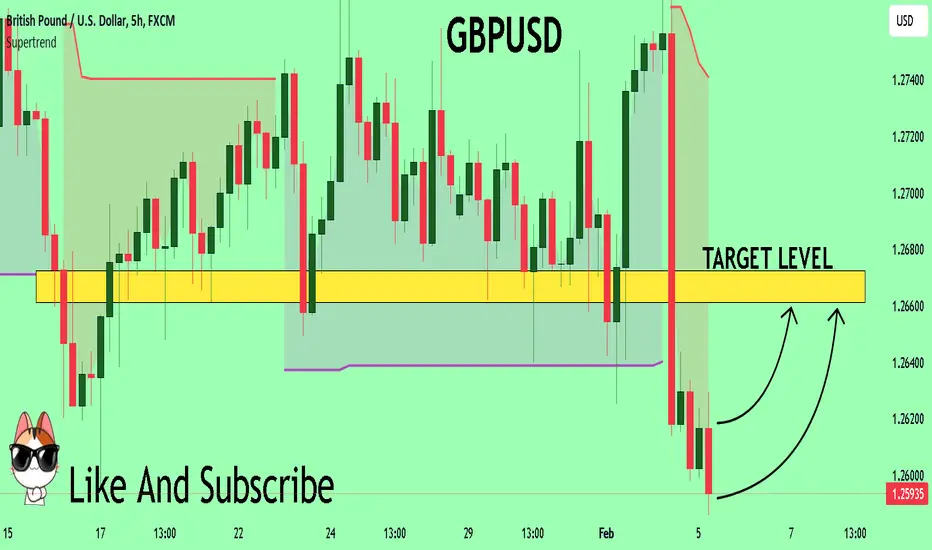
GBPUSD Expected Growth! BUY!
My dear friends,
My technical analysis for GBPUSD is below:
The market is trading on 1.2639 pivot level.
Bias - Bullish
Technical Indicators: Both Super Trend & Pivot HL indicate a highly probable Bullish continuation.
Target - 1.2691
Recommended Stop Loss - 1.2607
About Used Indicators:
A pivot point is a technical analysis indicator, or calculations, used to determine the overall trend of the market over different time frames.
———————————
WISH YOU ALL LUCK
GBPUSD NEXT MOVE POSSIBLE Gbpusd Was Under This Pattern Now Successfully Breakout We Have Buying Opportunity Around 1.26500 On Retracement And Take Hold UpTo 1.28500 Note It's Not A Signal After Confirmation Signals Will Be Available Stay Tuned For More Updates

Shorting on Gbpusd or Nzdusd if USD is still to strongerHello fellow traders , my regular and new friends!
Welcome and thanks for dropping by my post.
If usd came out stronger this coming week, i will be focusing on both Gbpusd and Nzdusd for shorts.Let's see!
Do check out my recorded video (in trading ideas) for the week to have more explanation in place.
Do Like and Boost if you have learnt something and enjoyed the content, thank you!
-- Get the right tools and an experienced Guide, you WILL navigate your way out of this "Dangerous Jungle"! --
GBPUSD Sellers In Panic! BUY!
My dear friends,
My technical analysis for GBPUSD is below:
The market is trading on 1.2591 pivot level.
Bias - Bullish
Technical Indicators: Both Super Trend & Pivot HL indicate a highly probable Bullish
continuation.
Target - 1.2661
About Used Indicators:
A pivot point is a technical analysis indicator, or calculations, used to determine the overall trend of the market over different time frames.
———————————
WISH YOU ALL LUCK
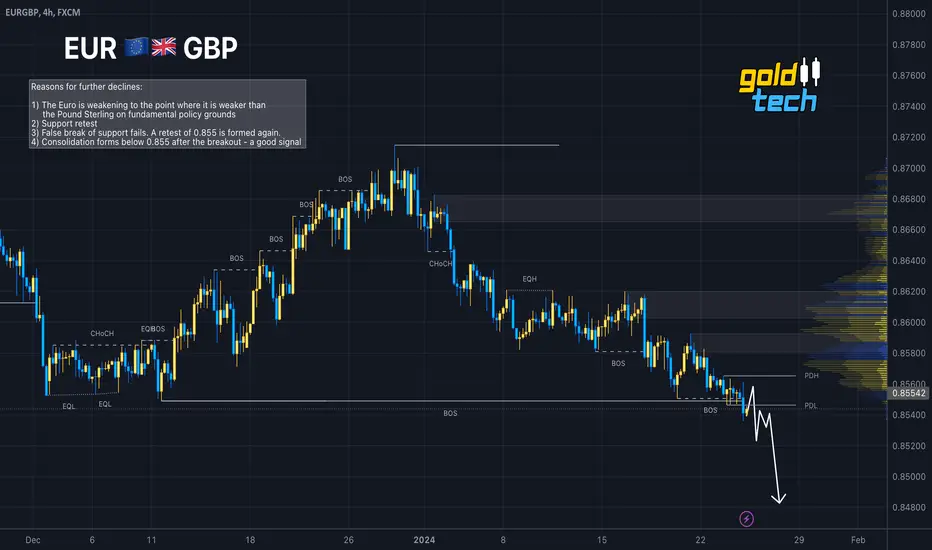
🇪🇺 EURGBP 🇬🇧 - Trend continuation after breaking 0.855EURGBP may continue its fall as the market breaks support after a retest. A weak market on the euro side could give way further. For now, it is worth waiting for consolidation below 0.855 to continue the fall. Overall, the global trend is changing and this opens bearish perspectives.
Reasons for further declines:
1) The Euro is weakening to the point where it is weaker than the Pound Sterling on fundamental policy grounds
2) Support retest
3) False break of support fails. A retest of 0.855 is formed again.
4) Consolidation forms below 0.855 after the breakout - a good signal
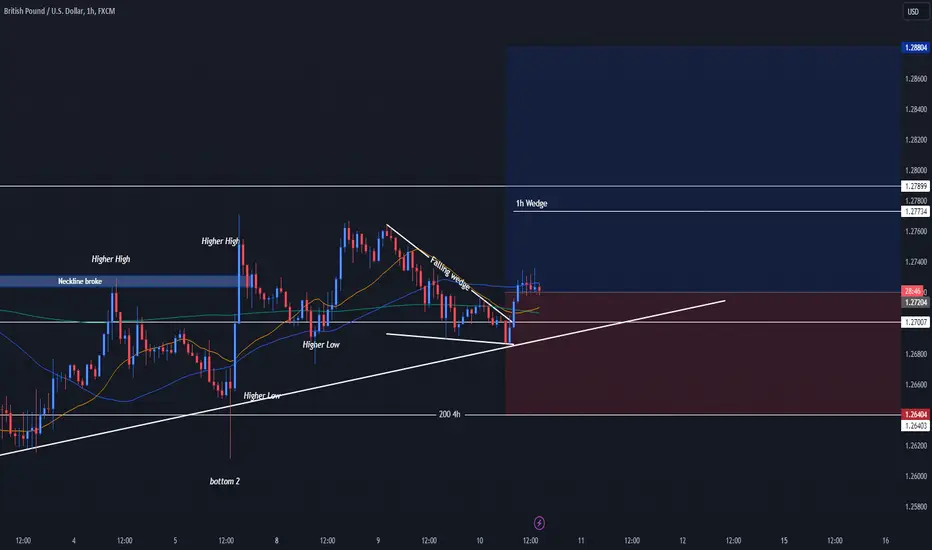
GBPUSD | COULD BE A GOOD BUYHey Traders 👋
Quick update on GBPUSD. Remember the trade we rolled out on Monday? It clocked in a cool 30+ pips before taking a bit of a breather. Looks like it's not done yet. I'm seeing a solid chance for a continued push upwards.
So, it's a new trade, but sticking with the same setup as before. The 1-hour chart shows a new wedge pattern and looking at institutional data GBP is gaining ground against the dollar, things are looking pretty upbeat for this setup. 🎯📈
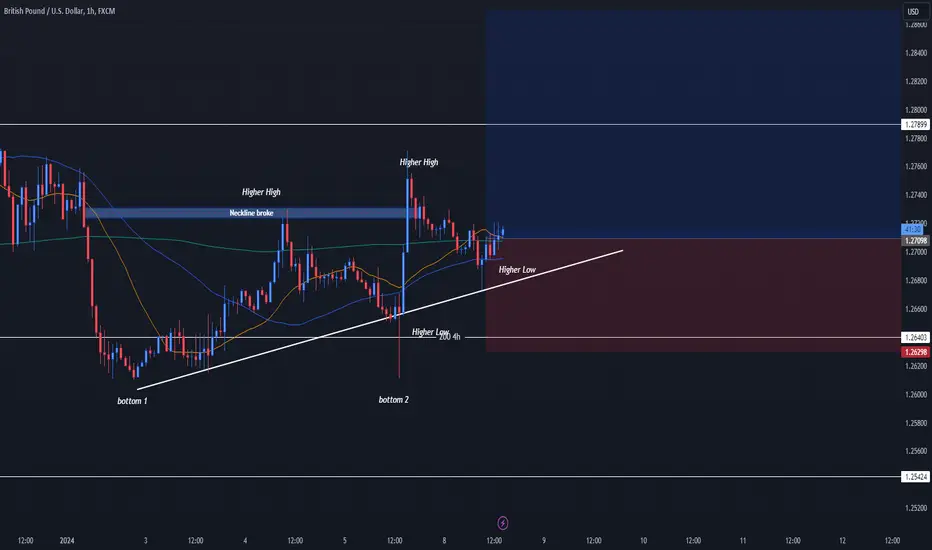
GBPUSD | I BELIEVE COULD BE A GOOD BUYHey Traders!
I'm currently eyeing GBPUSD as a solid buy opportunity. Here's why: we're seeing a clear uptrend, and importantly, it's just broken through a key monthly pivot point. What's more convincing is the formation of a 4-hour bullish engulfing candlestick pattern. Also, the 1-hour chart shows a double bottom that's successfully broken its neckline. After a brief pullback, it seems poised to retest its previous top levels.
Keep an eye on the 1.28000 mark. It's shaping up to be a strong resistance level, but if it's breached, we could be looking at some serious gains. However, always remember to manage your risks wisely. I'd suggest setting your first take profit target within the 20-40 pips range.
GBPUSD is trending upAfter a four-day consecutive correction from the high point of $2,088 on December 28th, gold prices saw a slight increase on Thursday, reaching above $2,050. This indicates that the correction signal for a larger uptrend still receives some support, as technical studies in the daily chart remain in the main bullish trend. Gold continues to benefit from the widespread expectation that the Fed will begin cutting interest rates in 2024, as well as signals suggesting a potential economic slowdown in the US this year.
However, due to the minutes of the meeting showing significant uncertainty about the prospect of a Fed rate cut, the expectations for an early rate cut in March have gradually diminished. This has created resistance to further upward movement in gold prices and made the downside risks more fragile.
Bulls need to break the key resistance between $2,052 and $2,058 to initiate new bullish momentum and achieve a stronger recovery. Breaking this range, bulls will face strong resistance at $2,063-$2,066 to strengthen the bullish structure and attempt to break above $2,100 again.
However, as the New York session progresses, a series of data releases have not supported this structure, increasing the risk of further downside for gold prices. In this context, the fragility of gold prices needs to adjust downward until testing the upward trend support at $2,009. In terms of trading strategy, it is recommended to go short at highs.
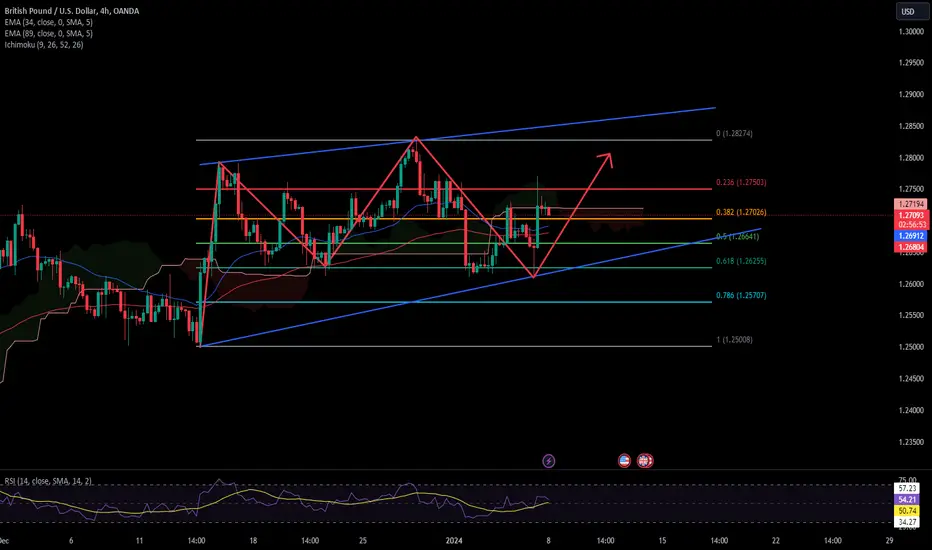
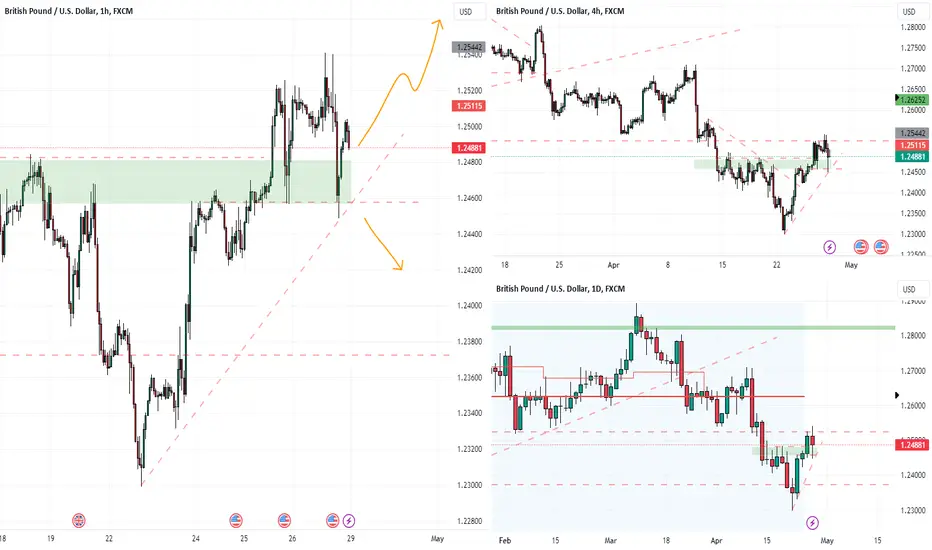
GBP/USD tends to increase when it meets supportThe GBPUSD has been forming an upward structure with higher highs after breaking above a key downtrend line in early November. Although the GBPUSD's uptrend came to a temporary halt at the four-month high level of 1.2826, the completion of the golden cross between the 50- and 200-day SMAs is expected to provide upside momentum.
However, during the European session on Tuesday, the GBPUSD fell sharply during the day as the USD rose sharply and formed a death cross downward structure in the 4H timeframe, potentially creating more uncertainty for the GBPUSD in the near term.
Now, we believe that as long as Wave 4 of the "upward impulse waves" structure has not been broken, the end of the "upward impulse waves" is still worth looking forward to.
Given that the short-term oscillators are continuing to provide cautiously positive signals, the bulls may try to eliminate the latest weakness and overcome the December resistance at the 1.2794 level. A break above this resistance could open the door to a four-month peak at 1.2826. If it fails to stay here, the GBPUSD could move towards the June high of 1.2847 until it reaches the 1.2900 level.
On the other hand, if the GBPUSD reverses lower, several previous support levels at 1.2642 and 1.2612 could now become the initial line of defense. A break below that bottom could see the price fall to recent support at 1.2611, or even lower, with upward Wave 4 1.2500 likely to provide a correction.
Overall, risks remain cautiously tilted to the upside in the near term, even though the GBPUSD rally appears to be losing its momentum. To change this situation, the price cannot go below a series of key supports or the uptrend will be reversed. It is recommended to buy the dips.