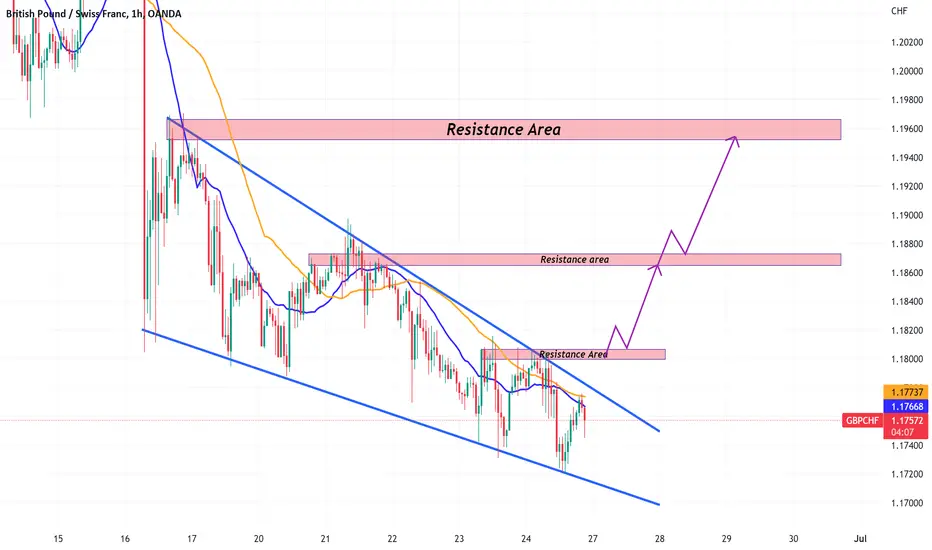
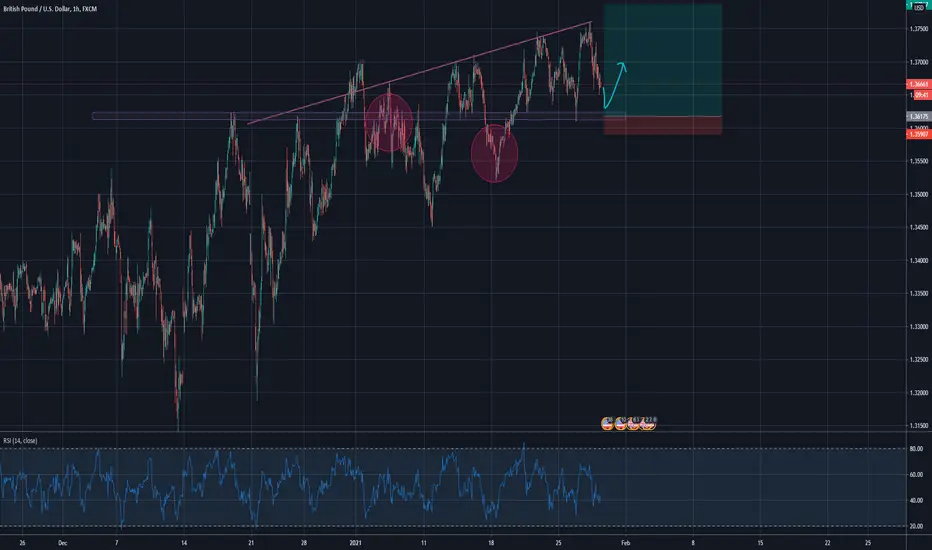
GBP/CHF forming a bullish patternOANDA:GBPCHF is forming a bullish pattern. I am waiting for confirmation. There is also some data for GBP on Wednesday. Lets see!
Gbpusd-trading
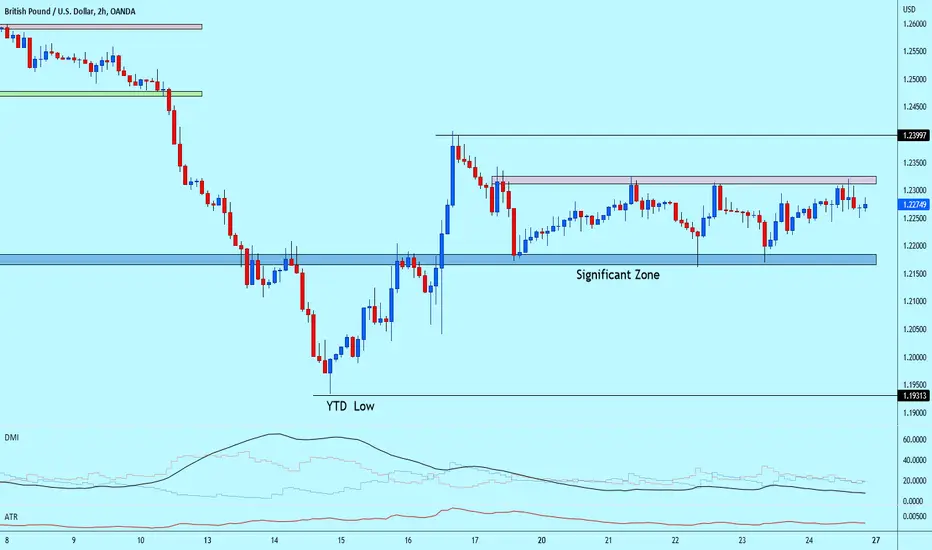
Not a great situation to trade - GBP/USD Forex.DocThere are not many opportunities to trade this pair. I noticed 1.23200 resistance zone, so its possible to see move down, but moves are very slow and price is consolidating.
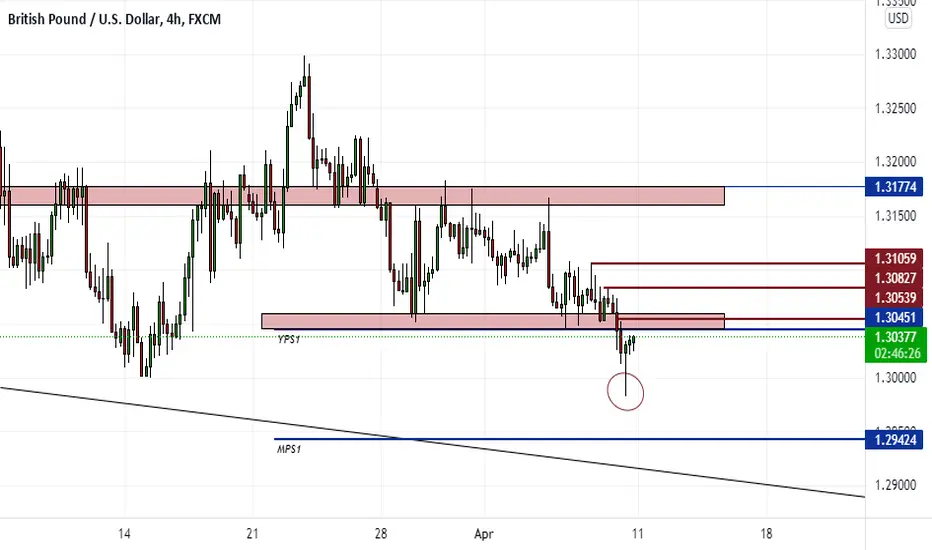
GBP/USD - 4hrHello guys. Here we have the GBP / USD chart. This is a 4 hour time frame and as you can see we have bear dominance. The daily bearish trend has not yet been confirmed, but the pair made a new low for the year at 1.2983. I expect that this lowest point will be attacked again in the coming days and we can expect the bear to continue. Weekly and monthly trends are also bearish. Of course, follow the rules of your strategy and find the most suitable entry point. Of course, we could see strength before bear domination and that could actually serve as a great opportunity for a short position.
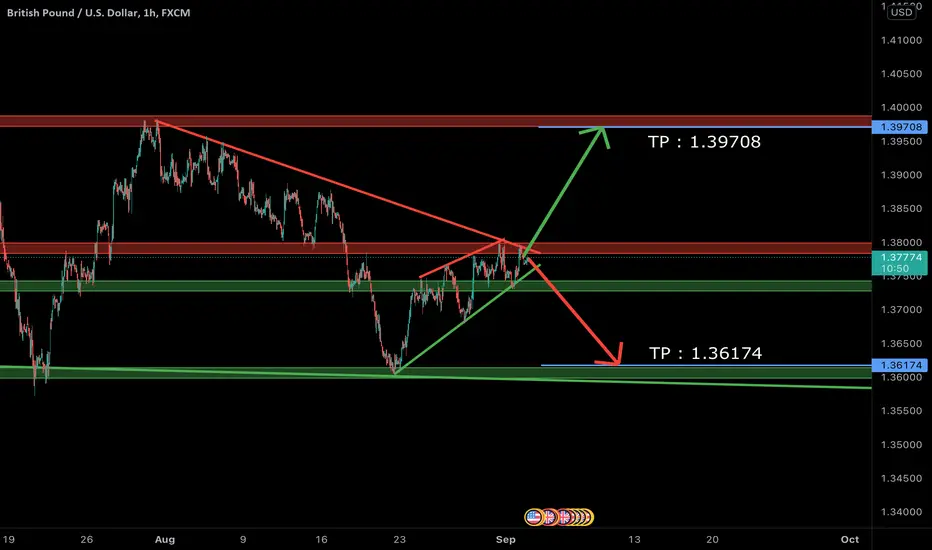
My view on GBPUSD this weekHere is my tradeview on GBPUSD this week. Please apply proper risk management when taking any trade posted here. Thank you

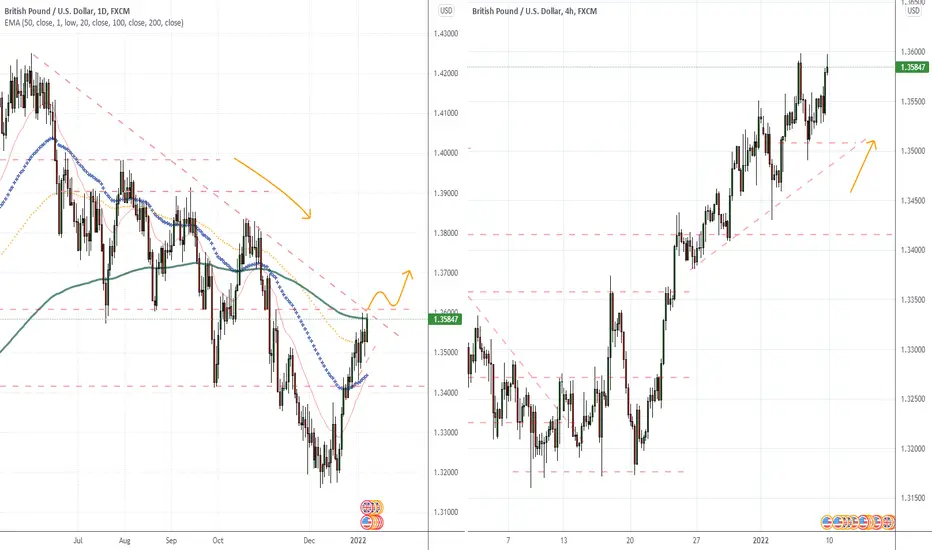
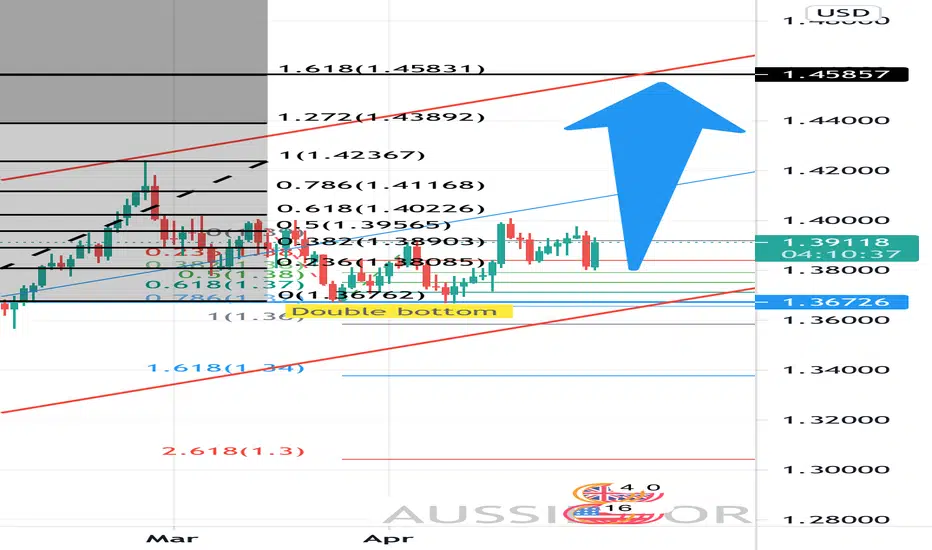
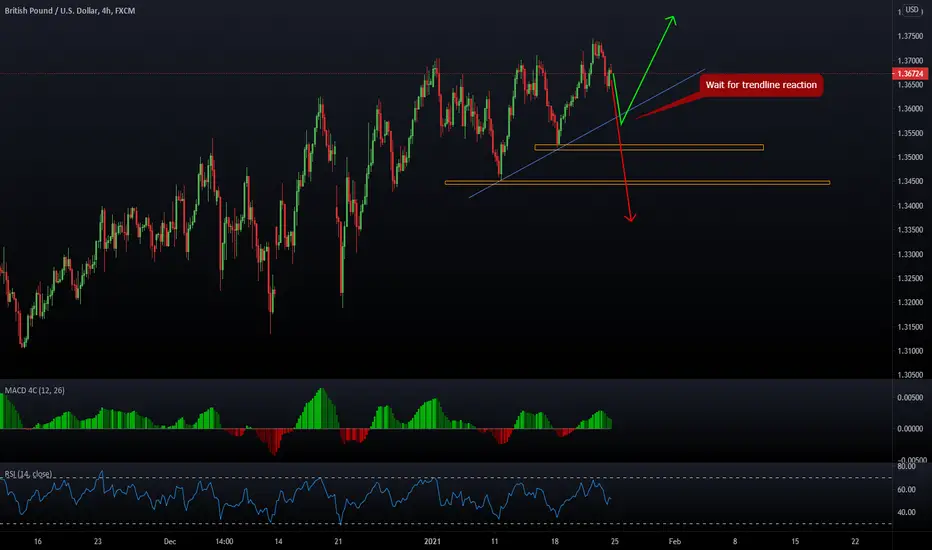
GBPUSD at 1.36 confluence of levelGBP should be one of the stronger currency against USD and 1.36 comes as a confluence of trendline ,200 ema and past level.
Could be tough nut to crack, not shorting as well, let the market tell us what to do...
***************************************************************************************
Hello there!
If you are keen to learn more on the technical setups,do visit my website at www.shadowingthebb.com !
If you like my analysis and it helped you ,do give me a thumbs ups on tradingview! 🙏
And if you would like to show further support for me, you can gift me some coins on tradingview! 😁
Thank you!
Disclaimers:
The analysis shared through this channel are purely for educational and entertainment purposes only. They are by no means professional advice for individual/s to enter trades for investment or trading purposes.
The author/producer of these content shall not and will not be responsible for any form of financial/physical/assets losses incurred from trades executed from the derived conclusion of the individual from these content shared.
Thank you, and please do your due diligence before any putting on any trades!
GBPUSD | LOOKS GOOD FOR A SELL WHAT YOU THINK?Hello Traders,
Today I am looking at GBPUSD and it seems like it could be a good selling opportunity it recently pulled back to the moving averages and gave a bearish engulfing candle to confirm that bears are still in the market.
Everything is also trending towards the downside except the monthly timeframe, so we might see bulls coming in the market shortly, however, this is not to say there aren't any pips to make with this trade.
Also, hedge funds are heavily decreasing the amount of GBP they are holding which is good.
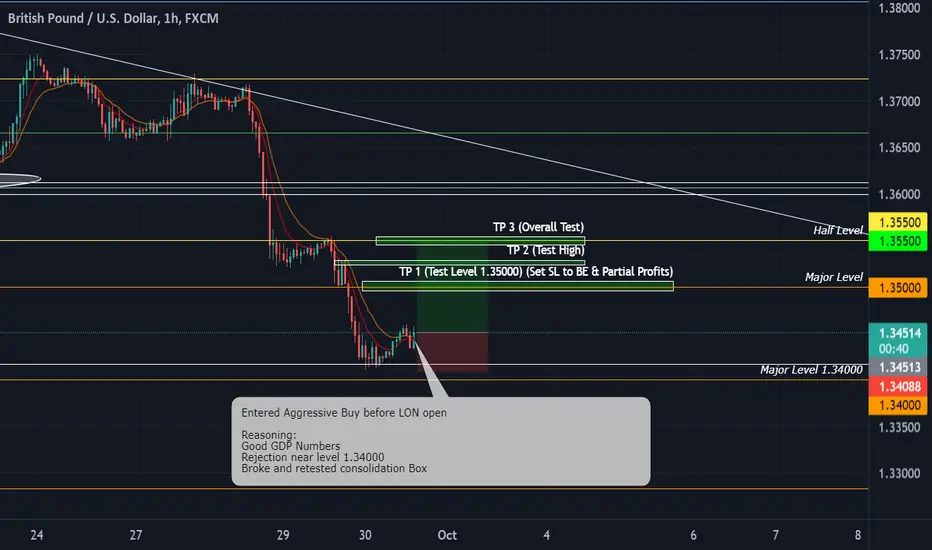
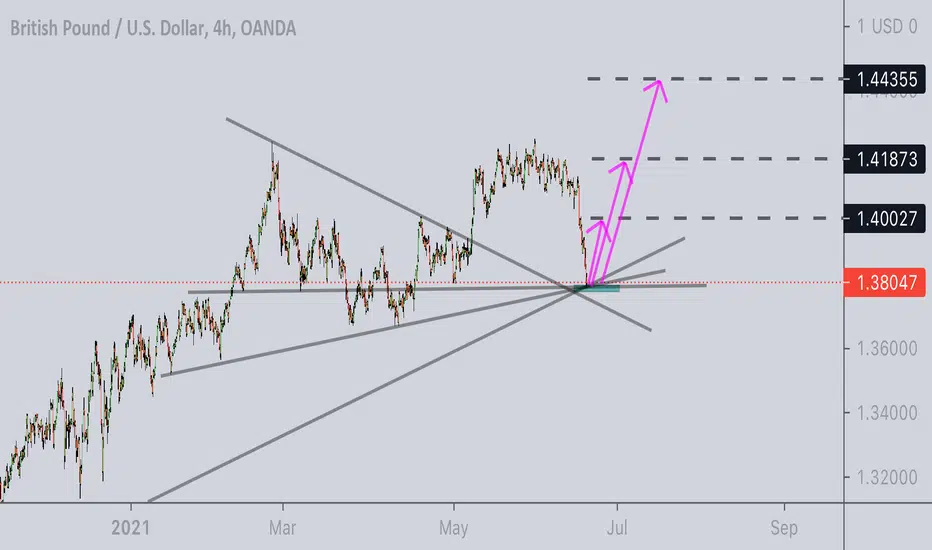
GBPUSD Aggressive BUY from good GDPReasoning:
Good GDP Numbers
Actual: 5.5%
Forecast: 4.8%
Previous: 4.8%
Rejection near level 1.34000
Broke and retested consolidation Box
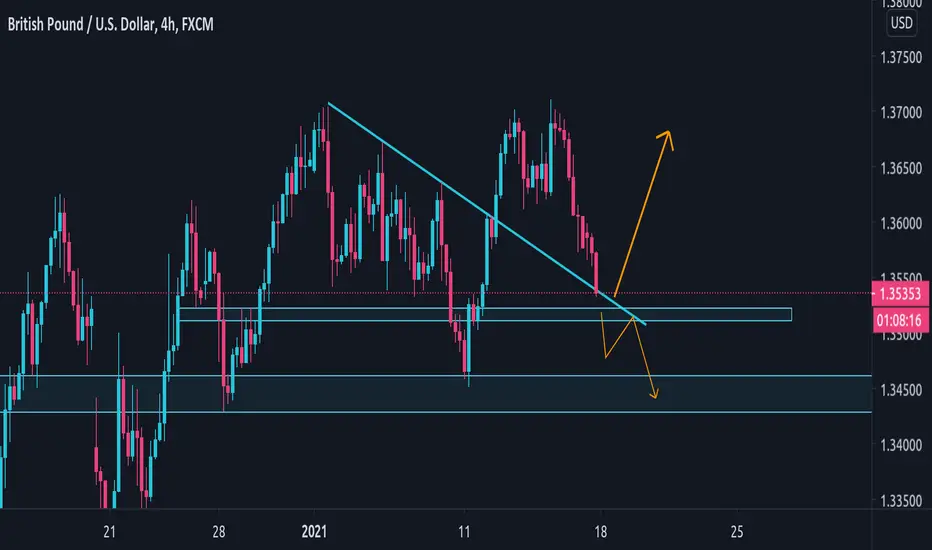
GBPUSD Price broke out the pattern already, l'll be looking for a correction to occur before entering.

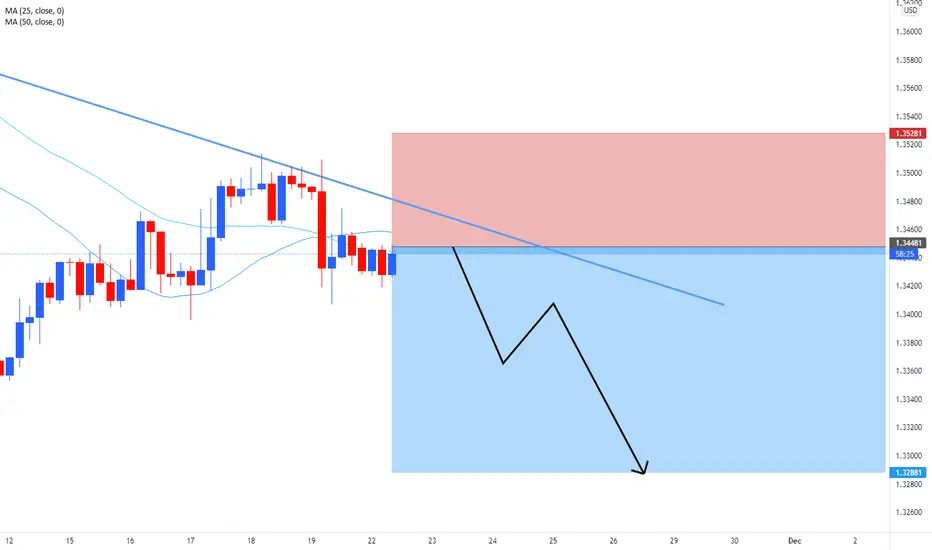
GBPUSD Price tested the resistance zone for the third time, but it did so impulsively in the 1HR timeframe, but on the bigger timeframes a continuation pattern to the downside is almost established. I will be looking to sell once price breaks support.
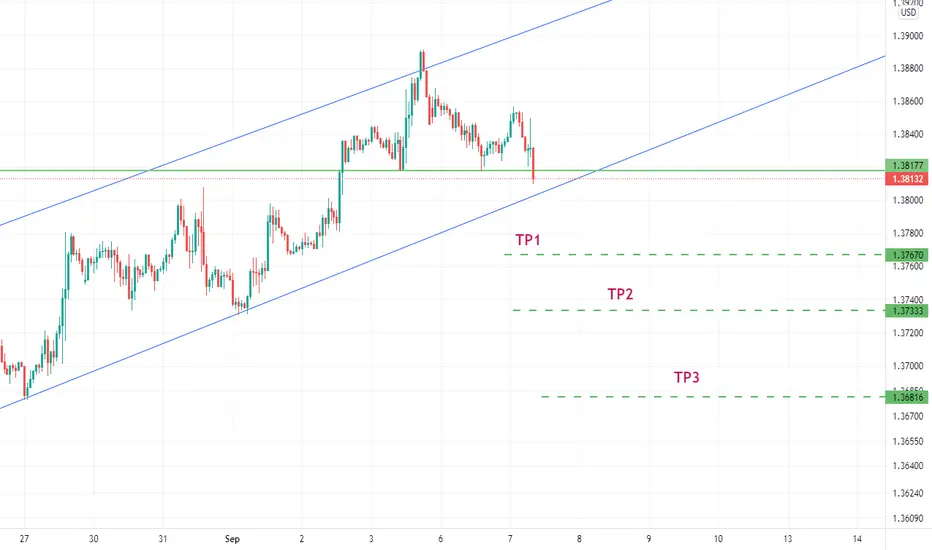
GBPUSD IF price broekr the green line i will enter a sell position for a long term
with the take proftis shown
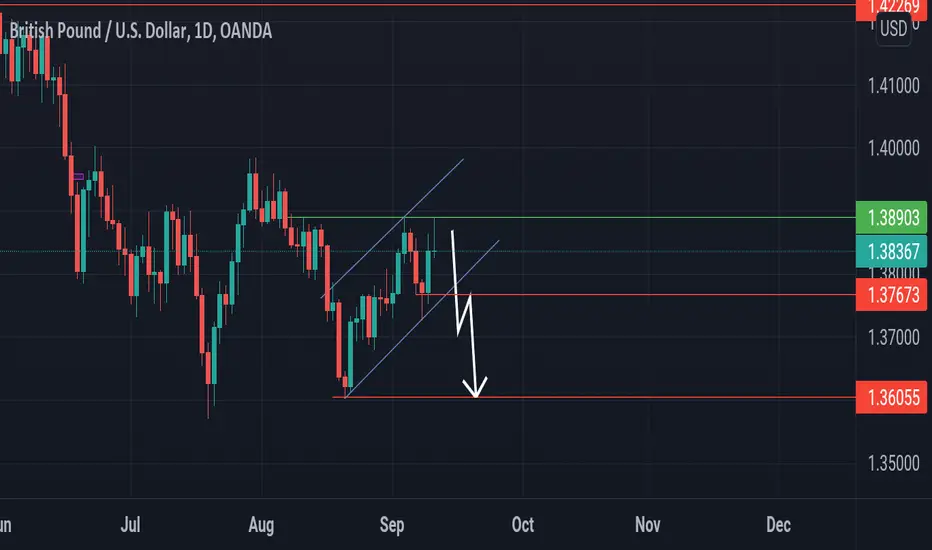
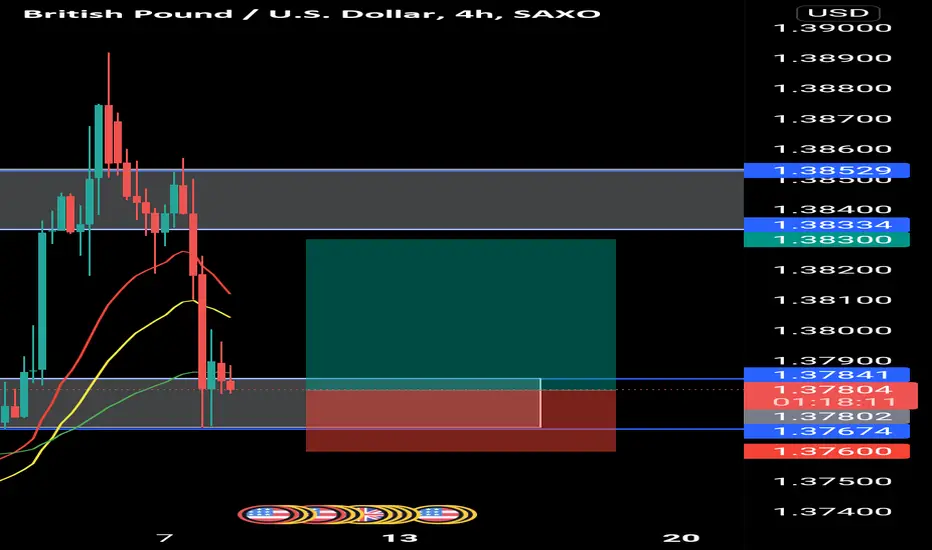
Gbpusd buy set up Counter trend set up on gbpusd high risk
Buy now
Sl 1.376
Tp 1.383
Disclaimer on
Have a nice trade
GBPUSDnice triangle patterns created by the price, and stil didn’t know where gonna price moving but always focus on breakout and retest price,,, one more thing a candle confirmation!
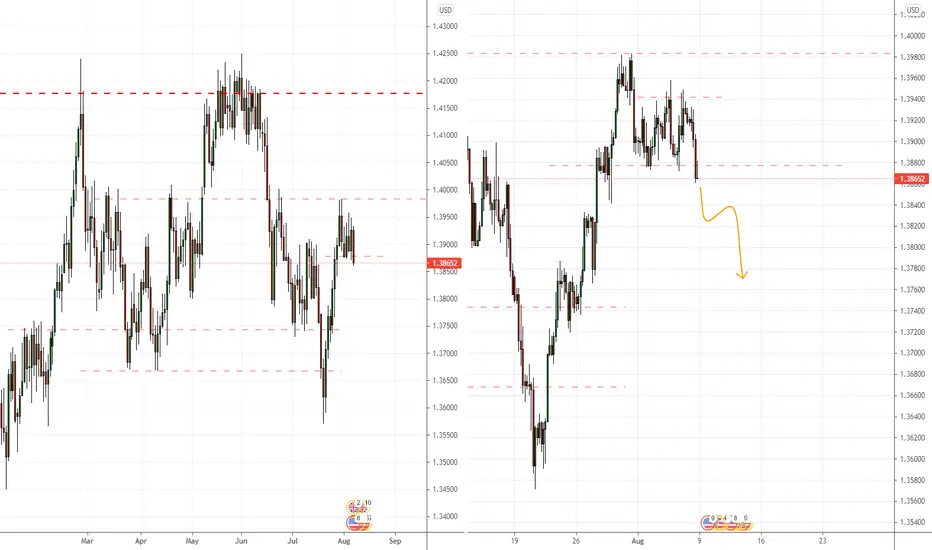
GBPUSD turning down?More downside should be coming for Gbpusd...
Hello there!
If you like my analysis and it helped you ,do give me a thumbs ups on tradingview! 🙏
And if you would like to show further support for me, you can gift me some coins on tradingview! 😁
Thank you!
Disclaimers:
The analysis shared through this channel are purely for educational and entertainment purposes only. They are by no means professional advice for individual/s to enter trades for investment or trading purposes.
The author/producer of these content shall not and will not be responsible for any form of financial/physical/assets losses incurred from trades executed from the derived conclusion of the individual from these content shared.
Thank you, and please do your due diligence before any putting on any trades!
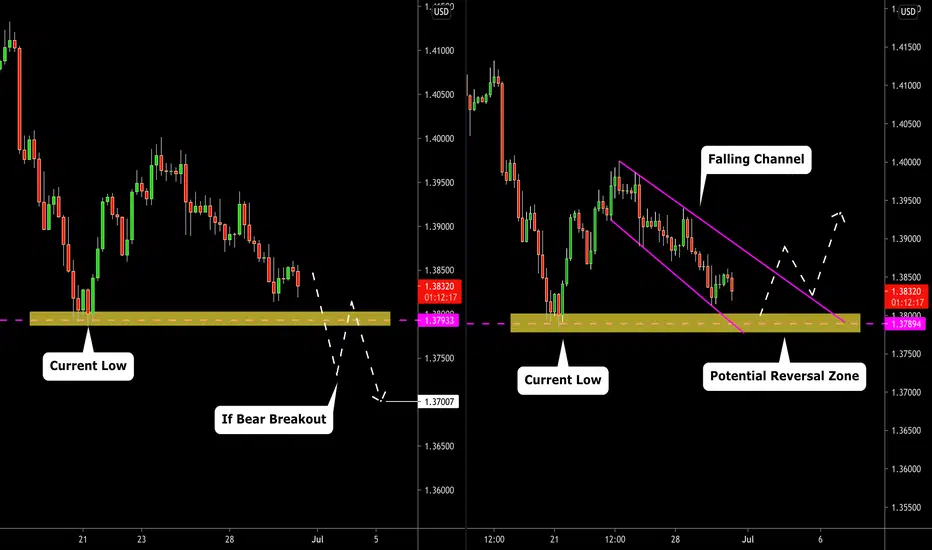
GBPUSD: Important Decision Ahead 🇬🇧🇺🇸
GBPUSD is very close to an important decision point:
1.3785 - 1.38 is a support cluster based on a current local structure low.
Here are two scenarios for you to watch:
Bearish -
To catch a bearish continuation,
wait for a breakout of the yellow zone to the downside.
It will trigger a bearish move to 1.37
Bullish -
To catch a pullback from the underlined zone,
let the price reach the yellow zone,
wait for a bullish breakout of a falling wedge pattern,
buy aggressively or on a retest.
Goal will be - 1.393
Wait for the trigger and follow the market.
Are you bullish or bearish on GBPUSD?
❤️Please, support this idea with a like and comment!❤️
GBPUSD: Detailed Analysis & Technical Outlook 🇬🇧🇺🇸
Top-down analysis & price action.
Trading recommendations & thoughts.
❤️ Please, support this idea with a like and comment! ❤️
⬇️ Subscribe to my social networks! ⬇️

BORIS, STOP THE POUND!!!
When GBPUSD will stop growing,
Where to catch a sell,
From where to buy?
The answer is in this video!

GBPUSD Selling with a level breach GBPUSD Selling with a level breach
❤️ If you find this helpful and want more FREE forecasts in TradingView
. . . . . Please show your support back,
. . . . . . . . Hit the 👍 LIKE button,
. . . . . . . . . . . Drop some feedback below in the comment!
❤️ Your Support is very much 🙏 appreciated!❤️
💎 Want us to help you become a better Forex trader?
Now, It's your turn!
Be sure to leave a comment let us know how do you see this opportunity and forecast.

GBPUSD RSFLIPSeems to be doing a RSFLIP, waiting for a heavy trace down to resistance, and then looking for a sniper entry with a tight SL
GBPUSD - Week 4Trade with care.
Disclaimer: The analysis provided is purely informative and it should not be used as financial advice. We do not recommend making hurried trading decisions. You should always understand the risk that trading implies and that PAST PERFORMANCE IS NOT NECESSARILY INDICATIVE OF FUTURE RESULTS.
GBPUSD NEUTRAL BIASThe British pound has moved back under the 1.3600 level against the US dollar, after risk-off sentiment came cause sterling to tumble on Friday. Technical analysis highlights that the GBPUSD pair faces strong upcoming support from the 1.3520 area. Overall, the GBPUSD pair is still setting higher highs on the weekly time frame, so bears still need to be careful at this stage.
The GBPUSD pair is only bullish while trading above the 1.3580 level, key resistance is found at the 1.3660 and the 1.3710 levels.
If the GBPUSD pair trades below the 1.3580, sellers may test the 1.3520 and 1.3460 support levels.
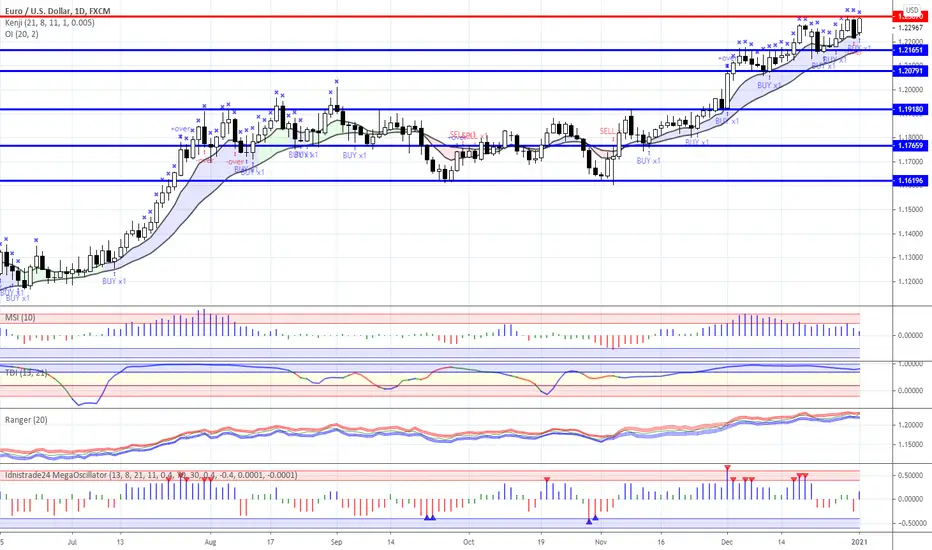
Trading plan for EURUSD, GBPUSD, USDJPY for 04/01/2021EURUSD*
Technical analysis**:
Trend: 1
Trend power: 2
Overbought/Oversold : absent
Preferable trade direction : buy
Buy near 1,2230 with a stop loss above 1,2190 and a take profit near 1,2300.
Buy near 1,2160 with a stop loss above 1,2120 and a take profit near 1,2250.
GBPUSD
Technical analysis**:
Trend : 1
Trend power: 3
Overbought/Oversold : absent
Preferable trade direction : buy
Sell near 1,3690 with a stop loss above 1,3740 and a take profit near 1,3560.
Buy near 1,3550 with a stop loss above 1,3500 and a take profit near 1,3650.
Buy near 1,3450 with a stop loss above 1,3400 and a take profit near 1,3550.
USDJPY
Technical analysis**:
Trend: -1
Trend power: -4
Overbought/Oversold : absent
Preferable trade direction : sell
Sell near 103,80 with a stop loss above 104,10 and a take profit near 103,20.
Sell near 104,40 with a stop loss above 104,80 and a take profit near 103,70.
Buy near 103,00 with a stop loss above 102,70 and a take profit near 103,60.
* all transactions are intraday, that is, it must be closed at the end of the day. The error in the parameters of transactions is +/- 5 points; in the case of fundamental force majeure, the recommendations may be less relevant;
** the trend parameter accepts values “+1” - an uptrend, “-1” - a downtrend, “0” - no trend. Determined in terms of the author's analysis of a set of signals from technical indicators from different time frames;
the trend strength parameter - accepts values from “-4” to “+4” and shows how strong this trend is. It is determined based on the author's analysis of a set of signals from technical indicators from different time frames;
overbought/oversold is defined in terms of the analy
sis of the RSI (8) indicator on a daily time frame. The boundaries of the zones are accordingly 70 and 30;
the priority area of transactions depends first of all on trend and its strength but is also taken into account our value judgments of the situation on the market.
Wish you successful trading solutions and transactions!