GBPUSD SHORT FORECAST Q2 W21 D20 Y25GBPUSD SHORT FORECAST Q2 W21 D20 Y25
Professional Risk Managers👋
Welcome back to another FRGNT chart update📈
Diving into some Forex setups using predominantly higher time frame order blocks alongside confirmation breaks of structure.
Let’s see what price action is telling us today!
💡Here are some trade confluences📝
✅Weekly order block rejection
✅Daily order block rejection
✅Intraday 15' order blocks
✅Tokyo ranges to be filled
🔑 Remember, to participate in trading comes always with a degree of risk, therefore as professional risk managers it remains vital that we stick to our risk management plan as well as our trading strategies.
📈The rest, we leave to the balance of probabilities.
💡Fail to plan. Plan to fail.
🏆It has always been that simple.
❤️Good luck with your trading journey, I shall see you at the very top.
🎯Trade consistent, FRGNT X
GBPUSD
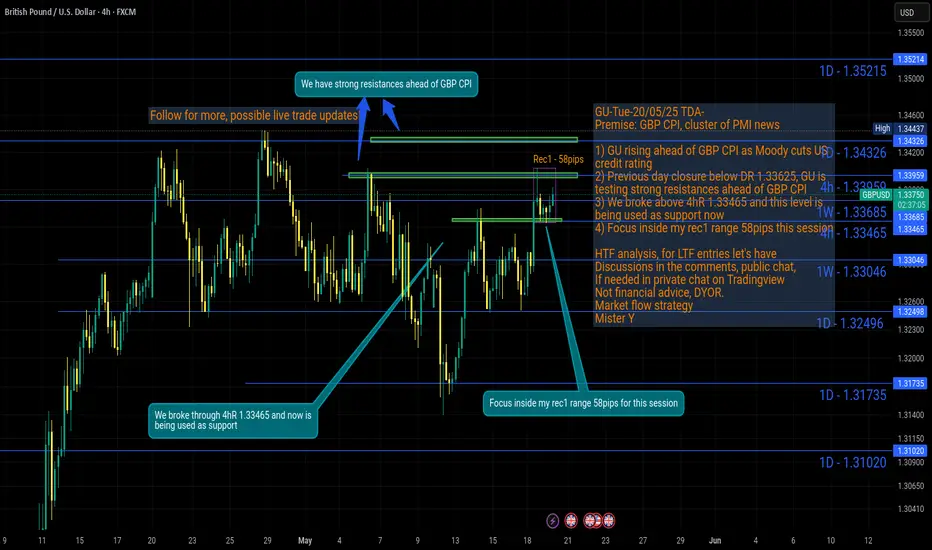
GU-Tue-20/05/25 TDA-Strong resistances ahead of GBP CPI!Analysis done directly on the chart
Follow for more, possible live trades update!
Price action, react to how candle form and move.
Not financial advice, DYOR.
Market Flow Strategy
Mister Y
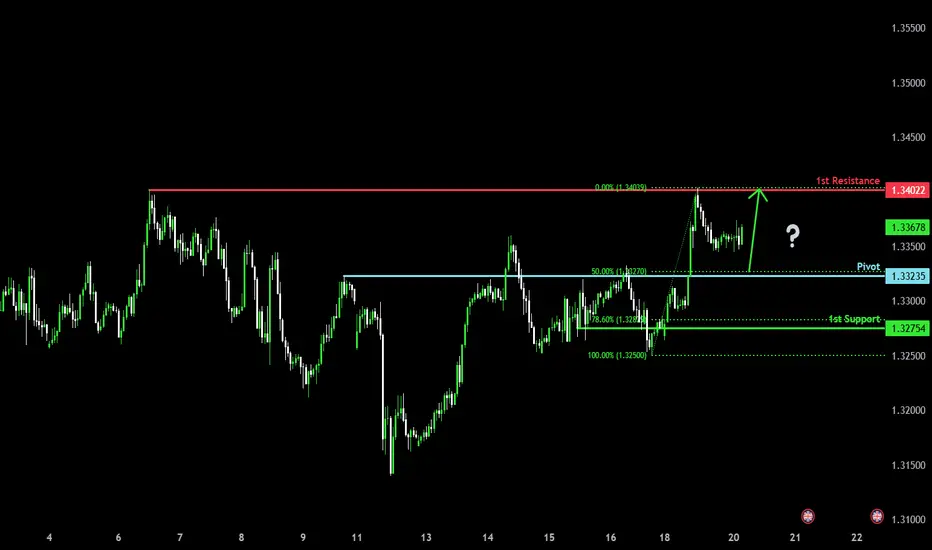
Bullish bounce for the Cable?The price is falling towards the pivot which is a pullback support and could bounce to the 1st resistance.
Pivot: 1.3323
1st Support: 1.3275
1st Resistance: 1.3402
Risk Warning:
Trading Forex and CFDs carries a high level of risk to your capital and you should only trade with money you can afford to lose. Trading Forex and CFDs may not be suitable for all investors, so please ensure that you fully understand the risks involved and seek independent advice if necessary.
Disclaimer:
The above opinions given constitute general market commentary, and do not constitute the opinion or advice of IC Markets or any form of personal or investment advice.
Any opinions, news, research, analyses, prices, other information, or links to third-party sites contained on this website are provided on an "as-is" basis, are intended only to be informative, is not an advice nor a recommendation, nor research, or a record of our trading prices, or an offer of, or solicitation for a transaction in any financial instrument and thus should not be treated as such. The information provided does not involve any specific investment objectives, financial situation and needs of any specific person who may receive it. Please be aware, that past performance is not a reliable indicator of future performance and/or results. Past Performance or Forward-looking scenarios based upon the reasonable beliefs of the third-party provider are not a guarantee of future performance. Actual results may differ materially from those anticipated in forward-looking or past performance statements. IC Markets makes no representation or warranty and assumes no liability as to the accuracy or completeness of the information provided, nor any loss arising from any investment based on a recommendation, forecast or any information supplied by any third-party.
GBPUSD H4 I Bullish Bounce Based on the H4 chart analysis, the price is falling toward our buy entry level at 1.3319, a pullback support.
Our take profit is set at 1.3434, a swing high resistance.
The stop loss is placed at 1.3233, a pullback support.
High Risk Investment Warning
Trading Forex/CFDs on margin carries a high level of risk and may not be suitable for all investors. Leverage can work against you.
Stratos Markets Limited (tradu.com):
CFDs are complex instruments and come with a high risk of losing money rapidly due to leverage. 63% of retail investor accounts lose money when trading CFDs with this provider. You should consider whether you understand how CFDs work and whether you can afford to take the high risk of losing your money.
Stratos Europe Ltd (tradu.com):
CFDs are complex instruments and come with a high risk of losing money rapidly due to leverage. 63% of retail investor accounts lose money when trading CFDs with this provider. You should consider whether you understand how CFDs work and whether you can afford to take the high risk of losing your money.
Stratos Global LLC (tradu.com):
Losses can exceed deposits.
Please be advised that the information presented on TradingView is provided to Tradu (‘Company’, ‘we’) by a third-party provider (‘TFA Global Pte Ltd’). Please be reminded that you are solely responsible for the trading decisions on your account. There is a very high degree of risk involved in trading. Any information and/or content is intended entirely for research, educational and informational purposes only and does not constitute investment or consultation advice or investment strategy. The information is not tailored to the investment needs of any specific person and therefore does not involve a consideration of any of the investment objectives, financial situation or needs of any viewer that may receive it. Kindly also note that past performance is not a reliable indicator of future results. Actual results may differ materially from those anticipated in forward-looking or past performance statements. We assume no liability as to the accuracy or completeness of any of the information and/or content provided herein and the Company cannot be held responsible for any omission, mistake nor for any loss or damage including without limitation to any loss of profit which may arise from reliance on any information supplied by TFA Global Pte Ltd.
The speaker(s) is neither an employee, agent nor representative of Tradu and is therefore acting independently. The opinions given are their own, constitute general market commentary, and do not constitute the opinion or advice of Tradu or any form of personal or investment advice. Tradu neither endorses nor guarantees offerings of third-party speakers, nor is Tradu responsible for the content, veracity or opinions of third-party speakers, presenters or participants.

GBPUSD: Bulls Are Gearing Up For The Next RallyBullish Confirmations:
- Double bottom formed at QP at end of last week
- Creating HLs and HHs
- Bullish Choch
- Multiple bullish FVGs (showing bullish momentum)
- Multiple bullish breaker blocks
🟢ENTRY 1.33578
SL 1.331
TP1 1.33778
TP2 1.34078
TP3 1.34578
There's a chance we may get a deeper pullback. If so no big deal, we'll just catch a better entry.

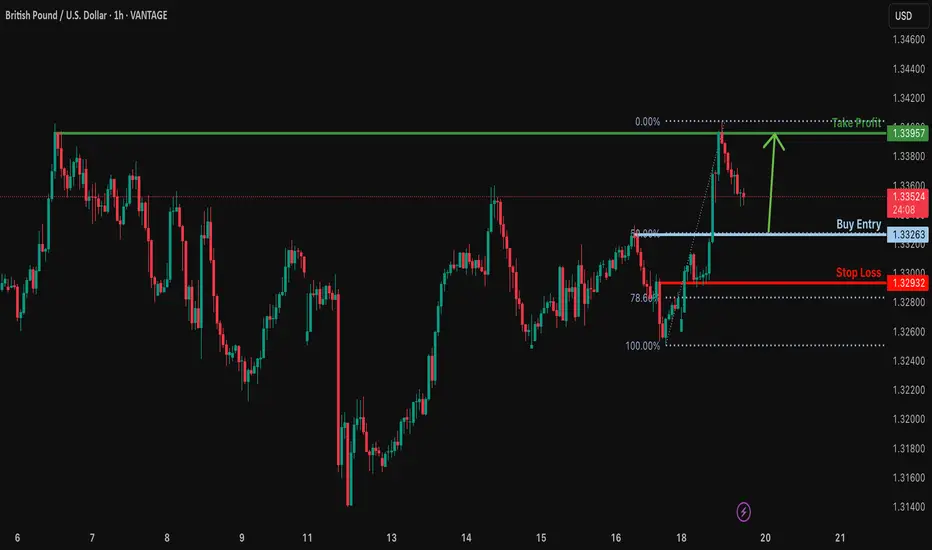
Bullish bounce off 50% Fibonacci support?GBP/USD is falling towards the support level which is a pullback support that lines up with the 50% Fibonacci retracement and could bounce from this level to our take profit.
Entry: 1.3326
Why we like it:
There is a pullback support level that lines up with the 50% Fibonacci retracement.
Stop loss: 1.3293
Why we like it:
There is an overlap support level that is slightly above the 78.6% Fibonacci retracement.
Take profit: 1.3395
Why we like it:
There is a pullback resistance.
Enjoying your TradingView experience? Review us!
Please be advised that the information presented on TradingView is provided to Vantage (‘Vantage Global Limited’, ‘we’) by a third-party provider (‘Everest Fortune Group’). Please be reminded that you are solely responsible for the trading decisions on your account. There is a very high degree of risk involved in trading. Any information and/or content is intended entirely for research, educational and informational purposes only and does not constitute investment or consultation advice or investment strategy. The information is not tailored to the investment needs of any specific person and therefore does not involve a consideration of any of the investment objectives, financial situation or needs of any viewer that may receive it. Kindly also note that past performance is not a reliable indicator of future results. Actual results may differ materially from those anticipated in forward-looking or past performance statements. We assume no liability as to the accuracy or completeness of any of the information and/or content provided herein and the Company cannot be held responsible for any omission, mistake nor for any loss or damage including without limitation to any loss of profit which may arise from reliance on any information supplied by Everest Fortune Group.
GBPUSD Buyers In Panic! SELL!
My dear friends,
My technical analysis for GBPUSD is below:
The market is trading on 1.3368 pivot level.
Bias - Bearish
Technical Indicators: Both Super Trend & Pivot HL indicate a highly probable Bearish continuation.
Target - 1.3306
Recommended Stop Loss - 1.3406
About Used Indicators:
A pivot point is a technical analysis indicator, or calculations, used to determine the overall trend of the market over different time frames.
Disclosure: I am part of Trade Nation's Influencer program and receive a monthly fee for using their TradingView charts in my analysis.
———————————
WISH YOU ALL LUCK
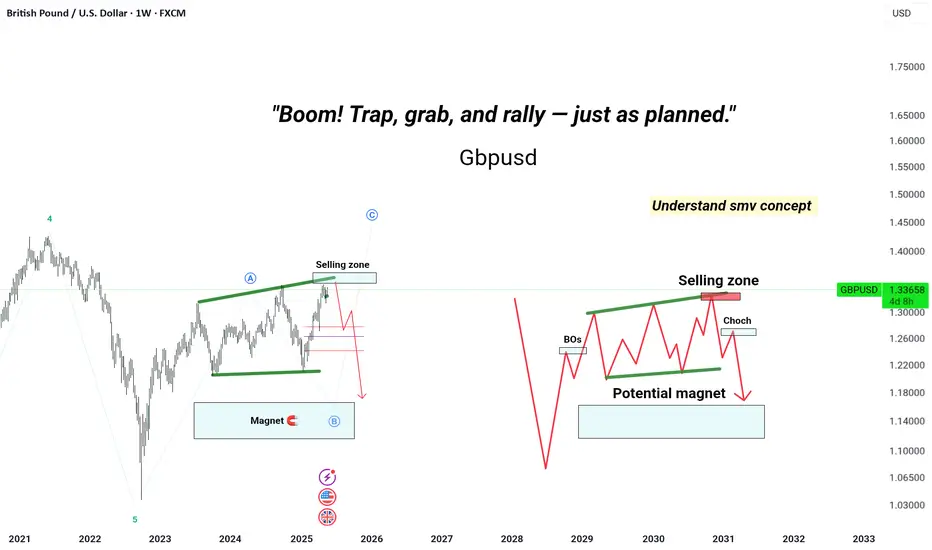
7. "Boom! Trap, grab, and rally — just as planned."
**"She walked right into the selling zone like she owned the chart.
But baby, this ain’t a fairy tale — this is Elliott Wave.
Wave C? Dead on arrival.
CHOCH triggered? Game on.
Retail's still dreaming of 1.40 —
We're already targeting the magnet zone with sniper precision.
She teased the breakout, we caught the fakeout.
This ain't luck. It's strategy wrapped in savage.
Trade less. Win more.
Stay sexy, stay sharp."**
GBPUSD Will Move Lower! Sell!
Please, check our technical outlook for GBPUSD.
Time Frame: 2h
Current Trend: Bearish
Sentiment: Overbought (based on 7-period RSI)
Forecast: Bearish
The market is approaching a key horizontal level 1.338.
Considering the today's price action, probabilities will be high to see a movement to 1.331.
P.S
The term oversold refers to a condition where an asset has traded lower in price and has the potential for a price bounce.
Overbought refers to market scenarios where the instrument is traded considerably higher than its fair value. Overvaluation is caused by market sentiments when there is positive news.
Disclosure: I am part of Trade Nation's Influencer program and receive a monthly fee for using their TradingView charts in my analysis.
Like and subscribe and comment my ideas if you enjoy them!

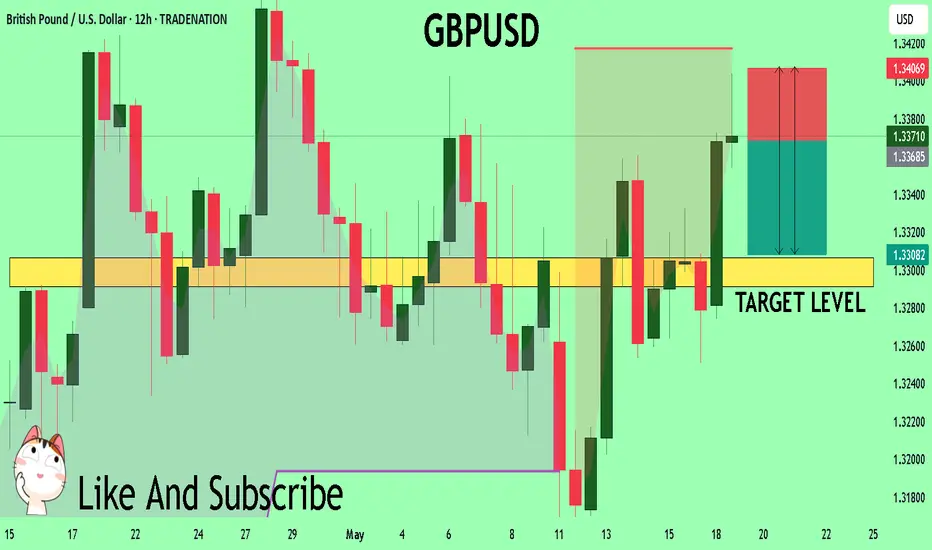
GBP/USD BUYERS WILL DOMINATE THE MARKET|LONG
GBP/USD SIGNAL
Trade Direction: long
Entry Level: 1.316
Target Level: 1.338
Stop Loss: 1.302
RISK PROFILE
Risk level: medium
Suggested risk: 1%
Timeframe: 12h
Disclosure: I am part of Trade Nation's Influencer program and receive a monthly fee for using their TradingView charts in my analysis.
✅LIKE AND COMMENT MY IDEAS✅
GBPUSD and GBPJPY Analysis todayHello traders, this is a complete multiple timeframe analysis of this pair. We see could find significant trading opportunities as per analysis upon price action confirmation we may take this trade. Smash the like button if you find value in this analysis and drop a comment if you have any questions or let me know which pair to cover in my next analysis.

GU-Mon-19/05/25 TDA-Closure above for buy and below for sell!Analysis done directly on the chart
Follow for more, possible live updates!
Before trade analysis
During trade analysis
After trade analysis
All important steps to fully understand
technically and fundamentally why price
moved this, that way.
Not financial advice, DYOR.
Market Flow Strategy
Mister Y

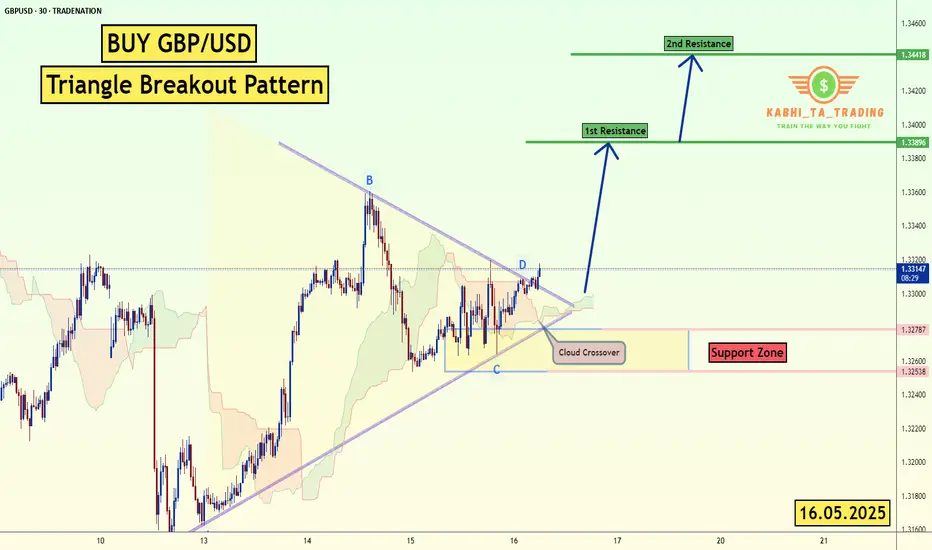
GBP/USD - Triangle Breakout (16.05.2025)The GBP/USD pair on the M30 timeframe presents a Potential Buying Opportunity due to a recent Formation of a Triangle Breakout Pattern. This suggests a shift in momentum towards the upside and a higher likelihood of further advances in the coming hours.
Possible Long Trade:
Entry: Consider Entering A Long Position around Trendline Of The Pattern.
Target Levels:
1st Resistance – 1.3389
2nd Resistance – 1.3441
🎁 Please hit the like button and
🎁 Leave a comment to support for My Post !
Your likes and comments are incredibly motivating and will encourage me to share more analysis with you.
Best Regards, KABHI_TA_TRADING
Thank you.
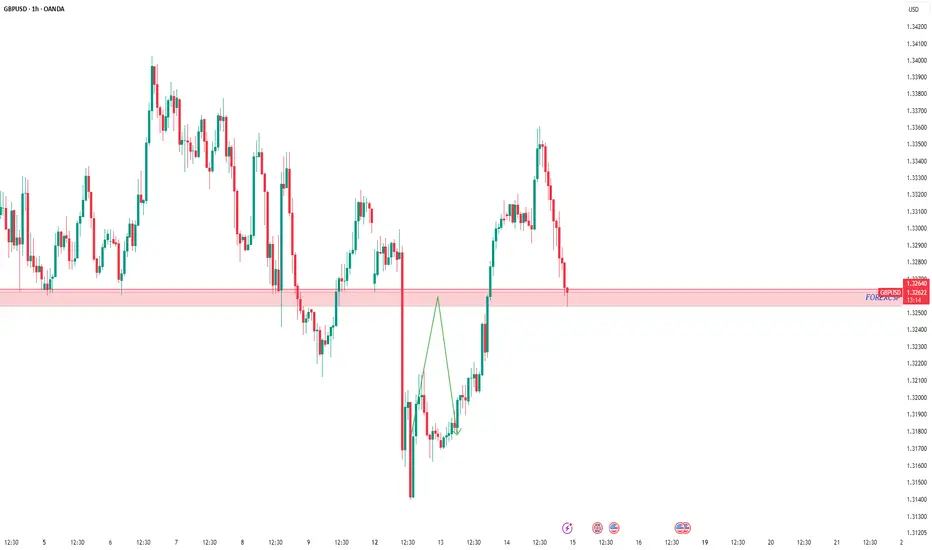
GBPUSD pullbackOANDA:GBPUSD
As shown in our pinned analysis, this level was previously considered for a short trade. But after being broken, according to our plan, it has now turned into a buy zone.
We are ready to enter a long position,
but if the price drops below and holds, this level will lose its validity and the analysis will be invalid.
Follow us for more trades analysis!
For detailed entry points, trade management, and high-probability setups, follow the channel:
ForexCSP
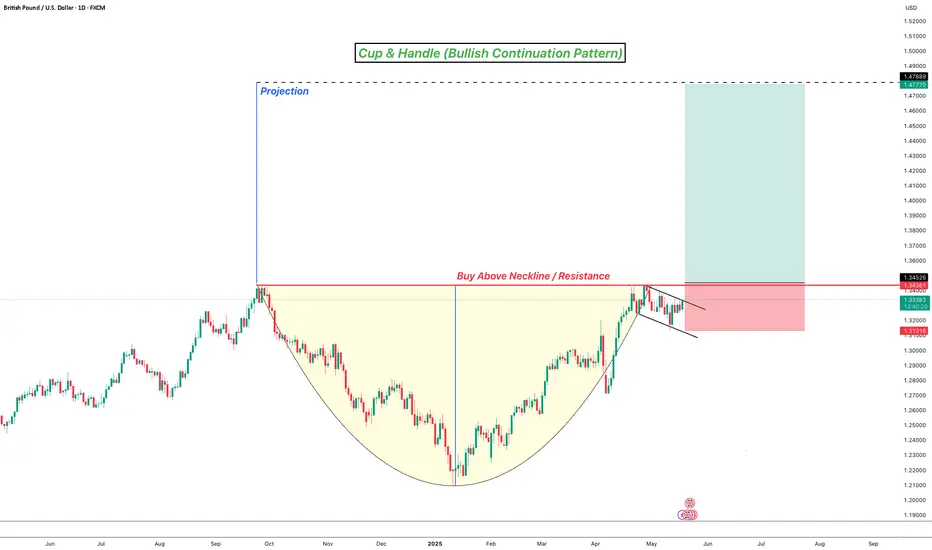
Cup & Handle - Bullish Continuation PatternFX:GBPUSD continues its bullish trend, printing higher highs and higher lows. Currently price has formed a Cup & Handle pattern signalling potential bullish continuation!
Following the analysis, buys should only be triggered once neckline / resistance has been broken!
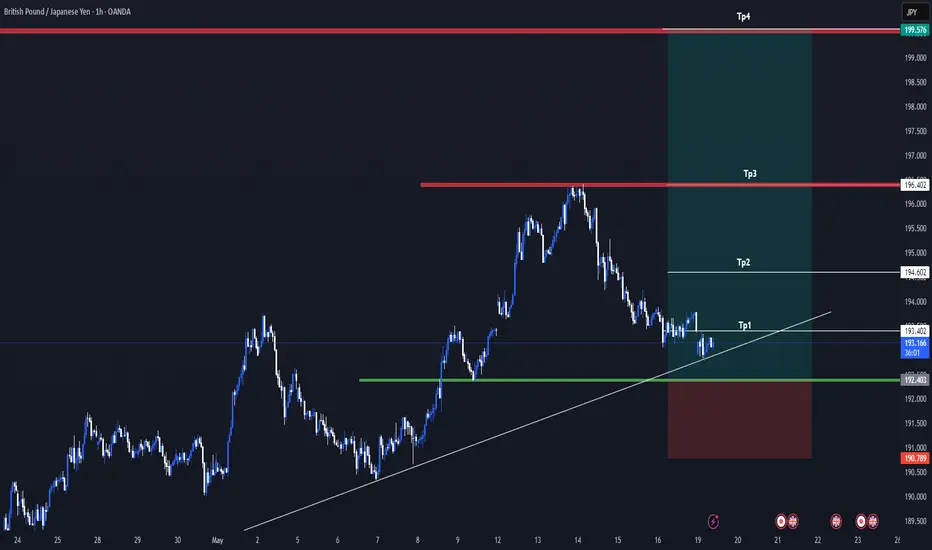
GBPJPY Signal : 1H / 4H Beautiful buy !!!Hello Traders! 👋
What are your thoughts on GBPJPY ?
Symbol : GBPJPY H1
Market price : 193.20
BUY limit : 192.40 - 192.00
Tp1 :193.40
Tp2 : 194.60
Tp3 : 196.40
Tp4 : 199.60
Sl : 190.80
Don’t forget to like and share your thoughts in the comments! ❤️
Remember this is a position that was found by me and it is a personal idea not a financial advice, you are responsible for your loss and gain.
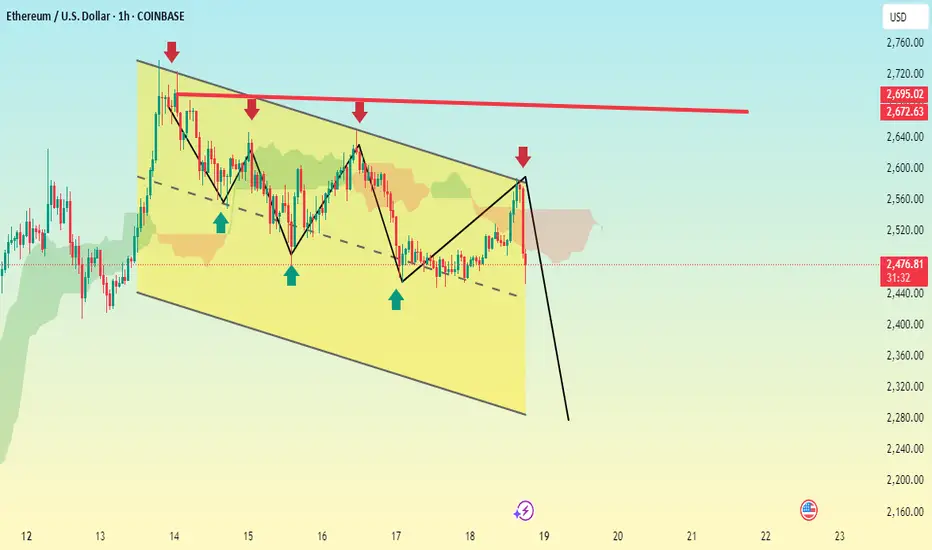
ETHEREUM BEARISH ZONEBased on the chart we provided, which shows a descending channel and a bearish pattern on Ethereum (ETH/USD) on the 1-hour timeframe, it seems like you're anticipating a breakdown from the channel support. The chart also shows a projected drop with a strong bearish move marked by a thick black arrow.
Here are some potential Take Profit (TP) levels based on technical support zones and the chart structure:
Suggested Sell TPs (short position):
1. TP1: $2,420 — Just above the recent swing low, potential initial support.
2. TP2: $2,360 — Mid-range of the previous low and psychological level.
3. TP3: $2,300 — Near the bottom of the descending channel and a likely target if breakdown confirms.
4. TP4: $2,240–$2,200 — Extended TP if momentum is strong and the broader market supports the move.
Always remember:
Use proper risk management.
Monitor volume and market sentiment around the breakout.
Consider setting a stop loss just above the recent swing high (around $2,565–$2,580).
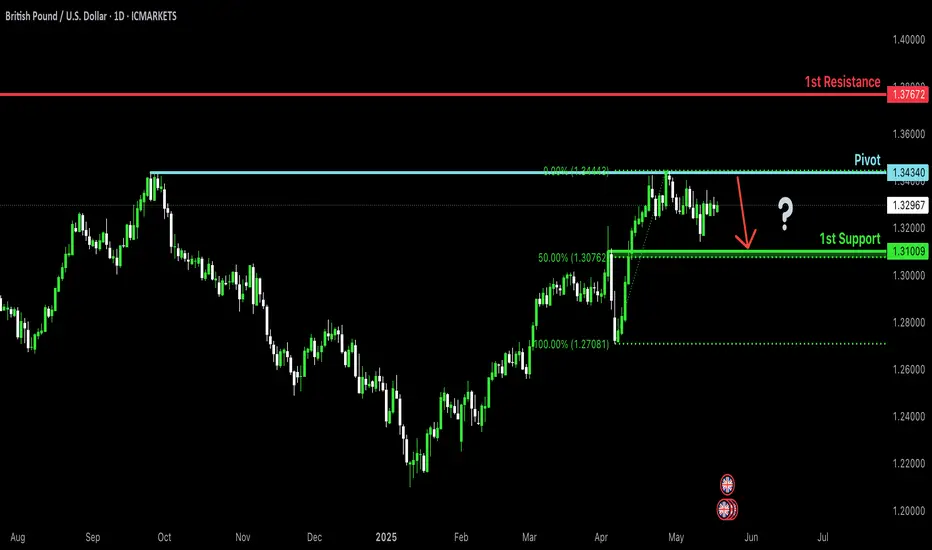
Bearish reversal off pullback resistance?The Cable (GBP/USD) is rising towards the pivot which is a pullback resistance and could reverse to the 1st support which acts as a pullback support.
Pivot: 1.3434
1st Support: 1.3100
1st Resistance: 1.3767
Risk Warning:
Trading Forex and CFDs carries a high level of risk to your capital and you should only trade with money you can afford to lose. Trading Forex and CFDs may not be suitable for all investors, so please ensure that you fully understand the risks involved and seek independent advice if necessary.
Disclaimer:
The above opinions given constitute general market commentary, and do not constitute the opinion or advice of IC Markets or any form of personal or investment advice.
Any opinions, news, research, analyses, prices, other information, or links to third-party sites contained on this website are provided on an "as-is" basis, are intended only to be informative, is not an advice nor a recommendation, nor research, or a record of our trading prices, or an offer of, or solicitation for a transaction in any financial instrument and thus should not be treated as such. The information provided does not involve any specific investment objectives, financial situation and needs of any specific person who may receive it. Please be aware, that past performance is not a reliable indicator of future performance and/or results. Past Performance or Forward-looking scenarios based upon the reasonable beliefs of the third-party provider are not a guarantee of future performance. Actual results may differ materially from those anticipated in forward-looking or past performance statements. IC Markets makes no representation or warranty and assumes no liability as to the accuracy or completeness of the information provided, nor any loss arising from any investment based on a recommendation, forecast or any information supplied by any third-party.
GBPUSD inverted head and shoulder?Hello traders, this is a complete multiple timeframe analysis of this pair. We see could find significant trading opportunities as per analysis upon price action confirmation we may take this trade. Smash the like button if you find value in this analysis and drop a comment if you have any questions or let me know which pair to cover in my next analysis.

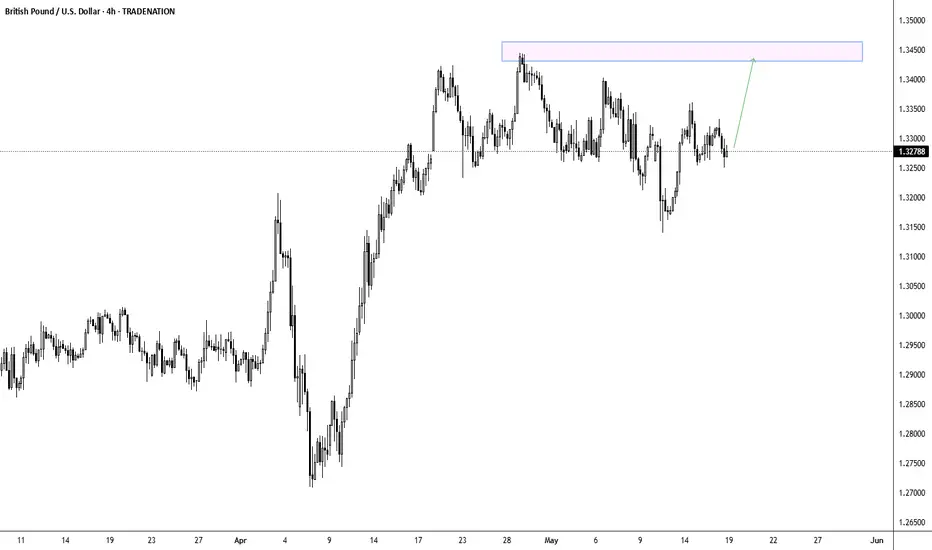
GBPUSD - Double Top Formation in Focus?The GBP/USD pair is currently trading at 1.3278, showing signs of consolidation within a well-established range after recovering from the early April lows near 1.2700. Price action over the past month has created a series of higher lows while repeatedly testing resistance in the 1.3400-1.3450 zone highlighted by the light blue rectangle. The higher probability scenario suggests that cable is likely to make another push toward this critical resistance area, potentially forming a double top with the early May peak around 1.3450. This technical formation would be significant for traders, as a successful breakout above this double top structure could trigger a substantial bullish move, while rejection might lead to a deeper correction. However, the current market structure and momentum favor an eventual upside resolution, with the green arrow indicating a potential target above 1.3450 if buyers can muster sufficient strength to overcome this formidable resistance level.
Disclosure: I am part of Trade Nation's Influencer program and receive a monthly fee for using their TradingView charts in my analysis.
DON'T MISS OUT ON GBPUSD SHORTS IN W21 OF Q2 Y25GBPUSD SHORT FORECAST Q2 W21 Y25
DON'T MISS OUT ON GBPUSD SHORTS IN W21 OF Q2 Y25
Professional Risk Managers👋
Welcome back to another FRGNT chart update📈
Diving into some Forex setups using predominantly higher time frame order blocks alongside confirmation breaks of structure.
Let’s see what price action is telling us today!
💡Here are some trade confluences📝
✅Weekly order block rejection
✅Daily order block rejection
✅Intraday 15' order blocks
✅Tokyo ranges to be filled
🔑 Remember, to participate in trading comes always with a degree of risk, therefore as professional risk managers it remains vital that we stick to our risk management plan as well as our trading strategies.
📈The rest, we leave to the balance of probabilities.
💡Fail to plan. Plan to fail.
🏆It has always been that simple.
❤️Good luck with your trading journey, I shall see you at the very top.
🎯Trade consistent, FRGNT X

GBPUSD Week 21 Swing Zone/LevelsNot Always.
Not always will price conform to hypothesis, but in following good RRR success is assured.
We setup week 21 levels and zone as shown with the predicted pathways.
Trade Parameters: Entry on 5 mins chart
Sl 10-15pips
TP usually dynamic but typically 5x
Follow on for trade updates.
As Always PRICE determines trades
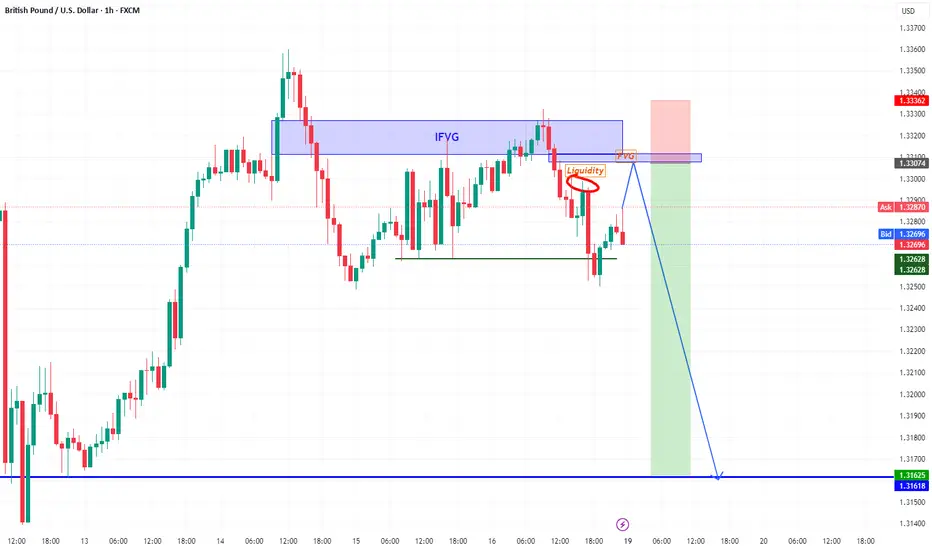
GBPUSD Bearish The main trend is down. The price rebounded from IFVG. We are waiting for a liquidity sweep and rebound from FVG.
Target 1.3162