GBP/USD Hits June LowGBP/USD Hits June Low
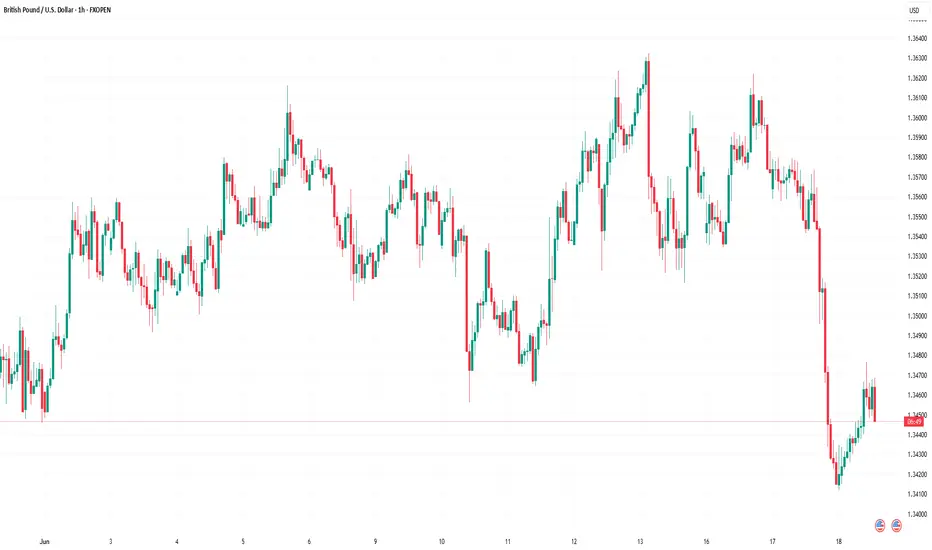
As the GBP/USD chart shows, the pair dropped sharply last night, falling below the 1.34170 level. This move marked the lowest point for the pound against the dollar since the beginning of June.
One of the main drivers behind this decline is the strengthening of the US dollar, which is attracting market participants amid heightened geopolitical tensions and a potential escalation of military conflict between Iran and Israel, involving US armed forces. According to the latest reports, Donald Trump has warned Tehran that US patience is wearing thin.
Today, however, the pound has seen a slight rebound, supported by the release of the UK Consumer Price Index (CPI). While the data confirmed that inflation is easing, the pace of decline is slower than expected. This may reduce the likelihood of interest rate cuts by the Bank of England – which in turn has boosted the pound’s value.
What could happen next?
Technical Analysis of the GBP/USD Chart
Since the end of May, price fluctuations have formed an ascending channel (shown in blue), with bulls making several attempts to break the resistance level at 1.3600 – so far, without much success.
The sharp decline from point A to B suggests that the bears have seized the initiative, with the pair rebounding from the lower boundary of the blue channel.
GBP/USD traders may:
→ interpret the bounce from the lower blue boundary as an upward correction following a sharp fall;
→ use Fibonacci retracement levels to estimate potential upside. In such cases, particular attention is typically given to the 0.5–0.618 zone (highlighted in orange). Here, it aligns with the 1.3526 level, which acted as support on 12–13 June, but may now serve as resistance after being breached.
This article represents the opinion of the Companies operating under the FXOpen brand only. It is not to be construed as an offer, solicitation, or recommendation with respect to products and services provided by the Companies operating under the FXOpen brand, nor is it to be considered financial advice.
GBPUSD
EURUSD,GBPUSD and USDJPY Analysis todayHello traders, this is a complete multiple timeframe analysis of this pair. We see could find significant trading opportunities as per analysis upon price action confirmation we may take this trade. Smash the like button if you find value in this analysis and drop a comment if you have any questions or let me know which pair to cover in my next analysis.

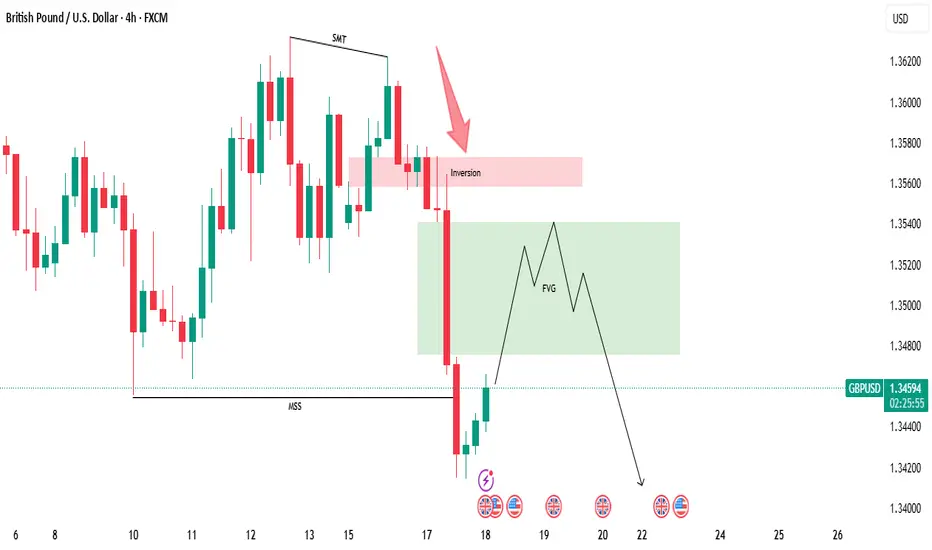
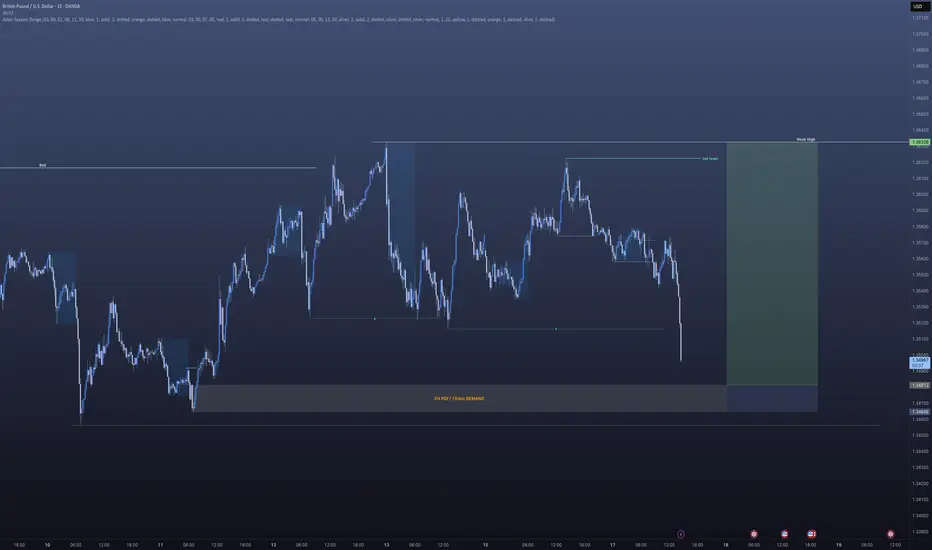
What to Watch For Next!💡 GBPUSD Bearish Trade Outlook – Detailed Analysis
The GBPUSD pair has recently shown a clear Market Structure Shift (MSS) to the downside — a strong sign that bearish momentum may be taking control. Alongside this shift, we’ve also seen the formation of a Bearish Fair Value Gap (FVG) on the 4-hour timeframe, which adds further confluence to the potential for continued downside.
📍 What This Means:
The break in structure combined with the FVG suggests that institutional activity may be driving price lower, possibly targeting areas of untapped liquidity beneath previous lows. These are often high-probability setups when traded with confirmation.
🔎 What to Watch For Next:
At this point, it's best to wait patiently for the price to retrace into the 4H FVG zone. Once price taps this area, we should closely monitor lower timeframes (such as 15M or 5M) for bearish confirmation entries — like a bearish engulfing pattern, change in character (ChoCH), or internal MSS.
📉 Potential Trade Idea:
If confirmation occurs, we can look to enter a sell position, targeting downside liquidity levels, such as previous swing lows or equal lows — where the market often hunts liquidity.
⚠️ Risk Reminder:
As always, avoid entering blindly. Let the market give you a clear sign. Use proper risk management, and stick to your strategy.
📚 DYOR – Do Your Own Research!
The market doesn’t guarantee outcomes. Your own analysis, patience, and discipline are your best tools.
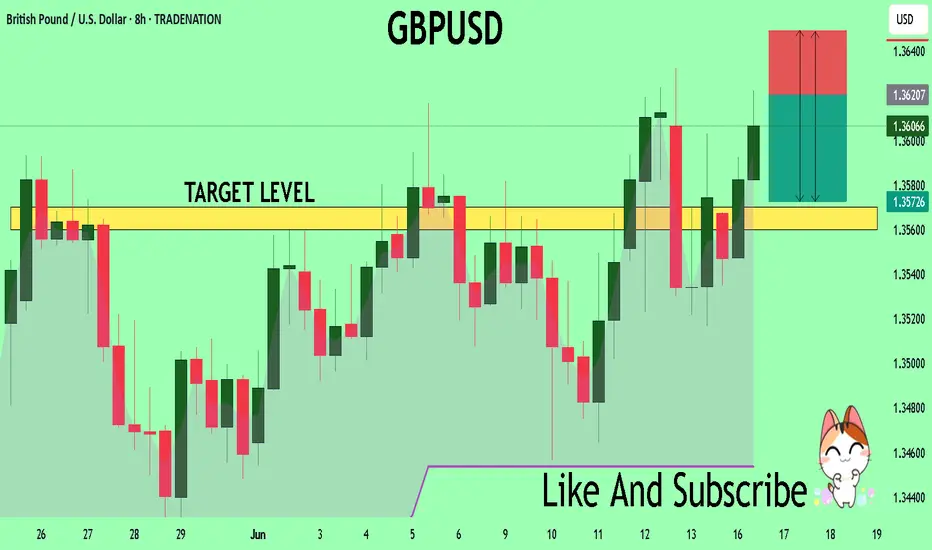
GBPUSD short!Classic Wyckoff upthrust, this is A+
We’ve got a clear AB=CD completion at C, tagging previous support-turned-resistance, while the volume on the climb is drying up (classic clue of passive buyers getting trapped). The channel top + Fibonacci confluence + previous swing zone adds weight.
🔻 Trade Idea:
Entry: 1.3477
Stop: 1.3521 (above wick highs and structure)
Target 1: 1.3401 (break structure)
Target 2: 1.3276 (full measured move / spring's origin)
Risk-Reward: ~3.5R
Volume divergence confirms exhaustion.
Ideal reaction would break through mid-line and sustain under 1.3401.
🔍 Watch For:
Bearish engulfing confirmation on 1h
Volume spike during breakdown = smart money selling
If price lingers above 1.3515, trap invalid

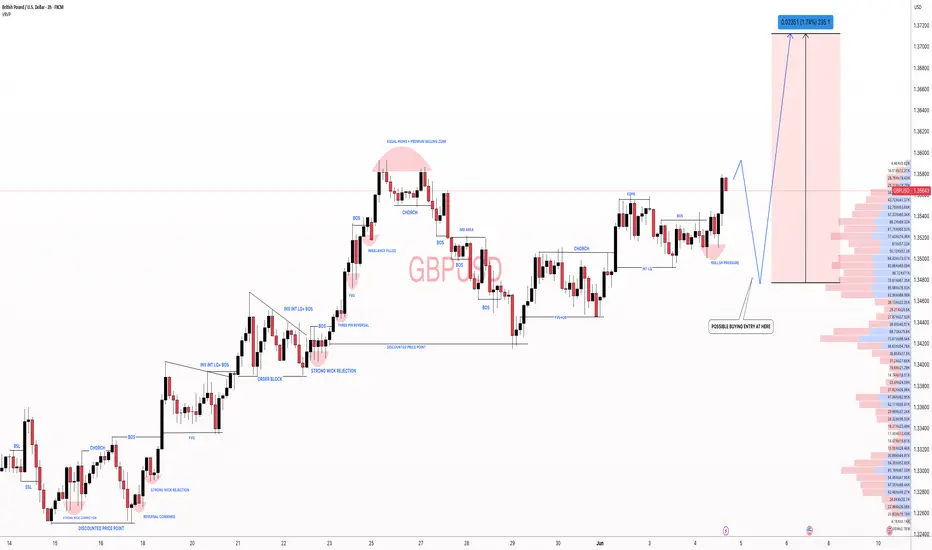
Marked with “EQH” (Equal Highs), indicating a liquidity area.Chart Elements:
Instrument & Timeframe:
Pair: GBP/USD (British Pound / U.S. Dollar)
Timeframe: 4-hour chart (each candlestick = 4 hours)
Key Zones Highlighted:
Top Green Box (~1.36000–1.36500):
This represents a resistance zone where price has previously struggled to break above.
Marked with “EQH” (Equal Highs), indicating a liquidity area or potential stop-hunt zone.
Bottom Green Box (~1.33500–1.34200):
This is a support zone where price has bounced before.
The price is currently near this support level.
Price Movement Forecast (White Zigzag Line):
Indicates a bullish projection:
Suggests a potential bounce from the current support zone.
A possible rally back towards the resistance zone (~1.36000–1.36500), potentially to grab liquidity above the EQH.
Current Price:
Shown around 1.34656, which is near the bottom support zone.
Candlestick Structure:
Price has recently had a sharp move down into the support zone.
A possible reversal setup is forming based on the projection.
Interpretation:
The chart suggests a bullish scenario for GBP/USD:
The price is expected to hold the support zone.
If buying pressure comes in, the price may rise toward the resistance level to test or sweep the equal highs.

GBPUSD SHORTThe GBP/USD pair has been showing signs of exhaustion after a recent rally, and I'm looking for a potential pullback to enter a short position.
While GBP/USD has shown resilience, the technical and fundamental setup suggests a potential short opportunity on a pullback. Confirmation through price action (e.g., bearish engulfing patterns, break of structure) will be crucial before entering.

BoE in Focus as GBP/USD Nears 1.3410GBP/USD remains under pressure for a third day, trading near 1.3410 in Thursday’s Asian session, as safe-haven demand strengthens the US Dollar amid Israel-Iran tensions. The BoE is expected to hold rates at 4.25% today. UK inflation eased to 3.4% in May from 3.5%, in line with forecasts but still above the 2% target. Markets still price in about 48 basis points of BoE cuts by year-end.
Resistance is seen at 1.3440, while support holds at 1.3260.
Fundamental Market Analysis for June 19, 2025 GBPUSDEvent to pay attention to today:
14:00 EET. GBP - Bank of England base rate decision
GBPUSD:
GBP/USD remains down for the third consecutive session, trading around 1.34100 in Asian trading on Thursday. The pair is struggling as the US dollar (USD) strengthens amid rising demand for safe-haven assets triggered by escalating tensions between Israel and Iran. In addition, the Bank of England (BoE) is widely expected to leave interest rates unchanged on Thursday.
In the UK, consumer price index inflation fell to 3.4% year-on-year in May, as expected, from 3.5% in April. However, this figure is still well above the BoE's target of 2%. Nevertheless, markets still expect rates to fall by around 48 basis points by the end of the year.
Bloomberg reported on Thursday that ‘US officials are preparing for a possible strike on Iran in the coming days.’ ‘US plans to attack Iran continue to evolve.’ Another Wall Street Journal report suggests that US President Trump approved plans to attack Iran on Tuesday but wanted to see if Tehran would abandon its nuclear programme.
In addition, the dollar was supported by comments from Federal Reserve Chairman Jerome Powell, who said that inflation remains slightly above target and may rise in the future, citing the impact of US President Donald Trump's tariffs.
The US Federal Reserve (Fed) decided at its June meeting on Wednesday, as expected, to leave the base rate unchanged in the range of 4.25-4.50%. The Federal Open Market Committee (FOMC) still forecasts interest rates to fall by about 50 basis points by the end of 2025.
Trading recommendation: SELL 1.34100, SL 1.34300, TP 1.33200
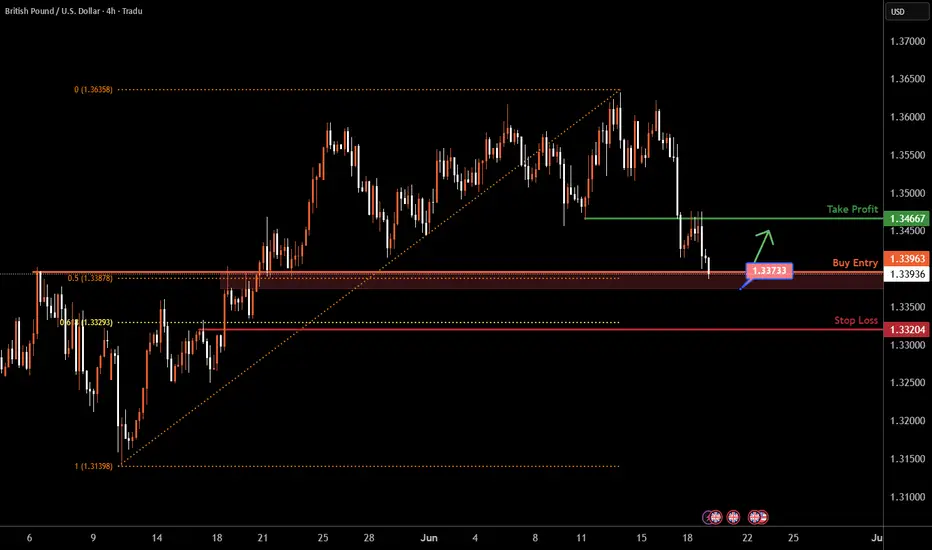
GBPUSD H4 I Bullish RiseBased on the H4 chart analysis, we can see that the price is trading near our buy entry at1.3373 -1.13396, which is a pullback support that aligns with the 50% Fib retracement.
Our take profit will be at 1.3466, which is an overlap resistance
The stop loss will be placed at 1.3320 which is a pullback support below the 61.8% Fib retracement.
High Risk Investment Warning
Trading Forex/CFDs on margin carries a high level of risk and may not be suitable for all investors. Leverage can work against you.
Stratos Markets Limited (tradu.com ):
CFDs are complex instruments and come with a high risk of losing money rapidly due to leverage. 63% of retail investor accounts lose money when trading CFDs with this provider. You should consider whether you understand how CFDs work and whether you can afford to take the high risk of losing your money.
Stratos Europe Ltd (tradu.com ):
CFDs are complex instruments and come with a high risk of losing money rapidly due to leverage. 63% of retail investor accounts lose money when trading CFDs with this provider. You should consider whether you understand how CFDs work and whether you can afford to take the high risk of losing your money.
Stratos Global LLC (tradu.com ):
Losses can exceed deposits.
Please be advised that the information presented on TradingView is provided to Tradu (‘Company’, ‘we’) by a third-party provider (‘TFA Global Pte Ltd’). Please be reminded that you are solely responsible for the trading decisions on your account. There is a very high degree of risk involved in trading. Any information and/or content is intended entirely for research, educational and informational purposes only and does not constitute investment or consultation advice or investment strategy. The information is not tailored to the investment needs of any specific person and therefore does not involve a consideration of any of the investment objectives, financial situation or needs of any viewer that may receive it. Kindly also note that past performance is not a reliable indicator of future results. Actual results may differ materially from those anticipated in forward-looking or past performance statements. We assume no liability as to the accuracy or completeness of any of the information and/or content provided herein and the Company cannot be held responsible for any omission, mistake nor for any loss or damage including without limitation to any loss of profit which may arise from reliance on any information supplied by TFA Global Pte Ltd.
The speaker(s) is neither an employee, agent nor representative of Tradu and is therefore acting independently. The opinions given are their own, constitute general market commentary, and do not constitute the opinion or advice of Tradu or any form of personal or investment advice. Tradu neither endorses nor guarantees offerings of third-party speakers, nor is Tradu responsible for the content, veracity or opinions of third-party speakers, presenters or participants.
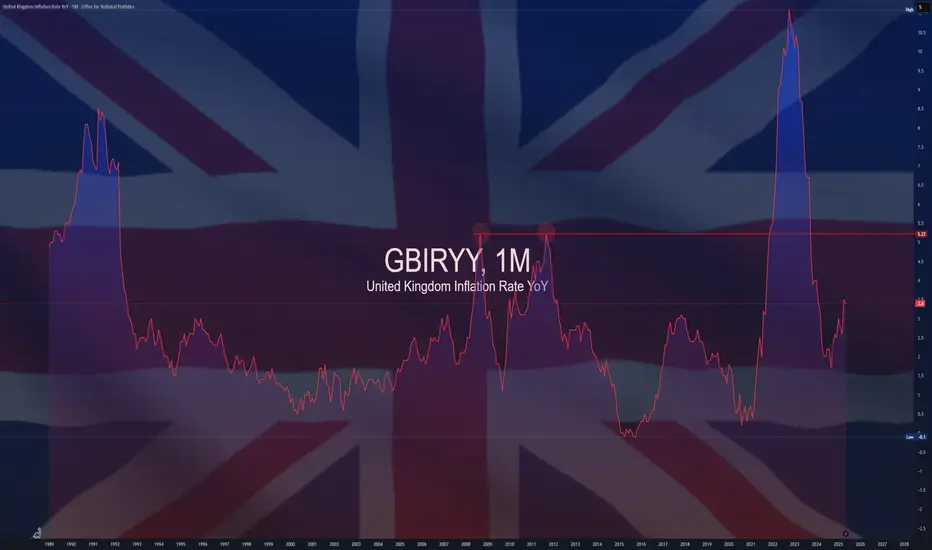
GBIRYY - U.K Inflation (May/2025)ECONOMICS:GBIRYY
May/2025
source: Office for National Statistics
-The annual inflation rate in the UK edged down to 3.4% in May 2025 from 3.5% in April, matching expectations.
The largest downward contribution came from transport prices (0.7% vs 3.3%), reflecting falls in air fares (-5%) largely due to the timing of Easter and the associated school holidays, as well as falling motor fuel prices.
Additionally, the correction of an error in the Vehicle Excise Duty series contributed to the drop; the error affected April’s data, but the series has been corrected from May.
Further downward pressure came from cost for housing and household services (6.9% vs 7%), mostly owner occupiers' housing costs (6.7% vs 6.9%).
Services inflation also slowed to 4.7% from 5.4%. On the other hand, the largest, upward contributions came from food and non-alcoholic beverages (4.4% vs 3.4%), namely chocolate, confectionery and ice cream, and furniture and household goods (0.8%, the most since December 2023).
Compared to the previous month, the CPI rose 0.2%.
GBPUSD London ShortsWhat I see and we could have one massive push down to setup a mid reversal today/tomorrow
Sterling Flat Before BoE and Fed Policy DecisionsGBP/USD trades near 1.3435 on Wednesday, steadying after a 1.2% drop Tuesday amid rising geopolitical tensions and safe-haven dollar demand.
The pound stays under pressure ahead of today’s UK inflation report and tomorrow’s BoE decision, where rates are expected to remain at 4.25%. Any inflation surprise could shift market expectations.
Ongoing Middle East conflict continues to support the dollar, while traders also await the Fed’s policy announcement later today, which could influence GBP/USD further.
Resistance is at 1.3600, with support around 1.3425.

GBPUSD SHORT FORECAST Q2 W25 D18 Y25GBPUSD SHORT FORECAST Q2 W25 D18 Y25
Professional Risk Managers👋
Welcome back to another FRGNT chart update📈
Diving into some Forex setups using predominantly higher time frame order blocks alongside confirmation breaks of structure.
Let’s see what price action is telling us today!
💡Here are some trade confluences📝
✅Weekly order block
✅15' order block
✅Intraday 15' break of structure
✅Tokyo ranges to be filled
🔑 Remember, to participate in trading comes always with a degree of risk, therefore as professional risk managers it remains vital that we stick to our risk management plan as well as our trading strategies.
📈The rest, we leave to the balance of probabilities.
💡Fail to plan. Plan to fail.
🏆It has always been that simple.
❤️Good luck with your trading journey, I shall see you at the very top.
🎯Trade consistent, FRGNT X

GBPUSD - Analysis (18th June 2025)Here is an analysis on Cable, and basically showcasing how I would form a bias, a narrative, an potential trade setups.
I hope it is insightful for you.
- R2F Trading

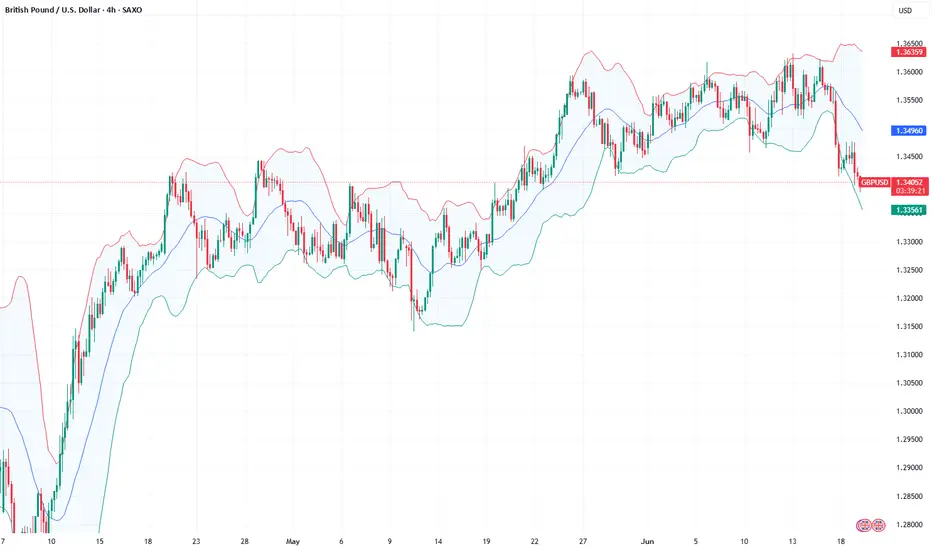
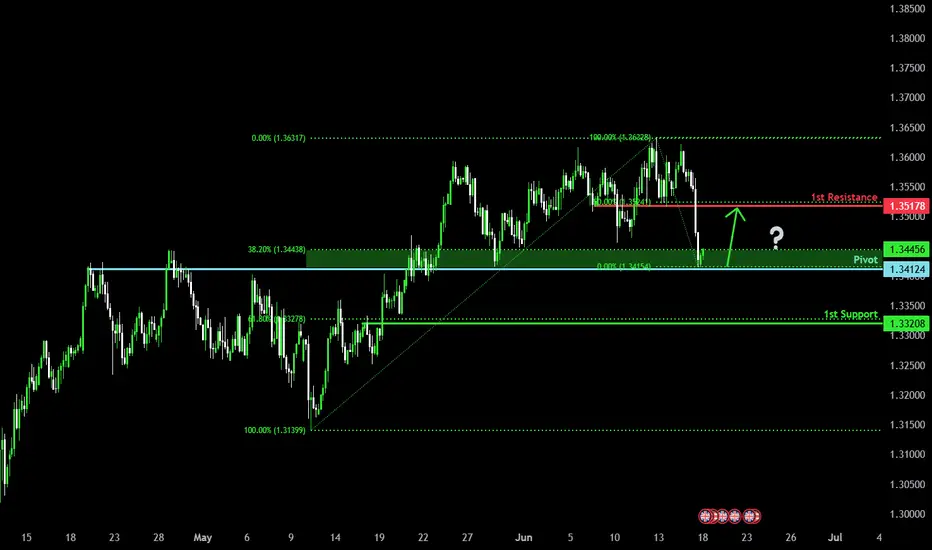
Bullish reversal off overlap support?The Cable (GBP/USD) has bounced off the pivot and could rise to the 50% Fibonacci resistance.
Pivot: 1.3412
1st Support: 1.3320
1st Resistance: 1.3517
Risk Warning:
Trading Forex and CFDs carries a high level of risk to your capital and you should only trade with money you can afford to lose. Trading Forex and CFDs may not be suitable for all investors, so please ensure that you fully understand the risks involved and seek independent advice if necessary.
Disclaimer:
The above opinions given constitute general market commentary, and do not constitute the opinion or advice of IC Markets or any form of personal or investment advice.
Any opinions, news, research, analyses, prices, other information, or links to third-party sites contained on this website are provided on an "as-is" basis, are intended only to be informative, is not an advice nor a recommendation, nor research, or a record of our trading prices, or an offer of, or solicitation for a transaction in any financial instrument and thus should not be treated as such. The information provided does not involve any specific investment objectives, financial situation and needs of any specific person who may receive it. Please be aware, that past performance is not a reliable indicator of future performance and/or results. Past Performance or Forward-looking scenarios based upon the reasonable beliefs of the third-party provider are not a guarantee of future performance. Actual results may differ materially from those anticipated in forward-looking or past performance statements. IC Markets makes no representation or warranty and assumes no liability as to the accuracy or completeness of the information provided, nor any loss arising from any investment based on a recommendation, forecast or any information supplied by any third-party.
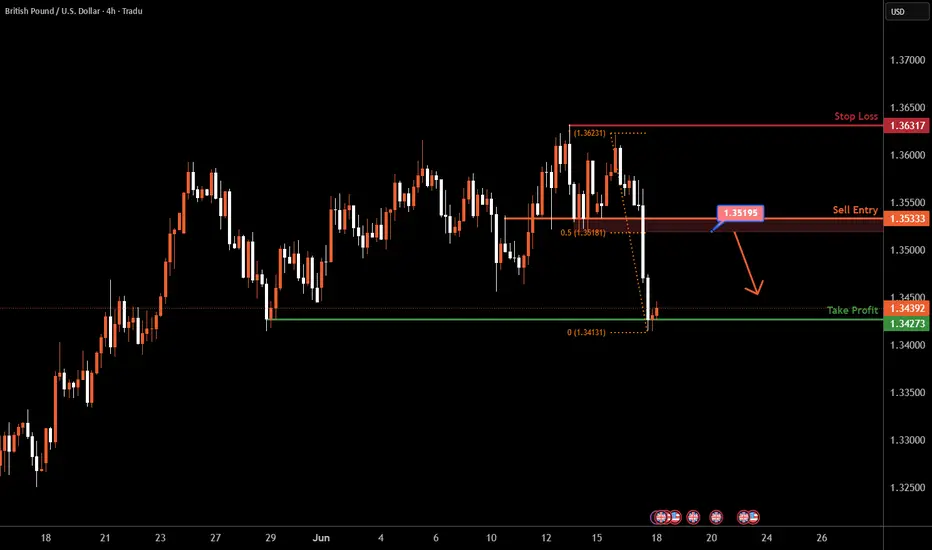
GBPUSD H4 I Bearish Reversal Based on the H4 chart, the price is rising toward our sell entry level at 1.3519 - 1.3533, a pullback resistance that aligns closely with the 50% Fib retracement.
Our take profit is set at 1.3427, a swing low support.
The stop loss is set at 1.3631, a swing high resistance.
High Risk Investment Warning
Trading Forex/CFDs on margin carries a high level of risk and may not be suitable for all investors. Leverage can work against you.
Stratos Markets Limited (tradu.com ):
CFDs are complex instruments and come with a high risk of losing money rapidly due to leverage. 63% of retail investor accounts lose money when trading CFDs with this provider. You should consider whether you understand how CFDs work and whether you can afford to take the high risk of losing your money.
Stratos Europe Ltd (tradu.com ):
CFDs are complex instruments and come with a high risk of losing money rapidly due to leverage. 63% of retail investor accounts lose money when trading CFDs with this provider. You should consider whether you understand how CFDs work and whether you can afford to take the high risk of losing your money.
Stratos Global LLC (tradu.com ):
Losses can exceed deposits.
Please be advised that the information presented on TradingView is provided to Tradu (‘Company’, ‘we’) by a third-party provider (‘TFA Global Pte Ltd’). Please be reminded that you are solely responsible for the trading decisions on your account. There is a very high degree of risk involved in trading. Any information and/or content is intended entirely for research, educational and informational purposes only and does not constitute investment or consultation advice or investment strategy. The information is not tailored to the investment needs of any specific person and therefore does not involve a consideration of any of the investment objectives, financial situation or needs of any viewer that may receive it. Kindly also note that past performance is not a reliable indicator of future results. Actual results may differ materially from those anticipated in forward-looking or past performance statements. We assume no liability as to the accuracy or completeness of any of the information and/or content provided herein and the Company cannot be held responsible for any omission, mistake nor for any loss or damage including without limitation to any loss of profit which may arise from reliance on any information supplied by TFA Global Pte Ltd.
The speaker(s) is neither an employee, agent nor representative of Tradu and is therefore acting independently. The opinions given are their own, constitute general market commentary, and do not constitute the opinion or advice of Tradu or any form of personal or investment advice. Tradu neither endorses nor guarantees offerings of third-party speakers, nor is Tradu responsible for the content, veracity or opinions of third-party speakers, presenters or participants.
GBPUSD:Sharing of the Latest Trading StrategyAll the trading signals today have resulted in profits!!! Check it!!!👉👉👉
Fundamental Analysis:
The UK-India Free Trade Agreement provides long-term bullish support for GBP.
The IMF raised the UK's 2025 growth forecast from 1.1% to 1.2%, boosting market confidence in the pound.
Global trade tensions indirectly underpin GBP.
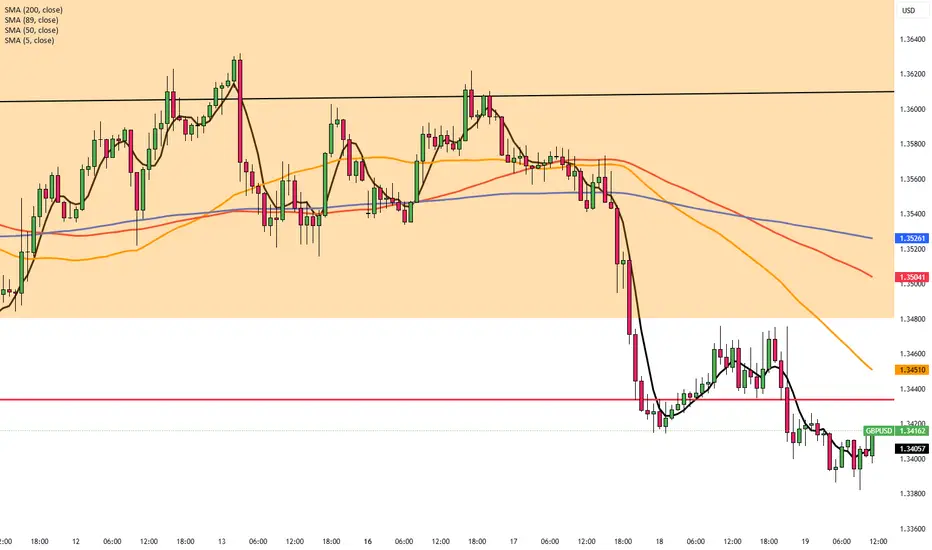
Technical Analysis :
GBP is in a rebound uptrend. Short-term 5/10-day moving averages are converging, and Bollinger Bands show slight narrowing, indicating a neutral bias.
MACD death cross with shrinking red momentum (bearish).
RSI edges up near 65 with limited upside (neutral).
KD golden cross diverging upward from near oversold (bullish).
Trading Strategy:
Enter light longs at 1.3400 if supported.
buy@1.3400–1.3410
TP:1.3500-1.3550
Share accurate trading signals daily—transform your life starting now!
👇 👇 👇 Obtain signals👉👉👉

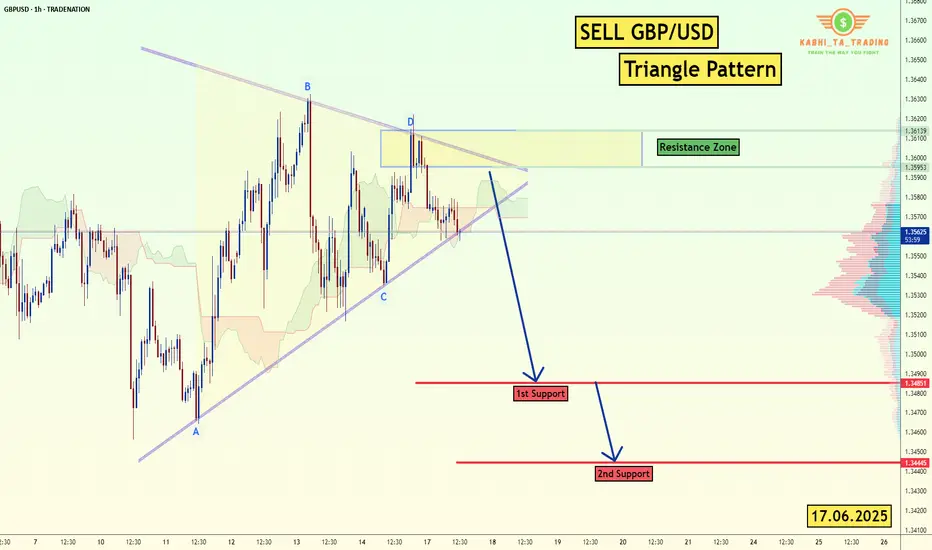
GBP/USD - H1-Triangle Breakout (17.06.2025)The GBP/USD Pair on the H1 timeframe presents a Potential Selling Opportunity due to a recent Formation of a Triangle Breakout Pattern. This suggests a shift in momentum towards the downside in the coming hours.
Possible Short Trade:
Entry: Consider Entering A Short Position around Trendline Of The Pattern.
Target Levels:
1st Support – 1.3485
2nd Support – 1.3444
🎁 Please hit the like button and
🎁 Leave a comment to support for My Post !
Your likes and comments are incredibly motivating and will encourage me to share more analysis with you.
Best Regards, KABHI_TA_TRADING
Thank you.
Disclosure: I am part of Trade Nation's Influencer program and receive a monthly fee for using their TradingView charts in my analysis.
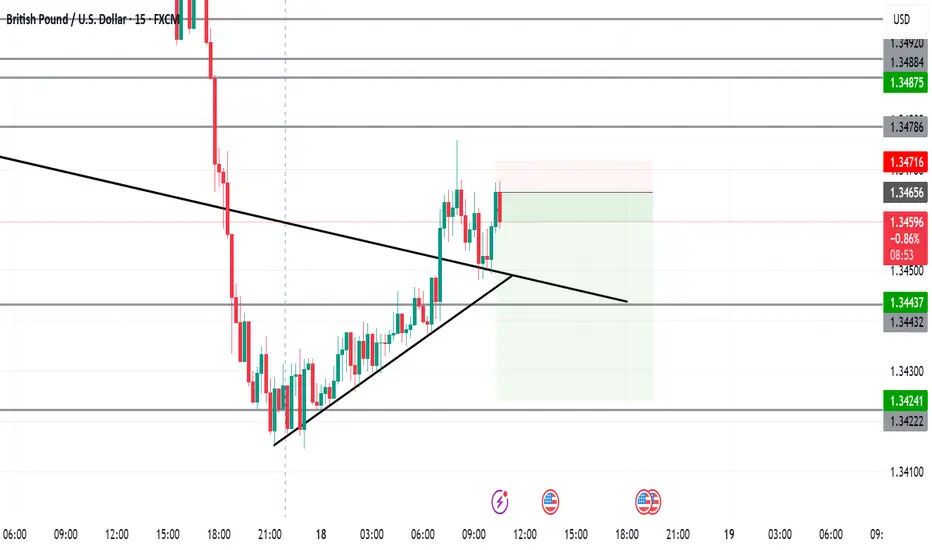
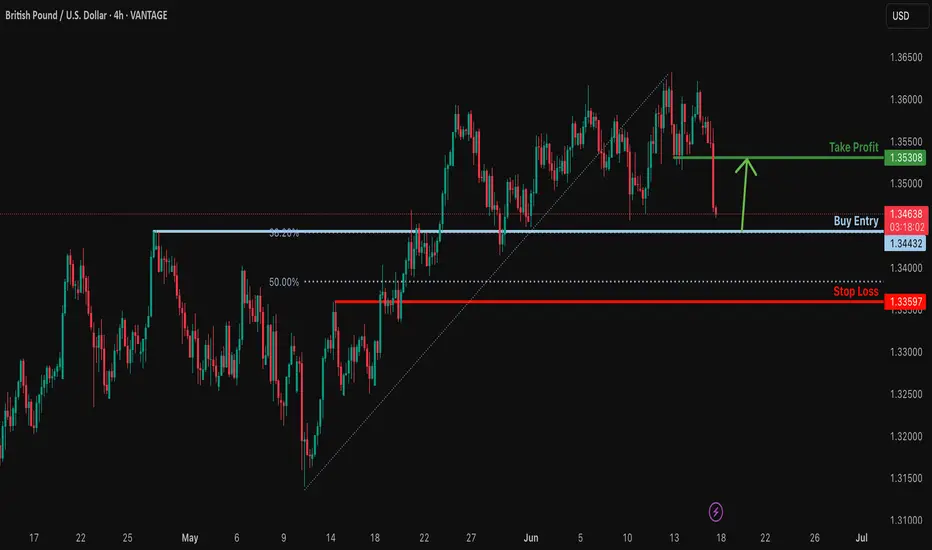
Bullish bounce off overlap support?GBP/USD is falling towards the support level which is an overlap support that aligns with the 38.2% Fibonacci retracement and could bounce from this level to our take profit.
Entry: 1.3443
Why we like it:
There is an overlap support level.
Stop loss: 1.3359
Why we like it:
There is a pullback support that is slightly below the 50% Fibonacci retracement.
Take profit: 1.3530
Why we like it:
There is a pullback resistance level.
njoying your TradingView experience? Review us!
Please be advised that the information presented on TradingView is provided to Vantage (‘Vantage Global Limited’, ‘we’) by a third-party provider (‘Everest Fortune Group’). Please be reminded that you are solely responsible for the trading decisions on your account. There is a very high degree of risk involved in trading. Any information and/or content is intended entirely for research, educational and informational purposes only and does not constitute investment or consultation advice or investment strategy. The information is not tailored to the investment needs of any specific person and therefore does not involve a consideration of any of the investment objectives, financial situation or needs of any viewer that may receive it. Kindly also note that past performance is not a reliable indicator of future results. Actual results may differ materially from those anticipated in forward-looking or past performance statements. We assume no liability as to the accuracy or completeness of any of the information and/or content provided herein and the Company cannot be held responsible for any omission, mistake nor for any loss or damage including without limitation to any loss of profit which may arise from reliance on any information supplied by Everest Fortune Group.
#GBPUSD: Smaller Time-Frame Tells A Different Story! GBPUSD has exhibited strong bullish sentiment in shorter timeframes. However, an analysis of shorter timeframes reveals a different picture. The current price trend is upward, and it is anticipated to continue. Nevertheless, we anticipate a price correction around 1.3470, followed by a continuation of the bullish move. We strongly recommend conducting your own analysis before making any investment decisions.
Best of luck in your trading endeavours, and please remember to prioritise safety.
Kindly consider liking, commenting, and sharing this analysis for further insights.
Team Setupsfx_
GBPUSD Will Collapse! SELL!
My dear friends,
Please, find my technical outlook for GBPUSD below:
The price is coiling around a solid key level - 1.3619
Bias - Bearish
Technical Indicators: Pivot Points Low anticipates a potential price reversal.
Super trend shows a clear sell, giving a perfect indicators' convergence.
Goal - 1.3570
Safe Stop Loss - 1.3649
About Used Indicators:
The pivot point itself is simply the average of the high, low and closing prices from the previous trading day.
Disclosure: I am part of Trade Nation's Influencer program and receive a monthly fee for using their TradingView charts in my analysis.
———————————
WISH YOU ALL LUCK
GBPUSD - Next point of interestAfternoon All,
So our GBPUSD trade from earlier didn't quite go to plan however I knew full well that we were building liquidity to the left on the higher timeframe.
This will be my next point of interest for a potential long.
Lets see how price plays out when we get down there.
GBPUSD: Expecting Bullish Movement! Here is Why:
It is essential that we apply multitimeframe technical analysis and there is no better example of why that is the case than the current GBPUSD chart which, if analyzed properly, clearly points in the upward direction.
Disclosure: I am part of Trade Nation's Influencer program and receive a monthly fee for using their TradingView charts in my analysis.
❤️ Please, support our work with like & comment! ❤️
