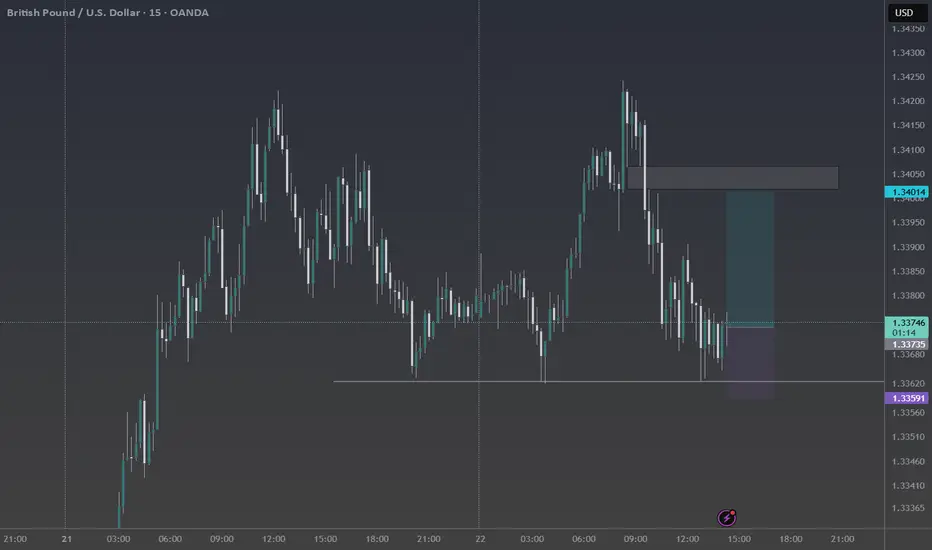
GBPUSD long before a short term bearish retracementBased on my technical analysis, it looks like GBPUSD wants to fill a small imbalance at the 1.34010 range before making a bigger retracement down. We also have a triple bottom forming at 1.3362 area which supports a move to the upside.
GBPUSD
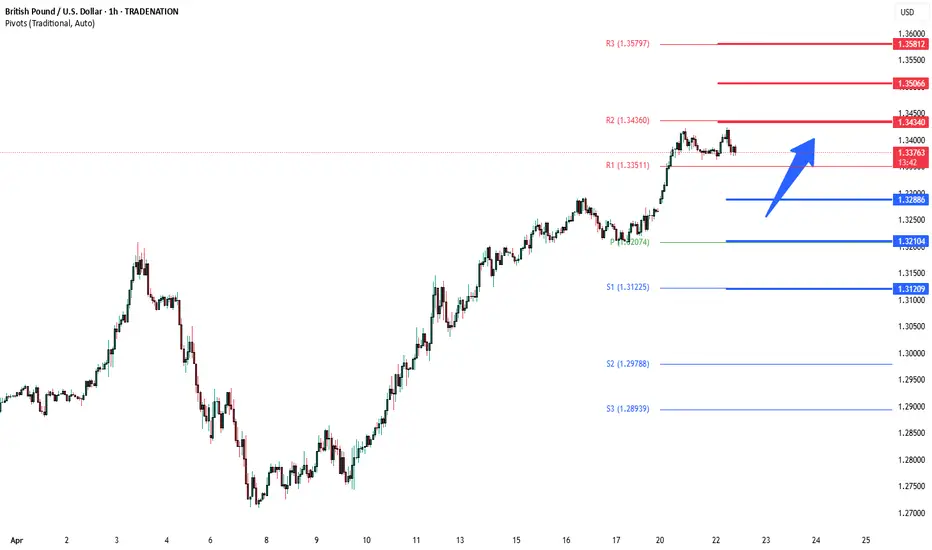
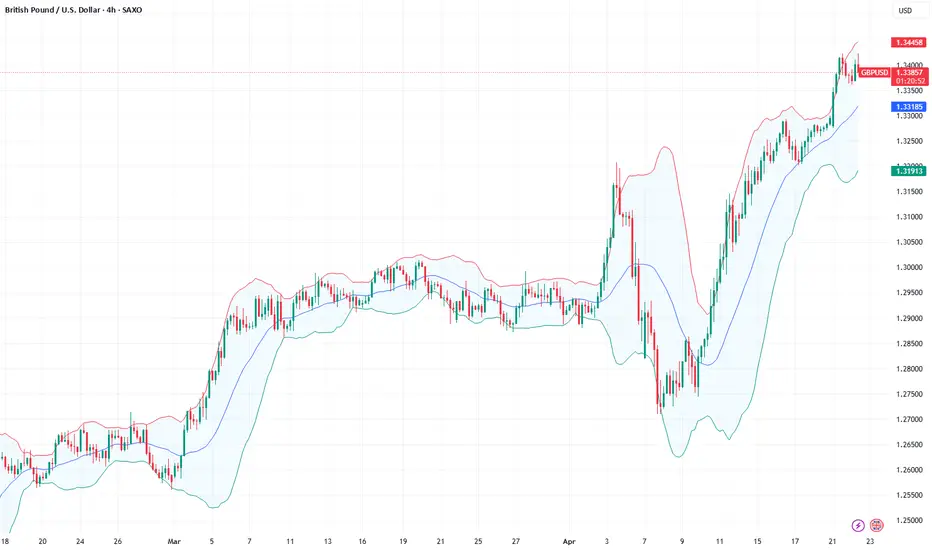
GBPUSD INTRADAY bullish breakout supported at 1.3288GBP/USD maintains a bullish bias, with the broader trend and structure supporting upside continuation. The recent intraday move appears to be a bullish breakout toward a key prior consolidation area.
Key Support: 1.3288 – aligns with the previous consolidation zone and potential bullish inflection point.
Upside Targets:
1.3435 – initial resistance level
1.3500 and 1.3580 – medium to long-term bullish targets
If price finds support at 1.3288 and forms a bullish reversal, it would confirm the continuation of the uptrend toward the mentioned resistance levels.
However, a break and daily close below 1.3288 would invalidate the bullish scenario, suggesting deeper retracement toward 1.3210, with further support at 1.3120 and 1.2980.
Conclusion
GBP/USD remains bullish above 1.3288. Look for a bounce from this level to confirm upside continuation. A daily close below 1.3288 would turn the outlook bearish, exposing lower support levels.
This communication is for informational purposes only and should not be viewed as any form of recommendation as to a particular course of action or as investment advice. It is not intended as an offer or solicitation for the purchase or sale of any financial instrument or as an official confirmation of any transaction. Opinions, estimates and assumptions expressed herein are made as of the date of this communication and are subject to change without notice. This communication has been prepared based upon information, including market prices, data and other information, believed to be reliable; however, Trade Nation does not warrant its completeness or accuracy. All market prices and market data contained in or attached to this communication are indicative and subject to change without notice.
EURUSD and GBPUSD Analysis todayHello traders, this is a complete multiple timeframe analysis of this pair. We see could find significant trading opportunities as per analysis upon price action confirmation we may take this trade. Smash the like button if you find value in this analysis and drop a comment if you have any questions or let me know which pair to cover in my next analysis.

GBP/USD is Overbought at Critical Resistance LevelFenzoFx—GBP/USD climbed to $1.3435, a key resistance near the September 2024 high. While the trend remains bullish, overbought signals from Stochastic and RSI-14 suggest limited upside.
If the pair stays below $1.3435, it may retreat to 1.3295 or even 1.3202.
>>> No Deposit Bonus
>>> %100 Deposit Bonus
>>> Forex Analysis Contest
All at FenzoFx Decentralized Forex Broker

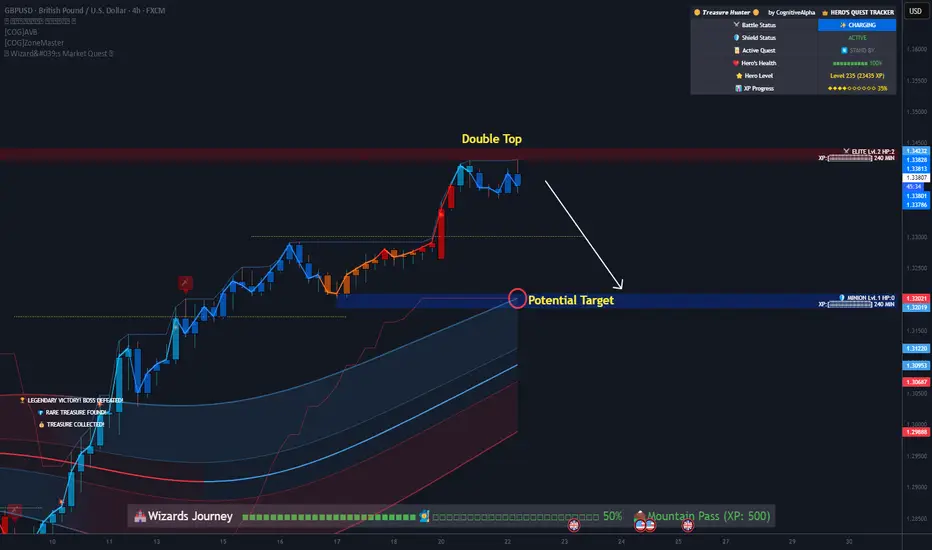
GBP/USD: The Wizard's Descent from the Double Top MountainGBP/USD: The Wizard's Descent from the Double Top Mountain
Technical Analysis:
GBP/USD 4H chart shows a clear Double Top formation at approximately 1.3725, a critical resistance level
The Treasure Hunter indicator has shifted color, signaling bearish momentum building (Hero taking damage)
Our Wizard's Journey progress bar indicates we're at 50% completion of the Mountain Pass, suggesting we're at a prime reversal point
Currently testing Elite Level 235 resistance zone (2345 XP), with declining XP Progress (35%)
Forecast:
Anticipating a significant pullback from current resistance
Initial Minion Zone at 1.3200 provides first target level
Watch for confirmation with HERO's Health declining from current 100%
Trading Strategy:
Short position opportunity forming with ELITE LvL 2 resistance rejecting price advance
Stop loss placement above Double Top at 1.3750
Risk/reward favorable with multiple support levels to target
Watch 4H candle closes below 1.3690 for entry confirmation
Quest Status: Active - Prepare for the wizard's descent from the mountain peak!
Fundamental Market Analysis for April 22, 2025 GBPUSDGBPUSD:
The GBP/USD pair is trading in positive territory around 1.3370 during the early Asian session on Tuesday. Concerns over slowing growth in the United States (US) and worries over the independence of the Federal Reserve (Fed) are driving the US Dollar (USD) lower and creating a tailwind for the major pair.
US President Donald Trump condemned Powell for continuing to maintain a “wait-and-see” monetary policy until there is clarity on how the new tariff policy will affect the economic outlook. In a Truth social media post, Trump warned that the US economy will slow down if Powell doesn't cut interest rates immediately.
Heightened uncertainty surrounding Trump's tariffs and rising trade tensions between the U.S. and China are undermining the U.S. dollar across the board.
On the other hand, softer UK consumer price index (CPI) inflation data for March and global uncertainty paved the way for an interest rate cut by the Bank of England (BoE) at its May meeting. Financial markets are now betting on an interest rate cut at the Bank of England's May meeting, estimating an 86% probability of this happening, according to LSEG data. This, in turn, could affect the Pound Sterling (GBP) exchange rate against the US Dollar.
Trading recommendation: BUY 1.3425, SL 1.3395, TP 1.3510
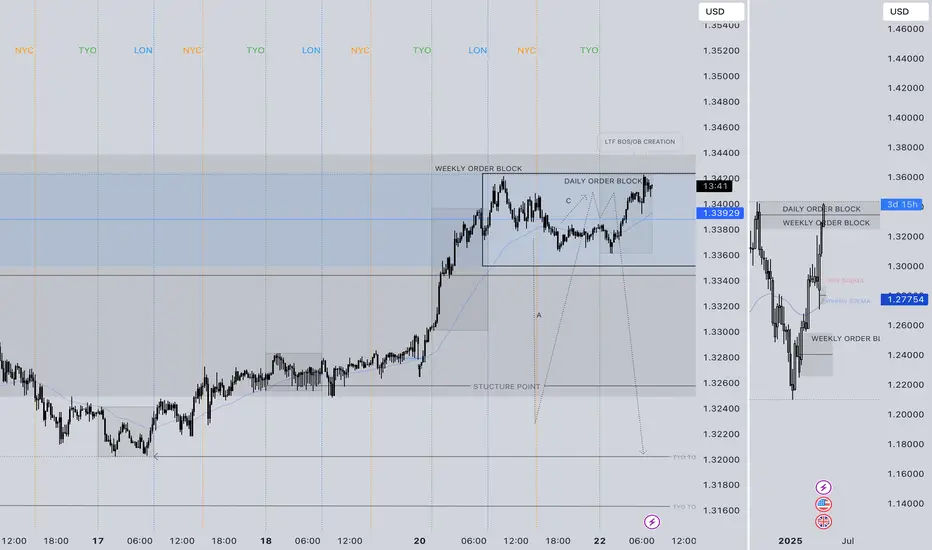
GBPUSD SHORT FORECAST Q2 W17 D23 Y25GBPUSD SHORT FORECAST Q2 W17 D23 Y25
SUMMARY
- Weekly order block
- Daily order block
- Price action bullish in current point of interest.
REQUIREMNTS
- Setup A) Substantial 15' break of structure, creating 15' order block to short from on the pull back.
- Setup C) Lower time frame break of structure without initial 15' break of structure.
- Candle stick formation confluences.
FRGNT X
IG - JCFRGNT
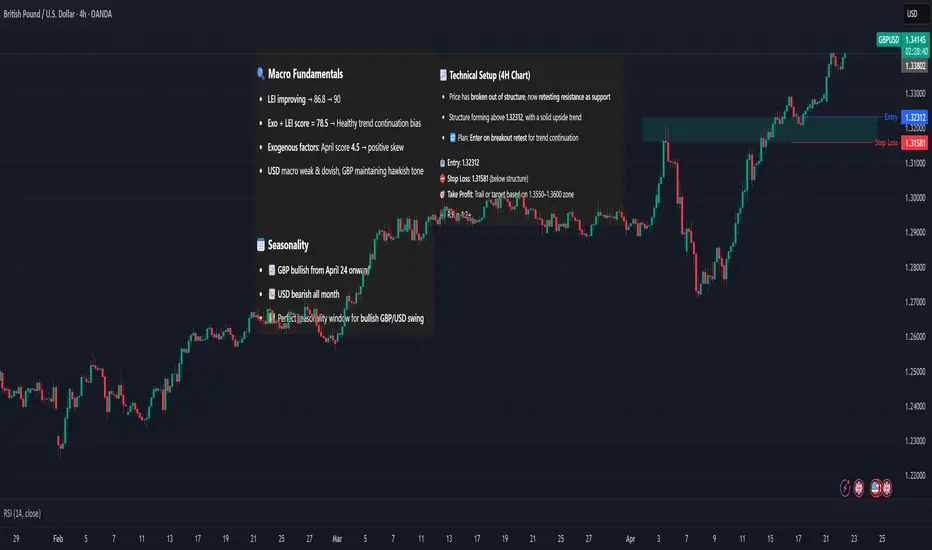
GBP/USD – Breakout Retest Setup🔍 Macro Fundamentals
LEI improving → 86.8 → 90
Exo + LEI score = 78.5 → Healthy trend continuation bias
Exogenous factors: April score 4.5 → positive skew
USD macro weak & dovish, GBP maintaining hawkish tone
📅 Seasonality
📈 GBP bullish from April 24 onward
📉 USD bearish all month
✅ Perfect seasonality window for bullish GBP/USD swing
📊 COT Sentiment
Both GBP and USD = ⚖️ Neutral
→ No positioning pressure, clean technical entry expected
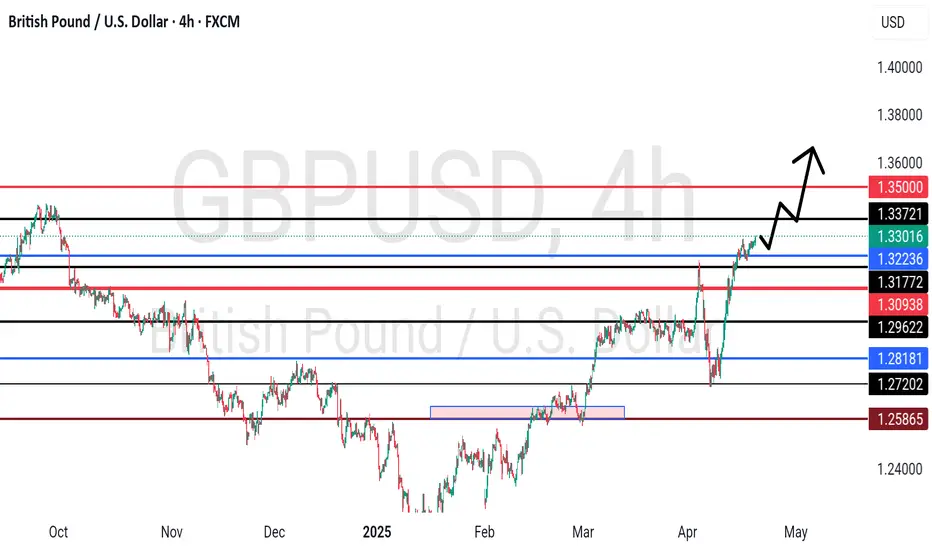
📈 Technical Setup (4H Chart)
Price has broken out of structure, now retesting resistance as support
Structure forming above 1.32312, with a solid upside trend
🔁 Plan: Enter on breakout retest for trend continuation
📥 Entry: 1.32312
⛔ Stop Loss: 1.31581 (below structure)
🎯 Take Profit: Trail or target based on 1.3550–1.3600 zone
🧮 R:R ≈ 1:2+
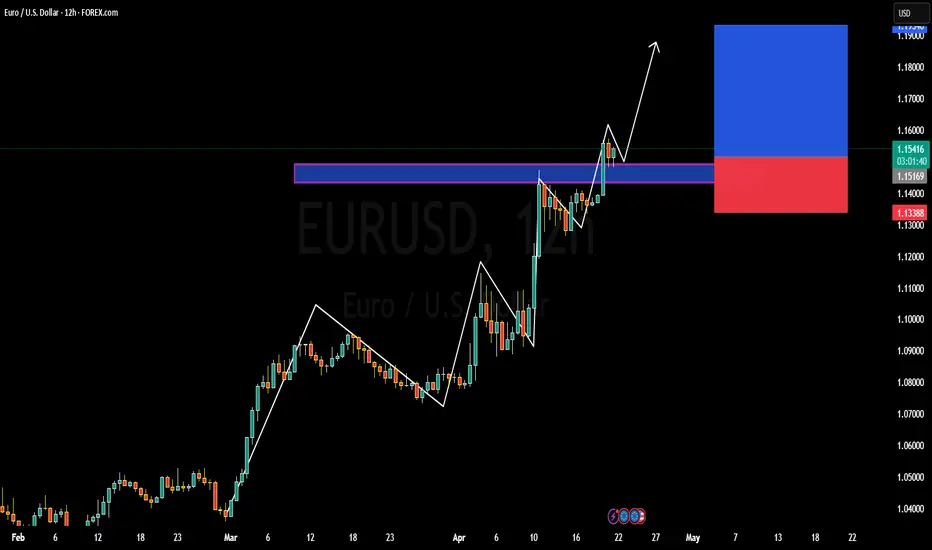
WHY EURUSD IS STILL BULLISH DETAILED ANALYSIS We closely monitoring EUR/USD, which is currently trading around 1.0430. The pair has shown resilience after rebounding from the 1.0220 support level, forming a bullish engulfing pattern on the 3-day chart. This pattern suggests potential for a bullish reversal, especially as the Relative Strength Index (RSI) recovers from oversold conditions. The price action aligns with the lower boundary of a long-term descending channel, indicating a possible shift in trend.
Fundamentally, the euro is under pressure due to the European Central Bank's (ECB) recent rate cut to 2.25%, marking the seventh reduction since mid-2024. This move aims to counteract the economic slowdown exacerbated by U.S. tariffs on EU imports. In contrast, the U.S. dollar faces its challenges, with political tensions arising from President Trump's criticism of Federal Reserve Chair Jerome Powell for not cutting rates swiftly. These dynamics have led to increased volatility and a weakened dollar, influencing EUR/USD movements.
Technically, the ascending triangle pattern observed on the 4-hour chart supports a bullish outlook. A decisive break above the 1.0625 resistance could pave the way for targets at 1.0760 and subsequently 1.0850. However, traders should remain cautious, as a drop below the 1.0220 support might signal a continuation of the bearish trend, potentially testing parity levels.
In the current market environment, it's crucial to stay updated with economic indicators and geopolitical developments. Key events, such as U.S. Non-Farm Payrolls and Eurozone inflation data, will provide further insights into the pair's direction. Employing sound risk management strategies and staying informed will be essential for navigating the EUR/USD landscape effectively.
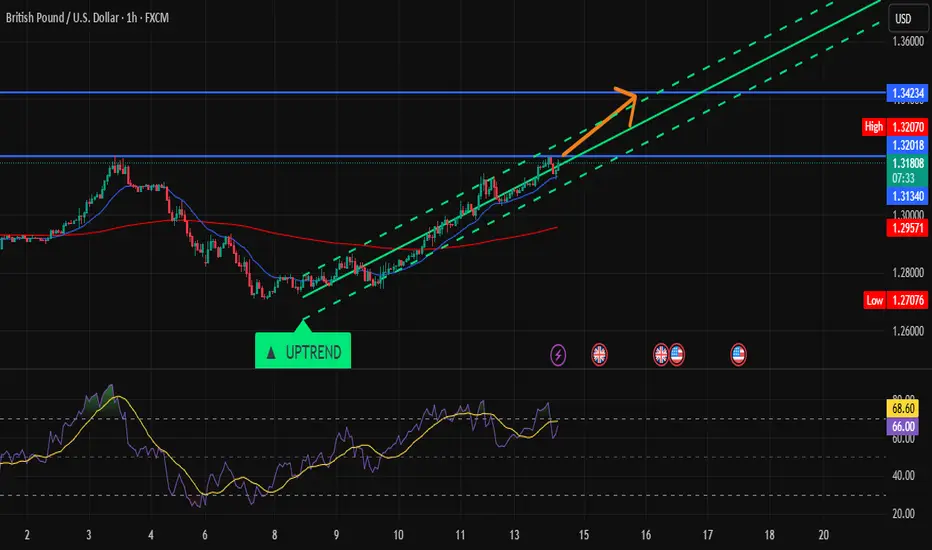
GBP/USD Ready for Takeoff!Hi Traders ! Price action remains strong within the uptrend channel, supported by the 20 EMA, while the 200 EMA stays well below—confirming bullish momentum.
Target zone: 1.34234
RSI shows strength with more room to rise.
Stay sharp, traders! If the price continues to respect the channel, we might see a strong bullish push soon.
📌 Disclaimer:
This content is for educational and informational purposes only and does not constitute financial advice. Always do your own analysis and consult with a professional before making trading decisions.
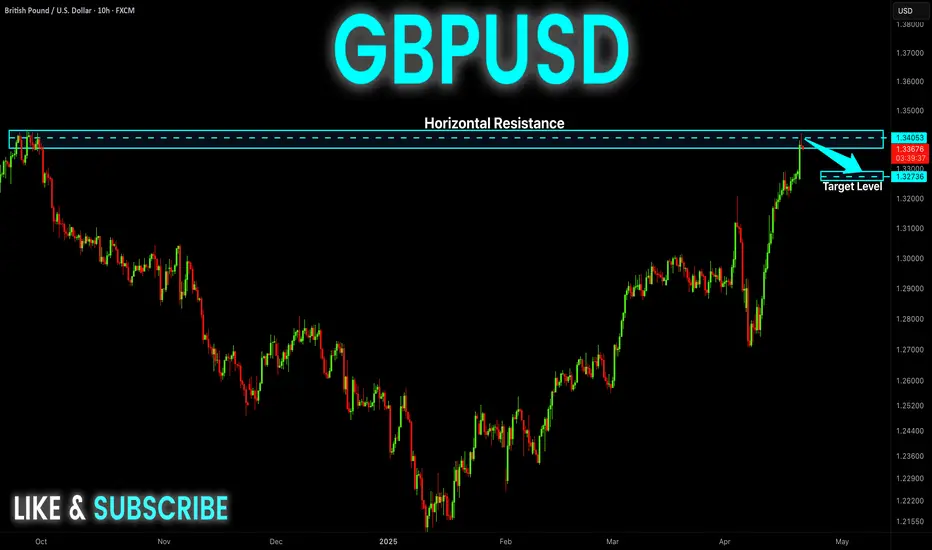
GBP-USD Short From Resistance! Sell!
Hello,Traders!
GBP-USD went up sharply
Made a retest of the
Horizontal resistance level
Of 1.3432 from where we
Are already seeing a local
Bearish reaction so we
Are locally bearish biased
And we will be expecting
A local bearish correction
Sell!
Comment and subscribe to help us grow!
Check out other forecasts below too!
Disclosure: I am part of Trade Nation's Influencer program and receive a monthly fee for using their TradingView charts in my analysis.
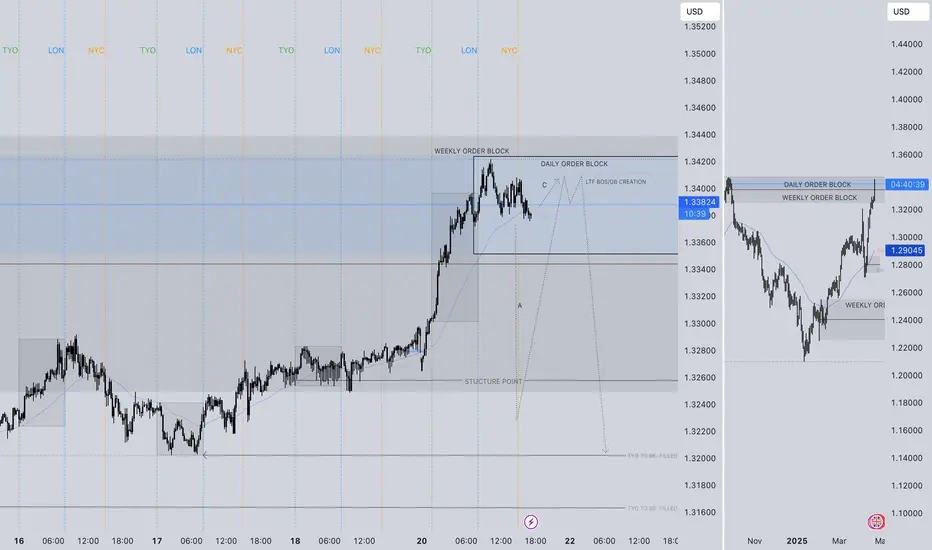
GBPUSD SHORT FORECAST Q2 W17 D22 Y25GBPUSD SHORT FORECAST Q2 W17 D22 Y25
SUMMARY
- Weekly order block
- Daily order block
- Price action bullish in current point of interest.
REQUIREMNTS
- Setup A) Substantial 15' break of structure, creating 15' order block to short from on the pull back.
- Setup C) Lower time frame break of structure without initial 15' break of structure.
- Candle stick formation confluences.
FRGNT X
IG - JCFRGNT
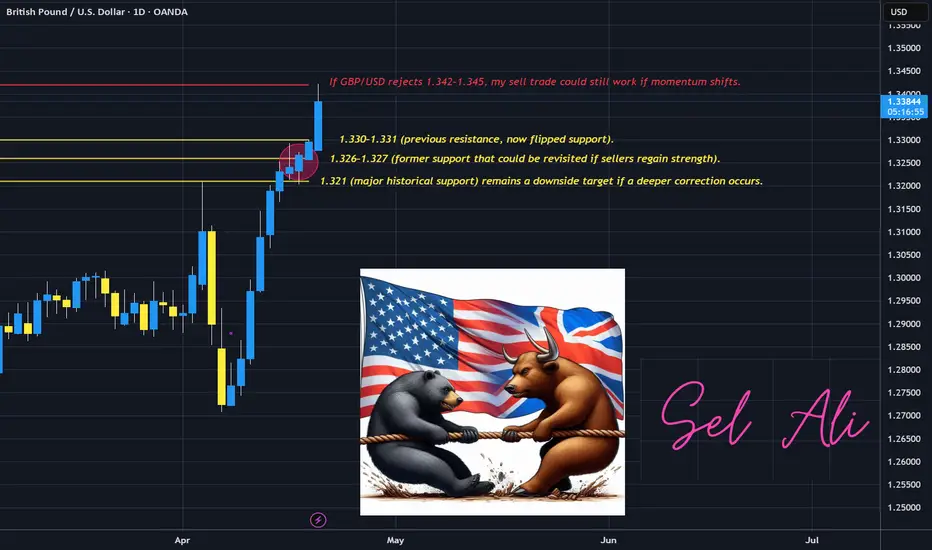
GBPUSD Let’s see if sellers step in.GBP/USD Trade Update: Holding My Sell at 1.32480
I entered a sell trade at 1.32480, expecting a reversal based on key technical and fundamental setups. But with GBP/USD now sitting at 1.33814, I have to reassess market conditions while still staying true to my trading approach.
Fundamental Overview – Why I Still Favor Downside
This week’s economic events could create volatility, and I’m paying close attention to:
UK PMI (April 23): Expected declines in Manufacturing (44.1) and Services (51.0) suggest economic weakness, which could weigh on GBP.
US Durable Goods Orders (April 24): Mixed expectations—headline at +1.8%, but ex-defense and transportation are negative, meaning uncertainty in USD strength.
UK Retail Sales (April 25): Forecasted at -0.3%, signaling weaker consumer spending. This aligns with my sell bias, as slowing UK economic data could trigger renewed selling pressure.
If the UK data disappoints, GBP/USD could struggle to hold higher levels, reinforcing my trade.
Technical & Price Action Analysis
Resistance Holding at 1.342–1.345:
Strong resistance is forming here. If bulls fail to push past this zone, my sell trade could still play out.
Wick formations near this level suggest some rejection, but confirmation is needed.
Key Support Levels for a Potential Drop:
1.330–1.331 (Flipped Resistance, Now Support) – Watching if price retests this zone.
1.326–1.327 (Major Support) – If momentum shifts, price could revisit this area.
1.321 (Stronger Support) – If price weakens further, this becomes my downside target.
Momentum is slowing, but the bullish trend is still intact unless price rejects at 1.342–1.345.
Volume Profile & Institutional Behavior – Are Big Players Selling?
Signs of Institutional Unloading:
Buy-side orders appear strong, but price is not breaking higher with conviction. This could mean large traders are selling into the rally.
Watching for a delta imbalance where buyers dominate order flow, but price fails to rise. This is a classic distribution sign.
Why This Matters: If institutions are offloading positions near 1.342–1.345, we could see price stall and reverse. My focus is on whether this resistance holds or breaks. That will define whether my sell trade remains valid.
My Trade Management Plan – Staying Patient
As a daily trader, I wait for the daily candle close before making adjustments.
If price rejects 1.342–1.345, I’ll hold my position with targets back toward 1.330–1.327.
If price breaks above resistance and holds, I may need to reevaluate my stop-loss placement.
Final Thoughts – Trusting My Process
I’m still holding my sell at 1.32480, but I recognize that buyers are testing key resistance. If institutions are quietly distributing, we could see a shift back to the bearish side, but I’m waiting for confirmation at the daily close.
I’ll update once the daily candle closes. Let’s see if sellers step in.
GBPUSDHello Traders! 👋
What are your thoughts on GBPUSD?
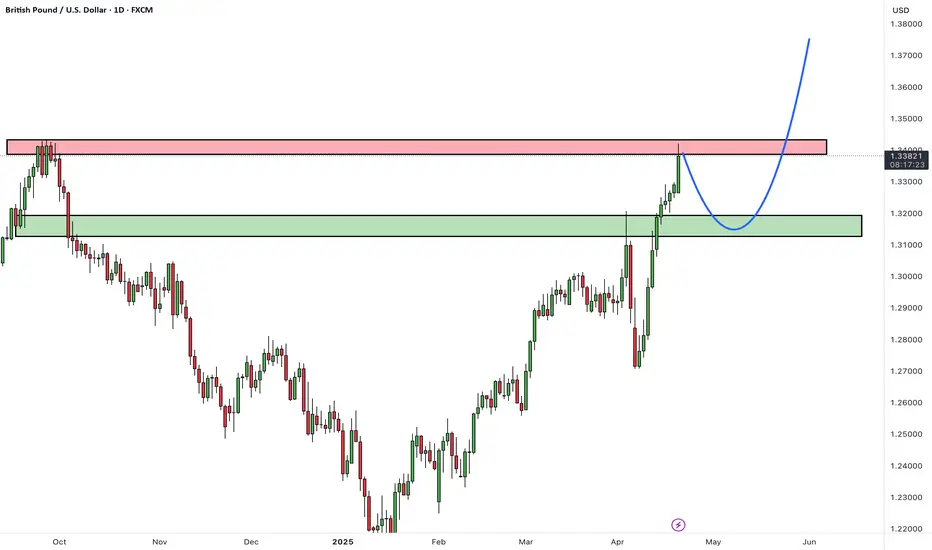
GBPUSD has reached a resistance zone, where a correction is expected.
We anticipate a pullback toward the specified support level, which could act as a launchpad for the next bullish move.
After completing the correction, the pair is expected to resume its upward movement toward the specified targets.
Will GBPUSD use the pullback as a springboard for further gains? Share your thoughts below!
Don’t forget to like and share your thoughts in the comments! ❤️
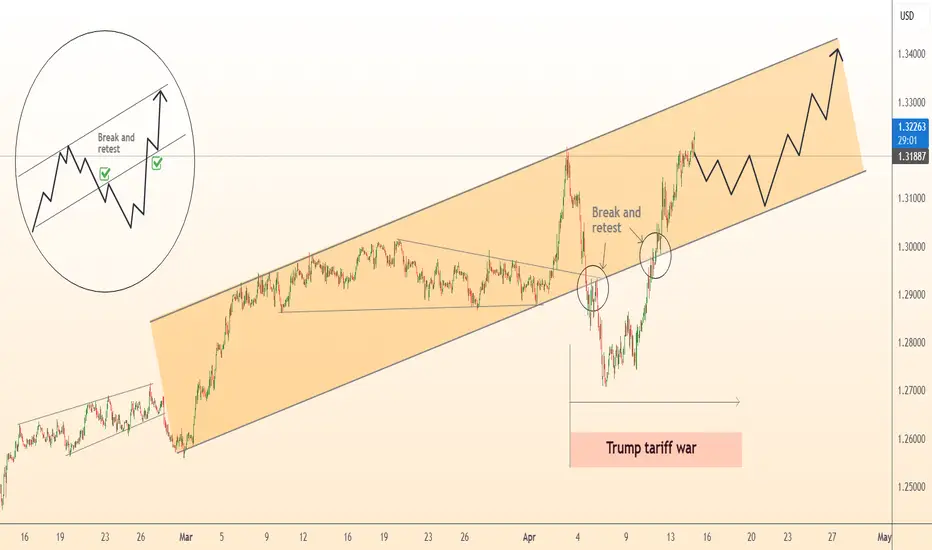
DeGRAM | GBPUSD Strengthening Pound📊 Technical Analysis
- Uptrending channel
The GBP/USD pair is moving steadily within the ascending channel, having recently tested key support levels (“break and retest”).
- Key Resistance
Immediate resistance at $1.32; a break of this level means further strengthening of bullish sentiment.
- Predicted Scenario
A confirmed break above $1.32 opens the way to 1.33.
Fundamental Analysis 💡
Strong UK wage growth (5.9%) and GDP growth (0.5%) support GBP strength. A weaker USD amid easing trade tensions also favors GBP/USD.
✨ Summary
Positive fundamentals complement a clear bullish technical situation. Keep a close eye on a break above $1.32 to confirm the continuation of GBP/USD upside!
-------------------
Share your opinion in the comments and support the idea with a like. Thanks for your support!
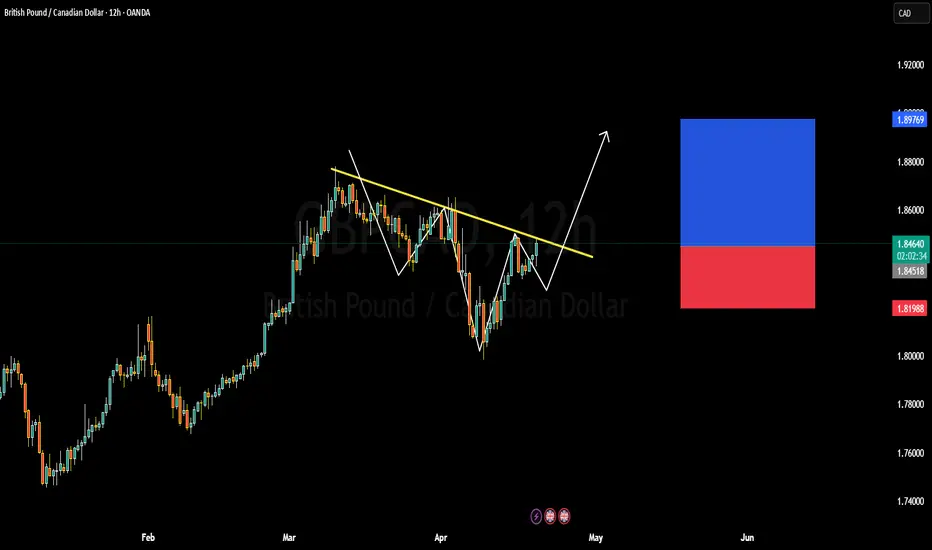
GBPCAD IS BULLISH OR BEARISH DETAILED ANALYSISGBPCAD is currently presenting a high-probability bullish setup after a textbook inverse head and shoulders formation on the 12H chart. Price is now hovering around 1.8457 and has just broken out above the descending trendline acting as neckline resistance. This structural shift, combined with clean bullish price action, signals the potential beginning of a fresh upward leg toward the 1.8976 region, a prior key supply zone and the projected target based on the measured move technique from the pattern.
From a fundamental standpoint, the British Pound is supported by hawkish BoE rhetoric and stronger-than-expected UK inflation data. Sticky core CPI and a robust labor market are keeping interest rate expectations elevated, which strengthens GBP across the board. In contrast, the Canadian Dollar remains under pressure due to softer oil prices and the Bank of Canada's dovish stance as it flirts with rate cuts in upcoming meetings. This macro divergence is fueling the momentum in GBPCAD’s favor, making it a favored pair for swing longs.
Technically, the pair is forming higher lows with increasing volume, which adds confidence to the breakout. The risk is well defined below 1.8198, making this an attractive trade with a solid 1:2+ reward-to-risk profile. As price continues to respect bullish market structure, any pullback toward the neckline could offer a prime re-entry zone for continuation traders.
This setup aligns with highly searched price action strategies such as “inverse head and shoulders breakout,” “neckline retest,” and “GBP strength vs CAD weakness.” With both technical and fundamental confluence pointing in the same direction, GBPCAD is set up for a potentially profitable swing opportunity heading into May.
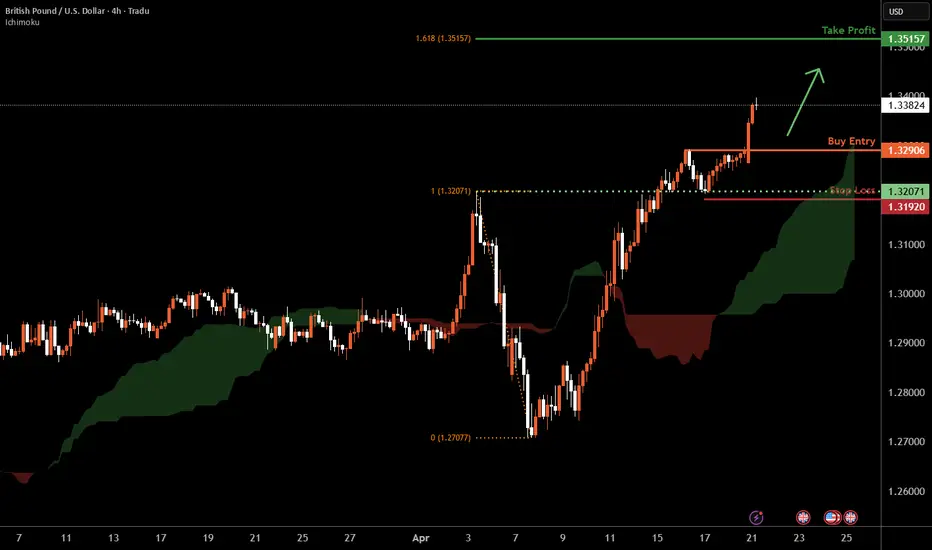
Cable H4 | Falling toward a pullback supportCable (GBP/USD) is falling towards a pullback support and could potentially bounce off this level to climb higher.
Buy entry is at 1.3290 which is a pullback support.
Stop loss is at 1.3192 which is a level that lies underneath an overlap support.
Take profit is at 1.3515 which is a resistance that aligns with the 161.8% Fibonacci extension.
High Risk Investment Warning
Trading Forex/CFDs on margin carries a high level of risk and may not be suitable for all investors. Leverage can work against you.
Stratos Markets Limited (tradu.com):
CFDs are complex instruments and come with a high risk of losing money rapidly due to leverage. 63% of retail investor accounts lose money when trading CFDs with this provider. You should consider whether you understand how CFDs work and whether you can afford to take the high risk of losing your money.
Stratos Europe Ltd (tradu.com):
CFDs are complex instruments and come with a high risk of losing money rapidly due to leverage. 63% of retail investor accounts lose money when trading CFDs with this provider. You should consider whether you understand how CFDs work and whether you can afford to take the high risk of losing your money.
Stratos Global LLC (tradu.com):
Losses can exceed deposits.
Please be advised that the information presented on TradingView is provided to Tradu (‘Company’, ‘we’) by a third-party provider (‘TFA Global Pte Ltd’). Please be reminded that you are solely responsible for the trading decisions on your account. There is a very high degree of risk involved in trading. Any information and/or content is intended entirely for research, educational and informational purposes only and does not constitute investment or consultation advice or investment strategy. The information is not tailored to the investment needs of any specific person and therefore does not involve a consideration of any of the investment objectives, financial situation or needs of any viewer that may receive it. Kindly also note that past performance is not a reliable indicator of future results. Actual results may differ materially from those anticipated in forward-looking or past performance statements. We assume no liability as to the accuracy or completeness of any of the information and/or content provided herein and the Company cannot be held responsible for any omission, mistake nor for any loss or damage including without limitation to any loss of profit which may arise from reliance on any information supplied by TFA Global Pte Ltd.
The speaker(s) is neither an employee, agent nor representative of Tradu and is therefore acting independently. The opinions given are their own, constitute general market commentary, and do not constitute the opinion or advice of Tradu or any form of personal or investment advice. Tradu neither endorses nor guarantees offerings of third-party speakers, nor is Tradu responsible for the content, veracity or opinions of third-party speakers, presenters or participants.
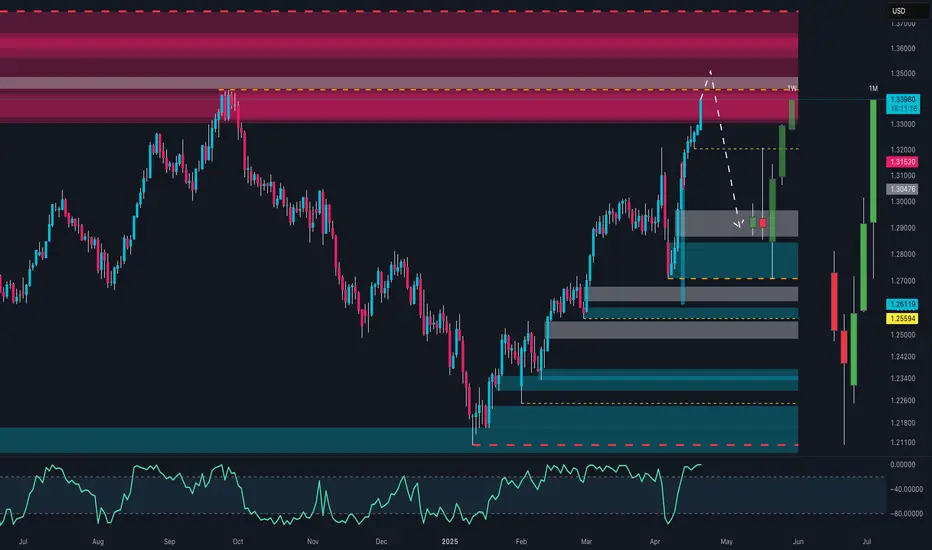
GBP/USD in terminal phase? This zone could flip everything!📊 Technical Analysis
Price is currently trading in a strong weekly/monthly resistance zone around 1.3390–1.3400, marked by a dense multi-layer supply area. Historically, this level has caused sharp rejections.
From the lows, price completed a steep bullish leg, breaking through several structures. However:
Momentum seems overstretched.
RSI shows potential overbought signals.
There's a likely bearish target zone between 1.2950 and 1.2850, which is a key demand area.
📌 Trade Setup:
I’m watching for exhaustion signals or bearish confirmations on H1 to short from the current resistance, targeting the grey and turquoise zones below 1.30.
🧾 COT Report – GBP
Large Speculators (Asset Managers) still hold a net short position, although they've reduced exposure in recent months.
Leverage Funds remain slightly long, but without strong conviction.
💵 COT Report – USD
Leverage Funds have turned significantly net long on the dollar (strong green line upward since March).
This supports a bearish view on GBP/USD, as USD strength returns.
📉 Summary:
Price is at a key decision zone. A technical correction is possible. COT data supports this view:
GBP remains weak on the institutional side.
USD is regaining strength.
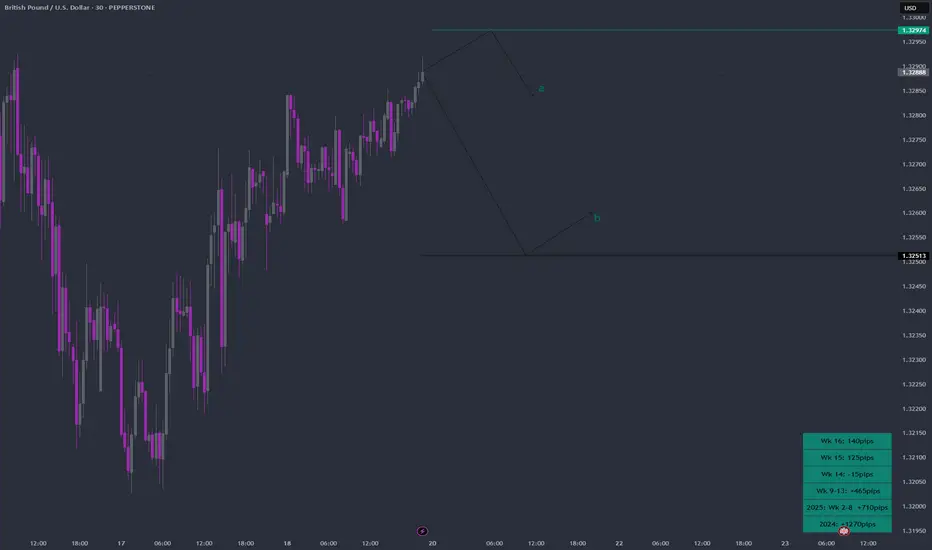
LEAP: GBPUSD Week 17 Swing Zone/LevelsLast week saw a good pinch on market pips. Aim to continue as always.
Price swing levels are set; either a or b, price action directs.
Levels/zones are calculated based on previous week H/L
Bearish reversal off overlap resistance?The Cable (GBP/USD) is rising towards the pivot which is an overlap resistance and could reverse to the 1st support.
Pivot: 1.3417
1st Support: 1.3102
1st Resistance: 1.3637
Risk Warning:
Trading Forex and CFDs carries a high level of risk to your capital and you should only trade with money you can afford to lose. Trading Forex and CFDs may not be suitable for all investors, so please ensure that you fully understand the risks involved and seek independent advice if necessary.
Disclaimer:
The above opinions given constitute general market commentary, and do not constitute the opinion or advice of IC Markets or any form of personal or investment advice.
Any opinions, news, research, analyses, prices, other information, or links to third-party sites contained on this website are provided on an "as-is" basis, are intended only to be informative, is not an advice nor a recommendation, nor research, or a record of our trading prices, or an offer of, or solicitation for a transaction in any financial instrument and thus should not be treated as such. The information provided does not involve any specific investment objectives, financial situation and needs of any specific person who may receive it. Please be aware, that past performance is not a reliable indicator of future performance and/or results. Past Performance or Forward-looking scenarios based upon the reasonable beliefs of the third-party provider are not a guarantee of future performance. Actual results may differ materially from those anticipated in forward-looking or past performance statements. IC Markets makes no representation or warranty and assumes no liability as to the accuracy or completeness of the information provided, nor any loss arising from any investment based on a recommendation, forecast or any information supplied by any third-party.

GBPUSD - bottom out pattern going on? What's next??#GBPUSD - perfect move as per our last couple of ideas regarding #GBPUSD
and now in current situation we have 1.3220 as immediate supporting and below that 1.3140
If market holds that supporting areas then we can expect further bounce towards 1.3500 and after that 1.3700 , 1.3900 n upto 1.4200
So stay sharp and don't be lazy here..
Good luck
Trade wisley
GBPUSD Happy Easter Traders! 4/20 6:33pm. I’m currently holding a sell position on GBP/USD at 1.32480, and despite price climbing to 1.32942, I see several technical and fundamental factors that support my trade idea.
Fundamental Perspective
Looking ahead, this week presents major economic events that could drive volatility in GBP/USD.
UK PMI (April 23): Manufacturing PMI is expected to drop to 44.1, while Services PMI may soften to 51.0—both indicators suggest economic slowdown, potentially putting downward pressure on GBP.
US Durable Goods (April 24): Forecasts show mixed numbers—headline durable goods is projected at +1.8%, but ex-transportation and ex-defense figures are negative, meaning uncertainty surrounding USD demand.
UK Retail Sales (April 25): The monthly figure is expected at -0.3%, signaling weaker consumer spending. This aligns with my sell bias, as deteriorating UK economic conditions could contribute to pound weakness.
If the UK data disappoints while US figures remain mixed or slightly stronger, GBP/USD could face renewed selling pressure, validating my position.
Technical Analysis - Historical & Indicator Confirmation
Looking at the daily chart, there’s strong alignment between price action and indicator readings that suggest a potential reversal:
Resistance Holding at 1.330–1.331:
The Stochastic at 74.88 suggests GBP/USD is nearing overbought conditions.
The Williams %R at -22.24 reinforces the idea that price is pushing into exhaustion territory.
Support Structure (Where Downside Pressure Could Build):
Immediate Support at 1.326–1.327: Previous lows from April 20 confirm this zone as a critical level for sellers.
Secondary Support at 1.321: Multiple recent price reactions suggest this area could serve as a strong downside target.
Deeper Support at 1.316–1.318: If bearish momentum strengthens, this area represents a key swing low.
Additionally, while price is pushing higher in the short term, it’s trading well above long-term daily EMAs, suggesting the rally is a temporary overextension rather than a sustained breakout. If GBP/USD fails to break above 1.330–1.331, momentum could shift in favor of my sell trade.
Trade Management & Outlook
Despite the recent push higher, I remain confident in my sell position as long as GBP/USD does not break and hold above 1.330–1.331. If price starts rejecting this level, the next downside target could be 1.326, followed by 1.321, where I’d consider taking partial profits.
With fundamental catalysts ahead, volatility will likely increase. If bullish momentum persists beyond 1.331, I may need to re-evaluate my position, but until that happens, my trade setup remains valid.
Final Thoughts
My sell at 1.32480 is built on strong reasoning—key fundamental risks, extended technical levels, and a solid structure of resistance all favor a potential reversal. If sellers step in soon, I’ll have the opportunity to secure profits on a well-planned move. Now, it’s a waiting game to see how price reacts to resistance and upcoming data.

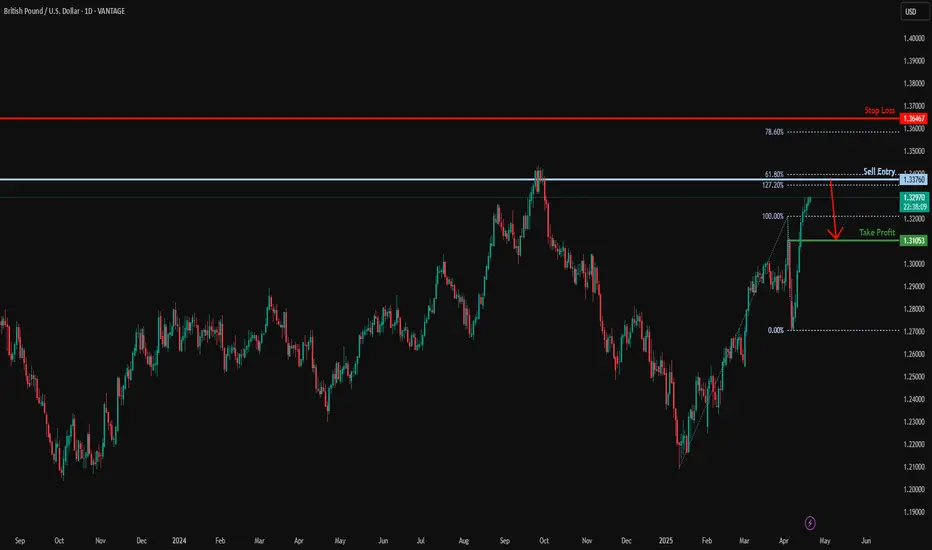
Bearish reversal off overlap resistance?GBP?USD is rising towards the resistance level which is an overlap resistance that lines up with the 61.6% Fibonacci projection and the 127.2% Fibonacci extension and could reverse from this level to our take profit.
Entry: 1.3376
Why we like it:
There is an overlap resistance level that lines up with the 127.2% Fibonacci extension and the 61.8% Fibonacci projection.
Stop loss: 1.3646
Why we like it:
There is a pullback resistance level that is slightly above the 78.6% Fibonacci projection.
Tale profit: 1.3105
Why we like it:
There is a pullback support level.
Enjoying your TradingView experience? Review us!
Please be advised that the information presented on TradingView is provided to Vantage (‘Vantage Global Limited’, ‘we’) by a third-party provider (‘Everest Fortune Group’). Please be reminded that you are solely responsible for the trading decisions on your account. There is a very high degree of risk involved in trading. Any information and/or content is intended entirely for research, educational and informational purposes only and does not constitute investment or consultation advice or investment strategy. The information is not tailored to the investment needs of any specific person and therefore does not involve a consideration of any of the investment objectives, financial situation or needs of any viewer that may receive it. Kindly also note that past performance is not a reliable indicator of future results. Actual results may differ materially from those anticipated in forward-looking or past performance statements. We assume no liability as to the accuracy or completeness of any of the information and/or content provided herein and the Company cannot be held responsible for any omission, mistake nor for any loss or damage including without limitation to any loss of profit which may arise from reliance on any information supplied by Everest Fortune Group.