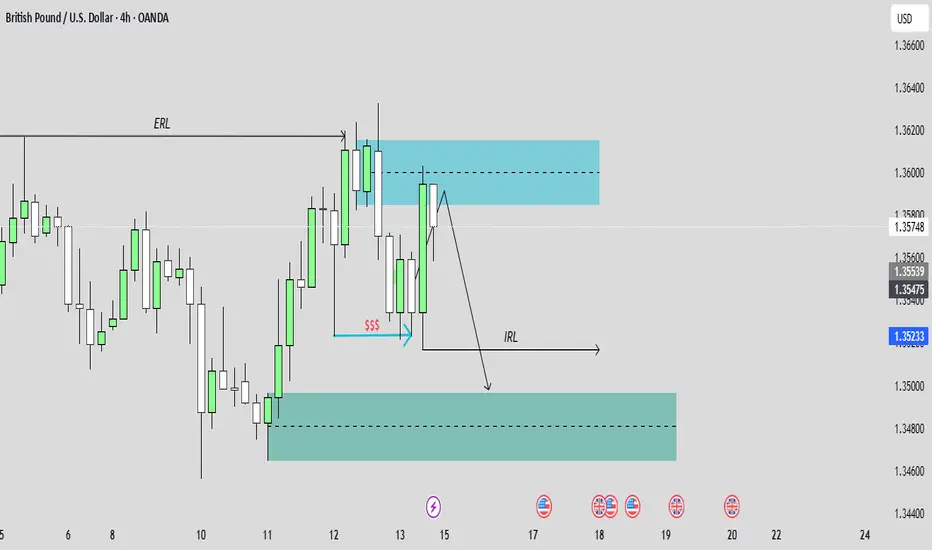
GBPUSD SHORT FORECAST Q2 W25 D16 Y25GBPUSD SHORT FORECAST Q2 W25 D16 Y25
Professional Risk Managers👋
Welcome back to another FRGNT chart update📈
Diving into some Forex setups using predominantly higher time frame order blocks alongside confirmation breaks of structure.
Let’s see what price action is telling us today!
💡Here are some trade confluences📝
✅Weekly order block
✅15' order block
✅Intraday 15' break of structure
✅Tokyo ranges to be filled
🔑 Remember, to participate in trading comes always with a degree of risk, therefore as professional risk managers it remains vital that we stick to our risk management plan as well as our trading strategies.
📈The rest, we leave to the balance of probabilities.
💡Fail to plan. Plan to fail.
🏆It has always been that simple.
❤️Good luck with your trading journey, I shall see you at the very top.
🎯Trade consistent, FRGNT X
GBPUSD
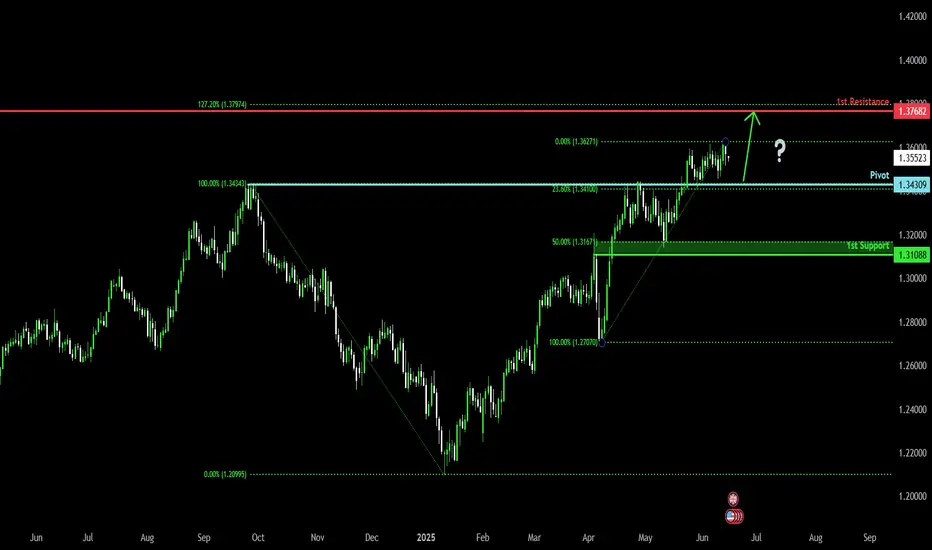
Bullish bounce for the Cable?The price is falling towards the pivot which is a pullback support and could bounce to the 1st resistance.
Pivot: 1.3409
1st Support: 1.3108
1st Resistance: 1.3768
Risk Warning:
Trading Forex and CFDs carries a high level of risk to your capital and you should only trade with money you can afford to lose. Trading Forex and CFDs may not be suitable for all investors, so please ensure that you fully understand the risks involved and seek independent advice if necessary.
Disclaimer:
The above opinions given constitute general market commentary, and do not constitute the opinion or advice of IC Markets or any form of personal or investment advice.
Any opinions, news, research, analyses, prices, other information, or links to third-party sites contained on this website are provided on an "as-is" basis, are intended only to be informative, is not an advice nor a recommendation, nor research, or a record of our trading prices, or an offer of, or solicitation for a transaction in any financial instrument and thus should not be treated as such. The information provided does not involve any specific investment objectives, financial situation and needs of any specific person who may receive it. Please be aware, that past performance is not a reliable indicator of future performance and/or results. Past Performance or Forward-looking scenarios based upon the reasonable beliefs of the third-party provider are not a guarantee of future performance. Actual results may differ materially from those anticipated in forward-looking or past performance statements. IC Markets makes no representation or warranty and assumes no liability as to the accuracy or completeness of the information provided, nor any loss arising from any investment based on a recommendation, forecast or any information supplied by any third-party.
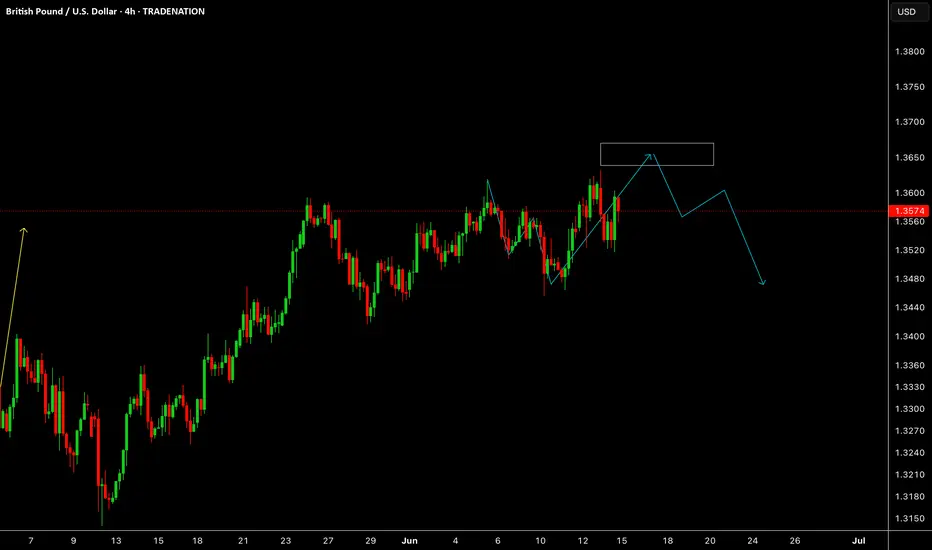
GBPUSDGBPUSD needs one more push up before a drop.
Disclosure: We are part of Trade Nation's Influencer program and receive a monthly fee for using their TradingView charts in our analysis.
Still keeping a close eye on a potential USD pop...Although the EUR/USD and GBP/USD popped higher late last week, I'm still keeping a close eye to stay short on the EUR/USD considering the bearish rising broadening pattern coupled with a yearly pivot point inter-median level and negative divergence on the MACD. This is all based on the daily chart.
Many factors are in play right now with what's going on between Israel and Iran along with FOMC this week and Tariffs still in play.
On a purely technical analysis point of view, I potentially expect a bullish retracement in the USD while remaining long term bearish across the board.
we'll see how this one develops.
Good Luck & Trade Safe.

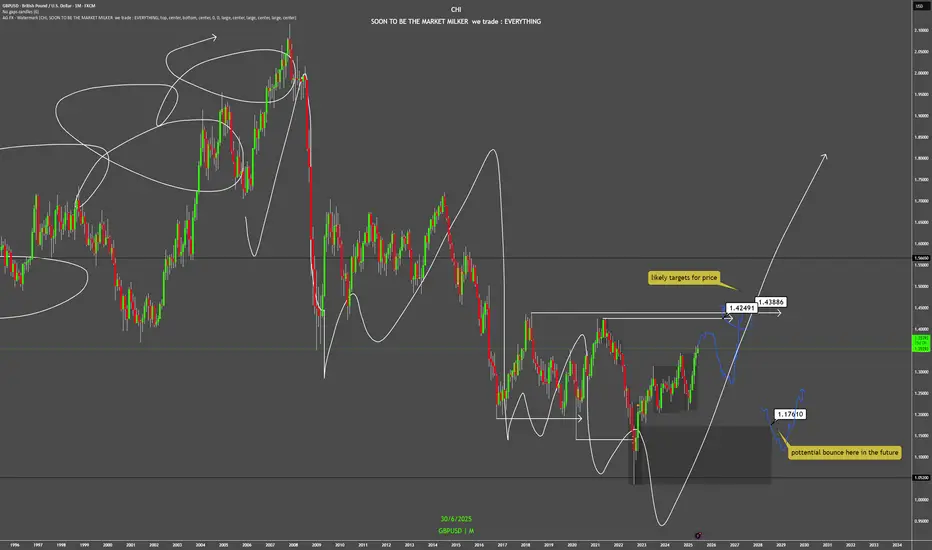
Macro Analysis (GBP/USD)Likely aiming for 1.42491 and 1.43886 as potential targets.
There's also a possibility of a bounce near 1.17610 in the future.
The yearly timeframe failed at 1.05200 back in 2022, suggesting we're sitting at the bottom of the range.
Quick analysis — Despite all the social and political controversy in the UK, the macro chart clearly shows a long-term downtrend. Until price closes strongly above 1.43886, that's when this pair might have a chance vs the US dollar. (1.72062 for some stronger confidence lol)
That said, the past five monthly candles have all been green, showing some momentum and short to mid-term strength. Could easily just be a pullback before continuing lower, breaking below 1.05200, which honestly, wouldn’t surprise me.
But hey, let’s keep it to the charts. WOMEN lie, men lie, but numbers don’t. And this is all just numbers printed in a chart.
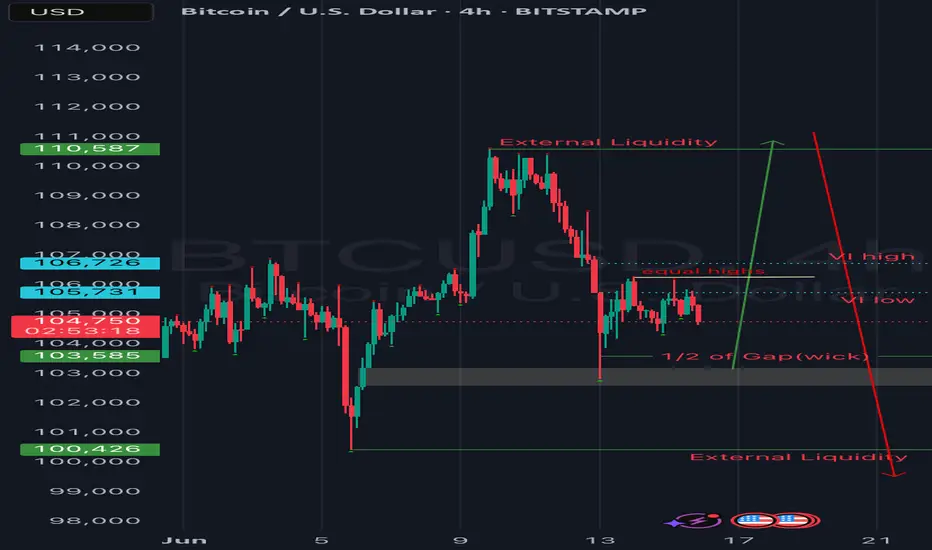
BTC update!!Good day traders, here is another update on BTC and I have adjusted my narrative but my overall bias is still remaining bearish…
Forex Weekly Portfolio Selection – Top Trade SetupsWeekly Forex Portfolio Selection – H1 Chart Analysis
Using the Weekly & Daily Currency Strength Index, we’ve identified the strongest and weakest currencies to build a focused trading portfolio for the week.
📊 Currency Strength Ranking (1 = Weakest, 8 = Strongest):
EUR: 8
CHF: 7
CAD: 6
GBP: 5
AUD: 4
NZD: 3
USD: 2
JPY: 1
➡️ The Euro (EUR) is currently the strongest, while the Japanese Yen (JPY) is the weakest.
🔍 Analysed Pairs (H1 Timeframe):
EURJPY
EURUSD
CADJPY
GBPUSD
This selection focuses on high-probability setups aligned with trend and strength analysis.

gbpusd Weekly forcast of NJ pair
We can see bearish Bias on 4hr tf
Always wait for confirmation/strong setup for open a trade.
Thank you and Good Luck!
Happy trading.
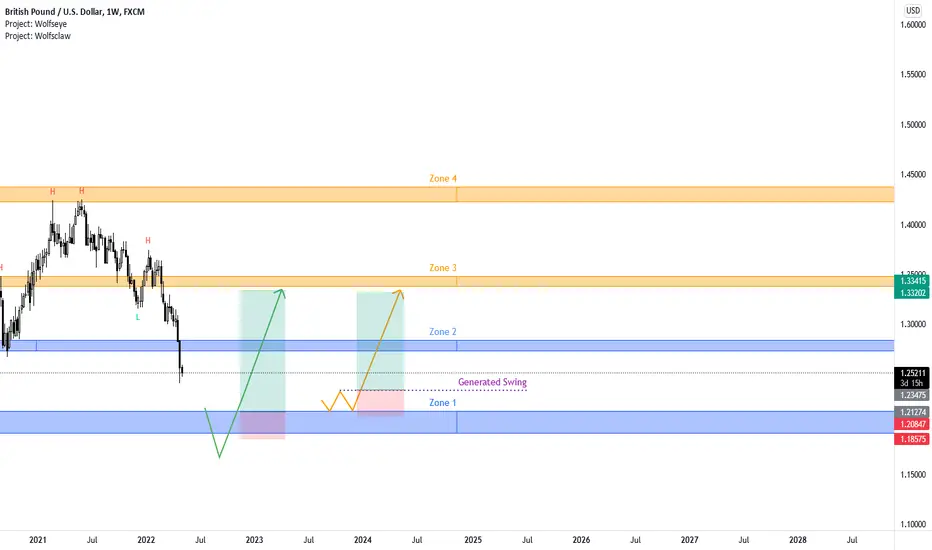
GBPUSD | 2 Long Scenarios | The Empire will strike backGeneral
GBPUSD fell through the first big support zone (Zone 2) unless a reclaim i am not gonna look for longs currently. Personally waiting for price falling deeper into Zone 1. Marked 2 Scenarios that i would want to see to develop.
Be aware that i usually use LTF (such as the 1 hour chart to plan my entries). Meaning the SLs and RR are not completly correct as shown.
1. Long (Green arrow)
Price moves below Zone 1. Reclaim. Enter on reclaim.
Target: Slightly below Zone 3
Stop- Loss: Depending on the LTF entry i wouldnt want to see it going below Zone 1 again
Time duration: Days, weeks, months, years... ;)
2. Long (Orange arrow)
Price pushes into Zone 1, reacts supportive and then generates a Swing. Enter on breaking of the generated swing.
Target: Slightly below Zone 3
Stop- Loss: A bit below of top of the Zone 1
Time duration: Days, weeks, months, years... ;)
Good luck
Disclaimer:
- This information does not constitute as financial advice and is only for educational purposes. I am not your financial advisor.
- You trade entirely at your own risk
- Make your own research
- Finance and trading is evil, capitalism is bad, duh ;)
GBPUSD:Sharing of the Trading Strategy for Next WeekAll the trading signals this week have resulted in profits!!! Check it!!!👉👉👉
Fundamental Analysis:
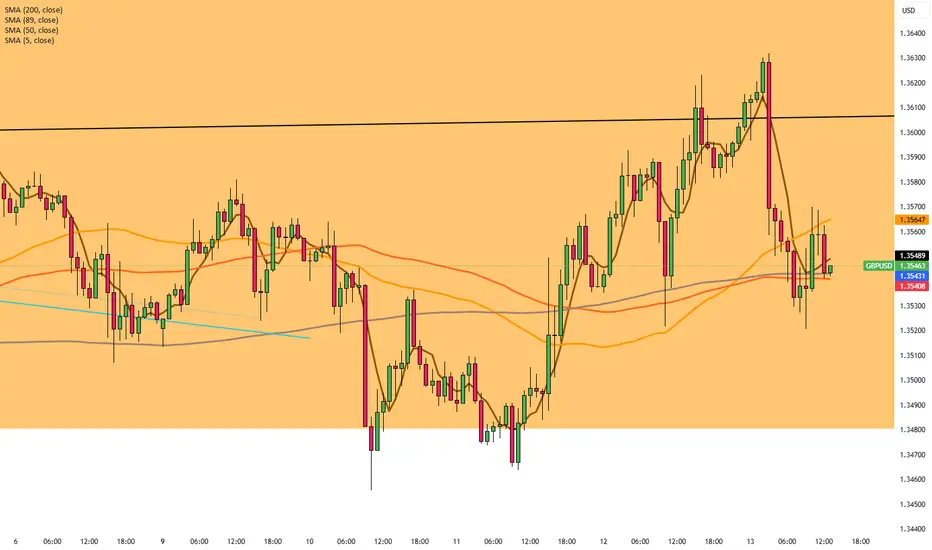
Recent UK economic data have outperformed expectations, with accelerated expansion in the services sector and signs of recovery in manufacturing PMI, boosting market confidence in the British pound.Market expectations of a milder future monetary policy from the Federal Reserve have restrained the U.S. dollar, providing support for GBP/USD's upward movement.
Technical Analysis :
The MACD histogram above the zero line shows a growing trend, indicating strengthening bullish momentum. The DIF line lies above the DEA line, confirming an uptrend.
Price trades above short-term moving averages, which form a bullish arrangement, signifying bullish dominance.Bollinger Bands widen upward, with price near the upper band (resistance at 1.3650) and the lower band at 1.3480.The RSI at 63.5 stays in the strong bullish zone without entering overbought territory.
Trading Strategy:
Initiate long positions after price stabilizes in the 1.3520–1.3540 zone on pullbacks.
buy@1.3520–1.3540
TP:1.3650-1.3720
Share accurate trading signals daily—transform your life starting now!
👇 👇 👇 Obtain signals👉👉👉
EURUSD ||| '' W '' PATTERN IDENTIFIED . ✅ Harmonic Formation (Bearish Potential)
⚠️ Selling Bias forming soon
---
🧩 Pattern Breakdown:
A Bearish Harmonic Pattern (likely Butterfly or Deep Crab) has been identified and is now nearing completion at the D point.
Current price is approaching key resistance / reversal zone, precisely around the 0.786 - 0.886 fib area (highlighted red).
The Risk-to-Reward is clearly mapped:
🔺 Stop Loss: 1.19405
✅ Entry Zone: Around 1.17106
🎯 Target: 1.09588
Potential short setup if price respects the harmonic symmetry and fails to break above resistance.

Two downward-sloping channels (drawn with parallel white lines) Chart Details
Pair: GBP/USD
Timeframe: 1H (1 Hour)
Platform: TradingView
Price at capture: ~1.36020
Indicators: EMA 50 is mentioned, though not visibly prominent.
📉
Technical Analysis
Descending Channels: Two downward-sloping channels (drawn with parallel white lines) show past bearish movements.
Breakout: The price has broken out upwards from the latest descending channel, indicating a bullish impulse.
Supply Zone (Red Box):
Ranges between 1.36104 and 1.36233.
Likely a resistance/sell zone, where price is expected to reverse.
Demand Zone (Green Box):
Starts below the supply zone and represents a potential target zone for shorts.
Trade setup suggests entering a short position after a potential wick or touch into the red zone.
Projected Path (White Line):
Shows an anticipated bearish move after tapping into the red zone.
Suggests a short trade targeting the 1.34322 region (lower green box), potentially a support zone.
✅
Conclusion
The trader is expecting:
A short opportunity after a potential rejection from the 1.3610–1.3623 resistance area.
A move downward toward the 1.3432 level.

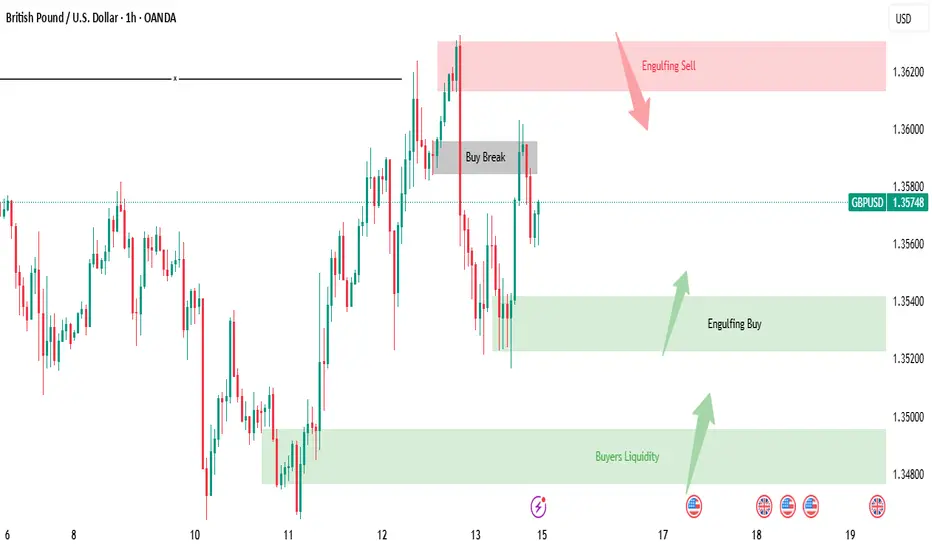
Let’s break down what's currently happening in the GBP/USD.GBP/USD Analysis in a Simple and Beginner
Let’s break down what's currently happening in the GBP/USD market, in a way that even someone without any trading experience can grasp easily.
At the moment, the market attempted to break out on the buy (upside), but it faced rejection, meaning it tried to go higher but couldn’t sustain that move and started falling down.
As the price dropped, it reached a point where a bullish engulfing pattern had previously formed this is a special pattern in trading which often signals a potential strong buying opportunity.
Now, here’s the key point:
📍 If the market comes back down to this engulfing buy zone, there's a high probability that it will bounce back up strongly from there think of it like a spring that’s been compressed and is ready to launch upward.
On the other hand:
📍 If the market doesn’t come down and instead continues moving upward, then we already have a bearish engulfing pattern waiting at a higher level. This is a zone where the market could face resistance and fall sharply again.
So what should you do?
✅ Be patient — let the market come to these important engulfing levels.
✅ Don’t rush into trades. Let the price touch these zones and then observe the reaction.
These engulfing zones are like magic they often predict powerful movements. Wait for the price to reach the level, and then watch the magic unfold.
Even if you're new to trading, this kind of analysis helps you understand when and where the market might turn without needing complicated indicators.
DYOR! Not Financial Advice.
Currency Pairs. Part 2. Weekly OutlookExpecting massive expansion on DXY and major meltdown on Euro and Pound

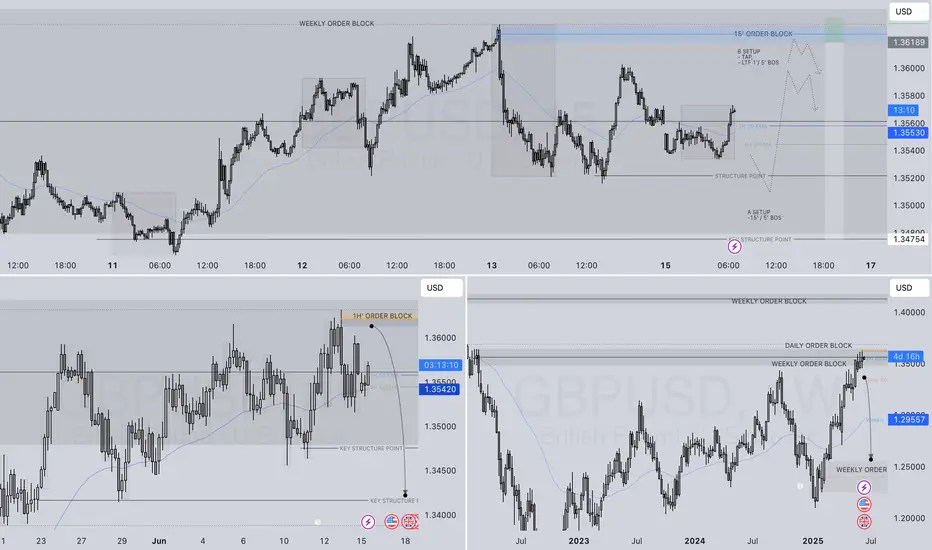
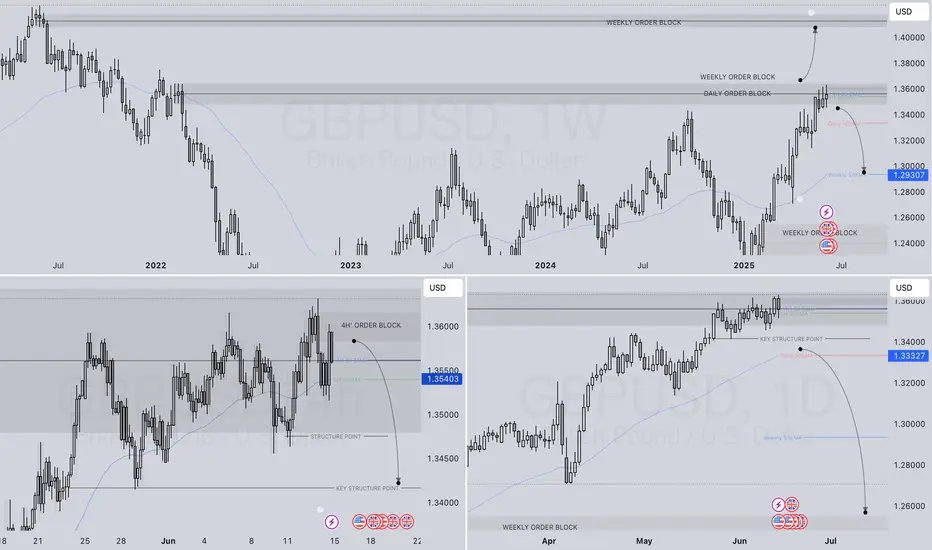
GBPUSD WEEKLY HTF FORECAST Q2 W25 Y25GBPUSD WEEKLY HTF FORECAST Q2 W25 Y25
Professional Risk Managers👋
Welcome back to another FRGNT chart update📈
Diving into some Forex setups using predominantly higher time frame order blocks alongside confirmation breaks of structure.
💭NOTE- If price closes above the key weekly/ daily order block with daily close- re evaluation will be required.
🔑 Remember, to participate in trading comes always with a degree of risk, therefore as professional risk managers it remains vital that we stick to our risk management plan as well as our trading strategies.
📈The rest, we leave to the balance of probabilities.
💡Fail to plan. Plan to fail.
🏆It has always been that simple.
❤️Good luck with your trading journey, I shall see you at the very top.
🎯Trade consistent, FRGNT X
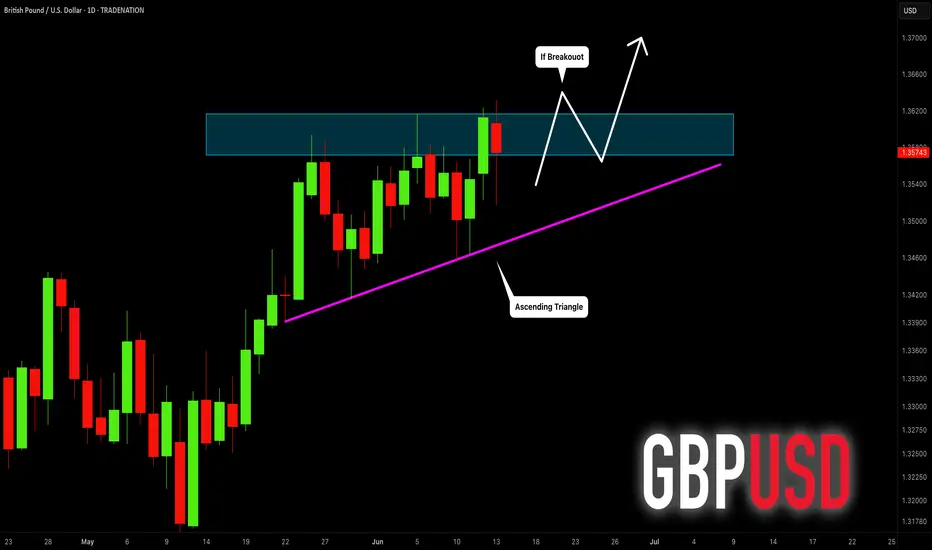
GBPUSD: Your Trading Plan For Next Week 🇬🇧🇺🇸
GBPUSD formed an ascending triangle pattern on a daily time frame.
Your next signal to buy will be a bullish violation of its neckline.
To confirm a breakout, we will need a daily candle close above 1.362.
A bullish continuation will be expected to 1.37 level then.
❤️Please, support my work with like, thank you!❤️
I am part of Trade Nation's Influencer program and receive a monthly fee for using their TradingView charts in my analysis.
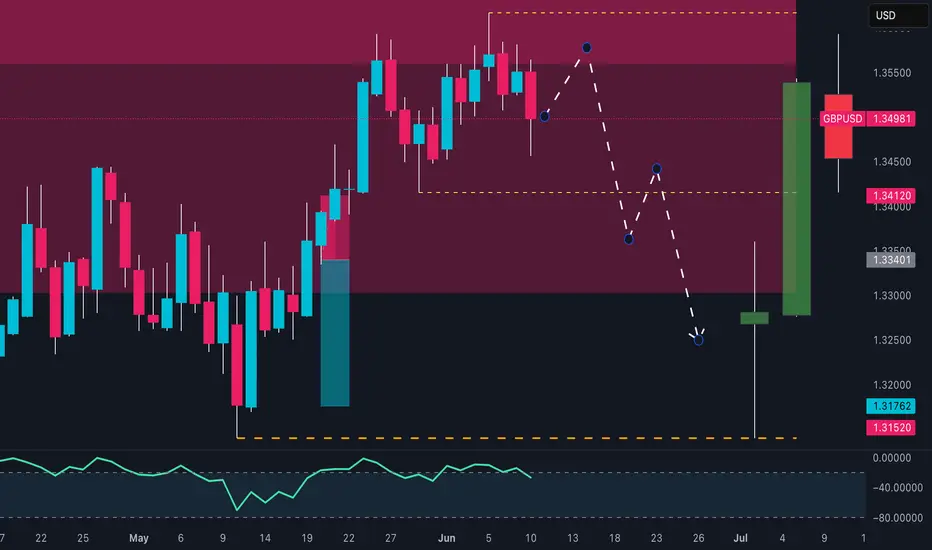
Massive GBP/USD Reversal Ahead? Head & Shoulders FormationGBP/USD is at a critical technical juncture following a sharp bullish impulse that pushed the pair above the 1.34 handle, printing a strong weekly bullish engulfing candle and breaking out of a multi-week consolidation zone. This move unfolded in a macro context where the U.S. Dollar Index (DXY) is showing clear signs of weakness, with Non-Commercial net long positions dropping drastically—from around 20,000 to less than 5,000 contracts. This shift points to a fading speculative appetite for the dollar, historically a leading indicator of upcoming corrective phases or broader declines in the DXY.
On the flip side, the Commitments of Traders (COT) report on the British Pound reveals that Non-Commercials (typically hedge funds and asset managers) remain net long on GBP, with a slight increase week-over-week. However, Commercials (generally institutions and hedgers) have aggressively built up a significant net short position—levels that in the past preceded major reversals on the pair. This divergence between speculators and institutional hedgers suggests short-term bullish potential, but with rising risk of exhaustion near current resistance levels.
Adding fuel to this outlook is the retail sentiment: approximately 63% of retail traders are currently short GBP/USD, with an average entry price around 1.3021. This kind of retail crowd positioning, typically inefficient from a historical perspective, adds contrarian support for further upside, as long as price holds above the 1.3340 structure.
From a seasonality perspective, June tends to be a mildly bullish-to-sideways month for GBP/USD, especially when looking at the 10- and 15-year seasonal averages. While the seasonal bias is not particularly strong, there’s also no statistical downward pressure this time of year, leaving room for technically-driven moves influenced by liquidity and sentiment rather than macro patterns alone.
On the technical front, the daily chart shows a steep rally capped by a large green candle on Monday, breaking cleanly through the 1.34 resistance zone. The price is now hovering inside a key supply area between 1.3499 and 1.3550—a historically reactive zone that has triggered major rejections in previous months. How price reacts here will likely shape the next major swing. A confirmed breakout and consolidation above 1.3550 would open the door for an extension toward 1.37–1.3750. Conversely, a sharp rejection followed by a break below 1.3412—and especially under 1.3340—would set the stage for a deeper correction toward 1.3170.
The RSI is currently showing early signs of momentum loss, although no strong bearish divergence has emerged yet. This implies that the pair could still fuel another push higher before running out of steam—possibly forming the right shoulder of a head & shoulders pattern if the rejection scenario plays out.
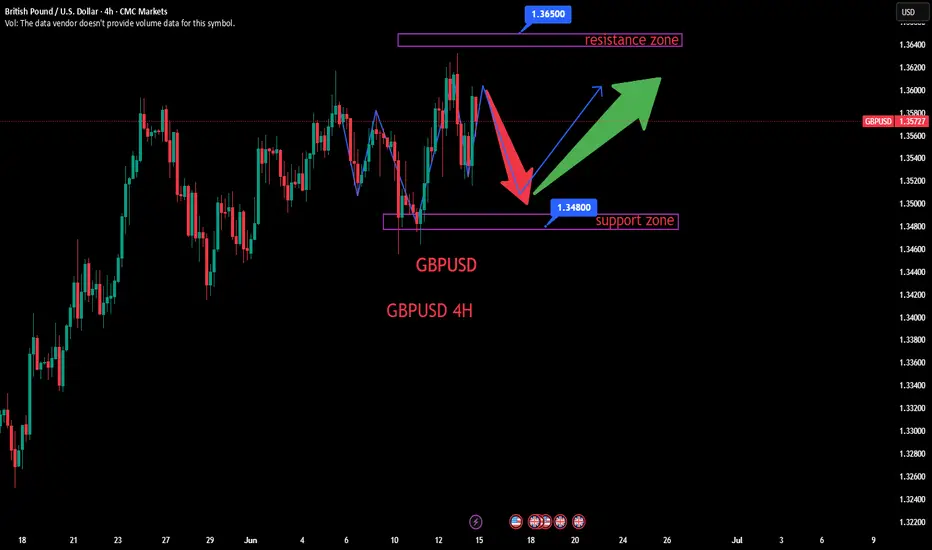
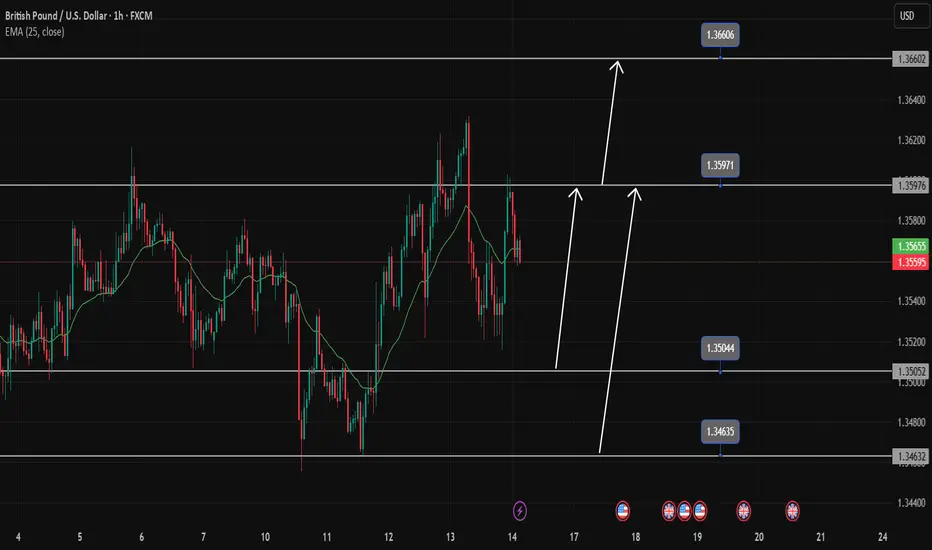
GBPUSD will continue to rise and break last week's highGBPUSD is correcting lower in the range at the end of the week. This pullback is heading towards the 1.350 support. There will be a bullish reaction at this area. Or if the selling pressure really takes over the market at this support area, then pay attention to the 1.346 bottom for the BUY strategy of this currency pair.
On the other hand, 1.360 will prevent the price increase. It will act as strategic resistance before a new extended breakout to the upside.
The uptrend is more likely to continue than the downtrend, so prioritizing BUY signals will bring better profits to the currency pair.
Support: 1.350, 1.346
Resistance: 1.360, 1.366
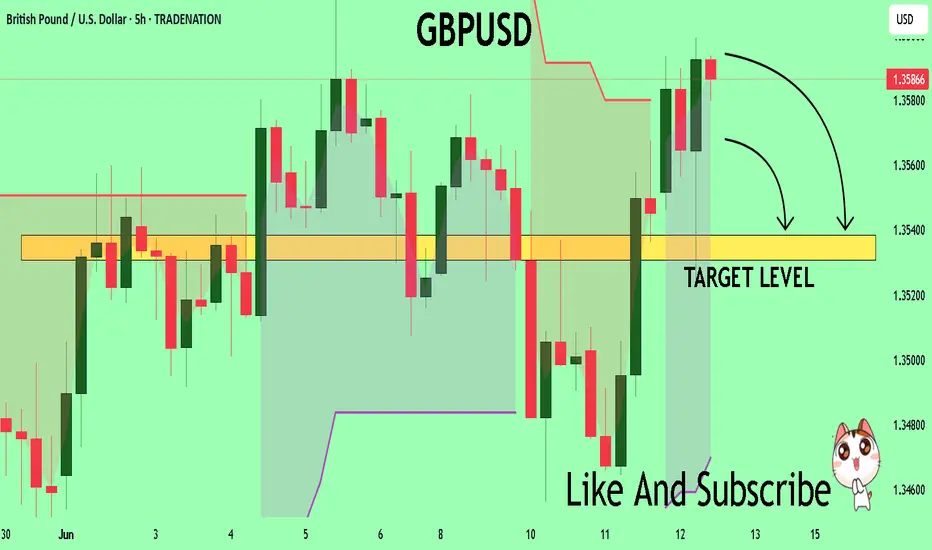
GBPUSD My Opinion! SELL!
My dear followers,
I analysed this chart on GBPUSD and concluded the following:
The market is trading on 1.3589 pivot level.
Bias - Bearish
Technical Indicators: Both Super Trend & Pivot HL indicate a highly probable Bearish continuation.
Target - 1.3538
About Used Indicators:
A super-trend indicator is plotted on either above or below the closing price to signal a buy or sell. The indicator changes color, based on whether or not you should be buying. If the super-trend indicator moves below the closing price, the indicator turns green, and it signals an entry point or points to buy.
Disclosure: I am part of Trade Nation's Influencer program and receive a monthly fee for using their TradingView charts in my analysis.
———————————
WISH YOU ALL LUCK
EURUSD, GBPUSD - Outlook for next weekEURUSD - So we have 2x 4 hour POI's (Points Of Interest). Will be looking at potential reversals at both POI's however, within the first POI we have an area of potential liquidity that could look to be taken before we make out move back to the upside.
Therefor, the second POI could look to be our more solid option for our buying options at some point next week.
GBPUSD - This pair looks to be building its liquidity now for potential trades to the upside as today on the lower TF's it was setting quite a few traps for the potential longs and the traders that would have been shorting the breaks below structure to the left.
If you have any questions for me please do let me know

GBPUSD – Sterling Slips Amid Geopolitical Risk |GBPUSD – Sterling Slips Amid Geopolitical Risk | Will Support Hold for a Bounce?
🌍 Macro & Geopolitical Overview
The British Pound (GBP) is under pressure as risk sentiment deteriorates following a sharp escalation between Israel and Iran.
Israel launched a major military campaign, striking dozens of nuclear and military facilities in northeastern Tehran.
PM Netanyahu announced the start of "Operation Rising Lion", aimed at eliminating the Iranian nuclear threat.
US President Donald Trump voiced support, stating that Iran “must never have a nuclear bomb.”
Investors reacted by fleeing to safe-haven assets, pushing the US Dollar (DXY) from 97.60 to nearly 98.30.
Meanwhile, next week’s Bank of England (BoE) and Federal Reserve meetings are in focus. Both are expected to hold rates steady, but weak UK economic data may pressure the BoE to adopt a more cautious or dovish tone.
📉 Technical Analysis – H1 Chart
🔸 Trend Structure
GBPUSD broke down from its recent high at 1.36288 and is now approaching key support between 1.35350 and 1.34957.
As long as 1.3495 holds, the move appears to be a technical correction, not a reversal.
🔸 Fibonacci & Moving Averages
Current price sits near Fibonacci 0.236 retracement of the recent swing.
Price is trading below the EMA 13 & 34, but EMA 200 near 1.353x still acts as potential support.
🔸 Resistance to Watch
The next upside target sits at 1.3588, followed by the previous high at 1.3628.
🧠 Market Sentiment
Risk aversion is dominating due to geopolitical headlines.
GBP is vulnerable as a risk-sensitive currency.
However, if tensions ease and central bank decisions next week come in line with expectations, GBP could rebound from its currently discounted levels.
🎯 Trade Setup Suggestion
✅ BUY ZONE: 1.35350 – 1.34957
Stop-Loss: 1.3460
Take-Profit Targets: 1.3588 → 1.3628
Enter only on bullish price action confirmation around the support zone.
✅ Conclusion
GBPUSD is trading under geopolitical stress, but the technical setup around 1.3495 – 1.3535 offers a potential bounce zone. A short-term recovery could unfold if sentiment stabilizes and central banks maintain the expected policy stance.

Weaker PPI Caps Dollar Strength in GBP/USDGBP/USD fell to around 1.3530 early Friday as escalating tensions in the Middle East supported demand for the US Dollar. Israel’s preemptive strike on Iran raised fears of retaliation, with Iranian officials warning of severe consequences for both the US and Israel, pressuring risk-linked currencies like the Pound. However, weaker US PPI data limited further USD strength. May’s PPI increased just 0.1%, below the 0.2% forecast, while the core PPI also came in softer. Attention now turns to the upcoming Michigan consumer sentiment report.
Resistance is at 1.3600, with support around 1.3425.
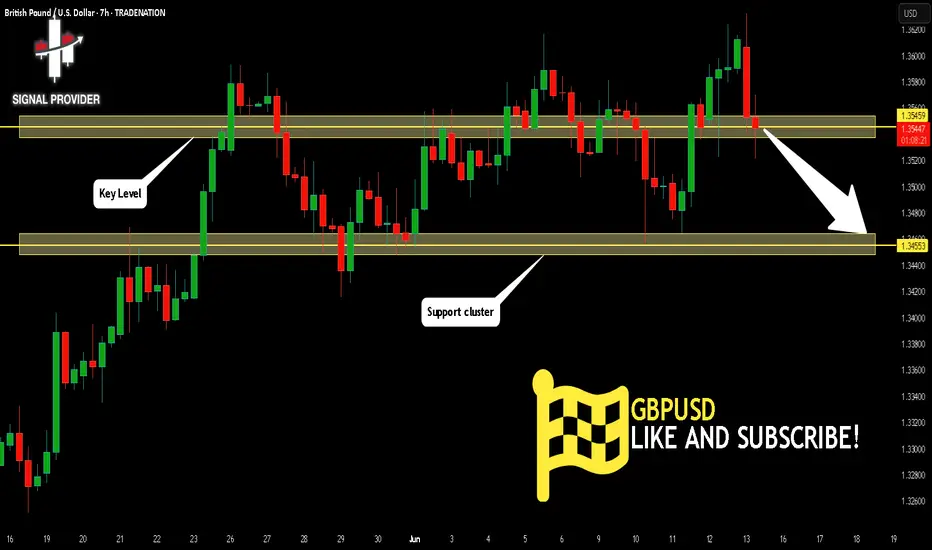
GBPUSD Is Going Down! Sell!
Please, check our technical outlook for GBPUSD.
Time Frame: 7h
Current Trend: Bearish
Sentiment: Overbought (based on 7-period RSI)
Forecast: Bearish
The price is testing a key resistance 1.354.
Taking into consideration the current market trend & overbought RSI, chances will be high to see a bearish movement to the downside at least to 1.345 level.
P.S
Overbought describes a period of time where there has been a significant and consistent upward move in price over a period of time without much pullback.
Disclosure: I am part of Trade Nation's Influencer program and receive a monthly fee for using their TradingView charts in my analysis.
Like and subscribe and comment my ideas if you enjoy them!