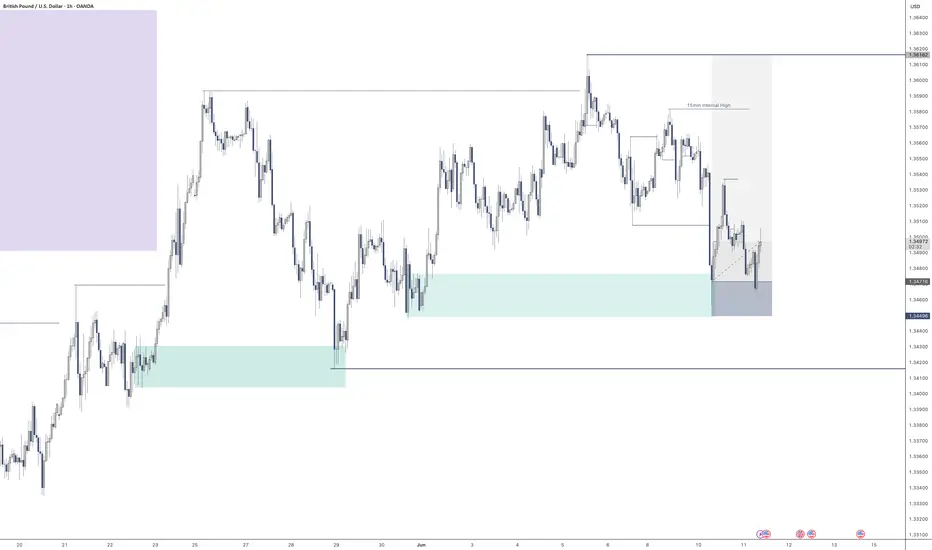
GBPUSD - LongI missed the opportunity yesterday.
However, I've been lucky enough to get involved again as of this morning.
4H orderflow is still bullish so we will still look for the longs until the market tells us otherwise.
If I can help with anything do let me know
GBPUSD
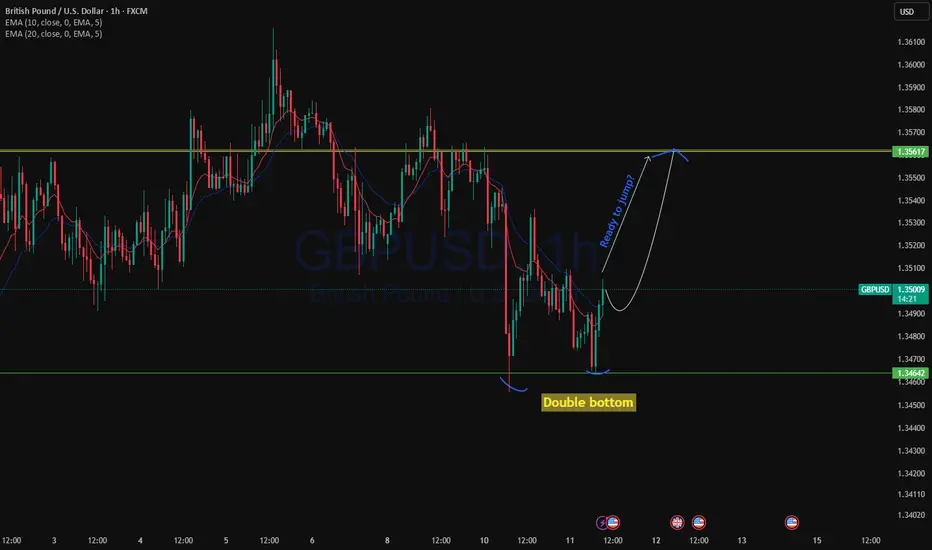
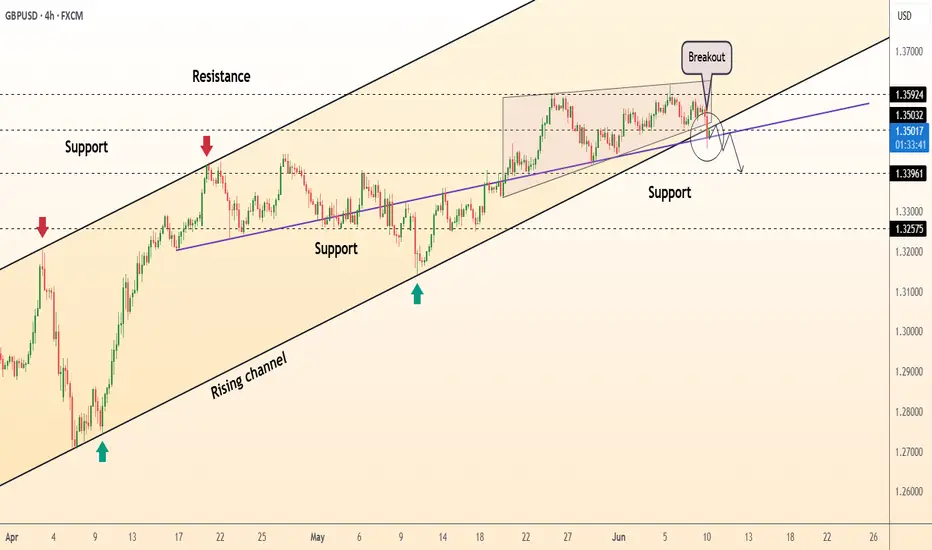
GBPUSD ready to jump?GBPUSD after retest of the daily support has got a bounce back to the upside with a momentum as the price already has got rejected back, we may see potential trend continuation. We can spot the double bottom on the lower timeframe from this support and may continue to rise to the resistance. A bullish trade is high probable after confirmation of potential inverted head and shoulder
Fundamental Market Analysis for June 11, 2025 GBPUSDThe GBP/USD pair continues to decline to around 1.34750 during Wednesday's Asian trading session. The pound sterling (GBP) is weakening against the US dollar (USD) due to a weaker UK employment report. Later on Wednesday, attention will shift to the US Consumer Price Index (CPI) for May.
The ILO unemployment rate in the UK rose to 4.6% in the three months to April from 4.5% previously, the British Office for National Statistics said on Tuesday. The figure was in line with expectations. Meanwhile, the change in the number of applicants for unemployment benefits in May was 33,100, compared with -21,200 previously (revised from 5,200), which is below the consensus of 9,500.
In addition, average earnings excluding bonuses in the UK rose 5.2% year-on-year (3M YoY) in April, compared with a revised 5.5% increase in the previous reading. The market forecast was 5.4%. Average earnings including bonuses rose 5.3% over the same period after accelerating to a revised 5.6% in the quarter to March. The data fell short of the forecast of 5.5%.
These figures indicate that the UK labor market is losing momentum under pressure from tax increases and the minimum wage hike by the government. This, in turn, may put some pressure on the pound sterling in the near term. “This gradual slowdown in wage growth may reassure the Bank of England after inflation unexpectedly jumped to its highest level in more than a year last month,” said Paige Tao, an economist at PwC UK.
Trading recommendation: SELL 1.34800, SL 1.35100, TP 1.34100

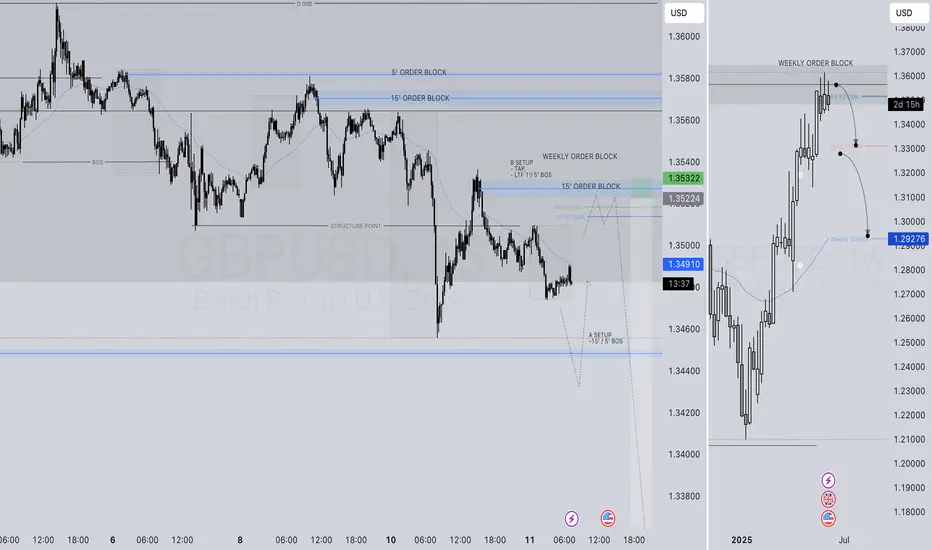
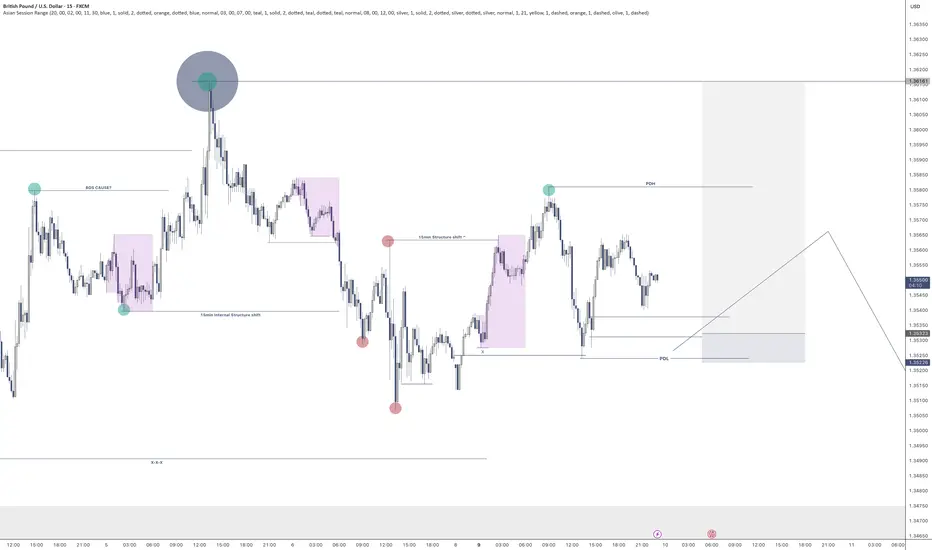
GBPUSD SHORT FORECAST Q2 W24 D11 Y25GBPUSD SHORT FORECAST Q2 W24 D11 Y25
Professional Risk Managers👋
Welcome back to another FRGNT chart update📈
Diving into some Forex setups using predominantly higher time frame order blocks alongside confirmation breaks of structure.
Let’s see what price action is telling us today!
💡Here are some trade confluences📝
✅Weekly order block
✅15' order block
✅Intraday 15' break of structure
✅Tokyo ranges to be filled
🔑 Remember, to participate in trading comes always with a degree of risk, therefore as professional risk managers it remains vital that we stick to our risk management plan as well as our trading strategies.
📈The rest, we leave to the balance of probabilities.
💡Fail to plan. Plan to fail.
🏆It has always been that simple.
❤️Good luck with your trading journey, I shall see you at the very top.
🎯Trade consistent, FRGNT X
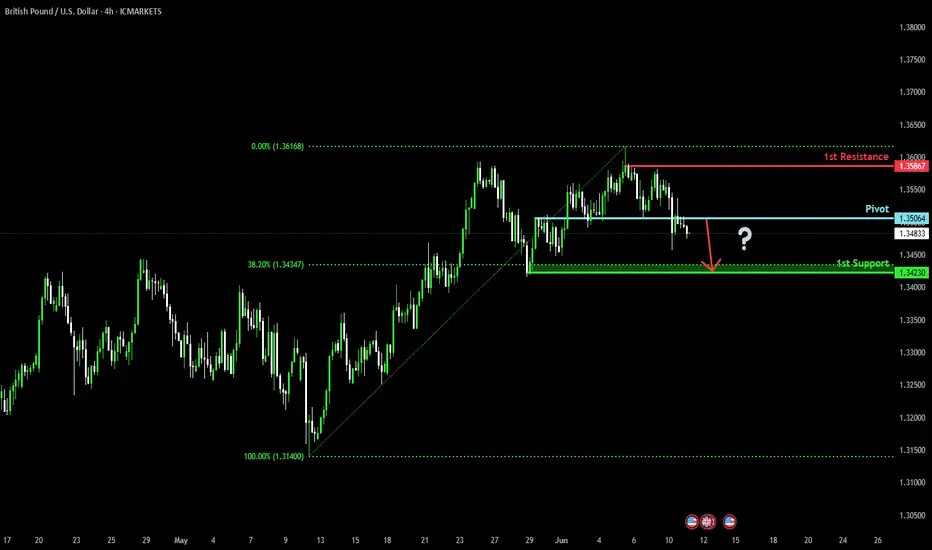
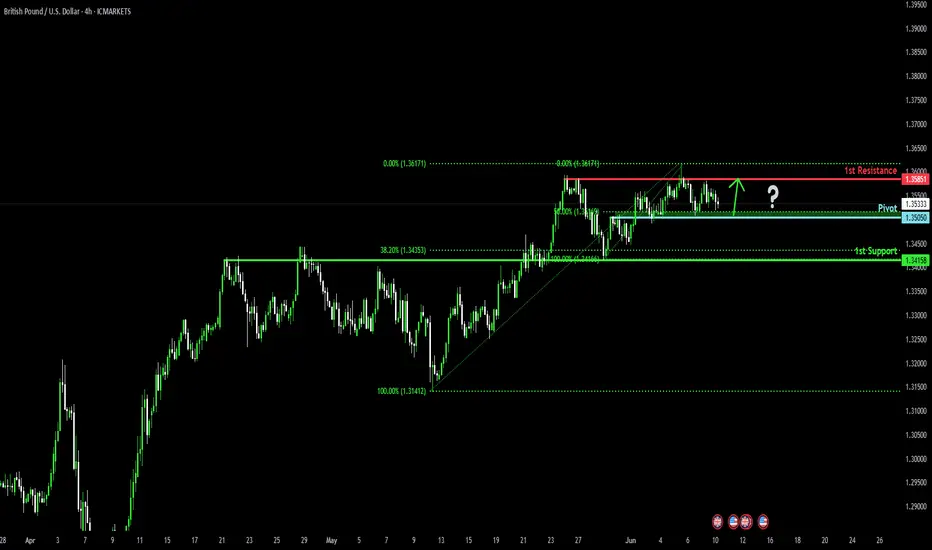
Bearish drop off major resistance?Cable (GBP/USD) has reacted off the pivot which acts as an overlap resistance and could drop to the 1st support which is a pullback support.
Pivot: 1.3506
1st Support: 1.3423
1st Resistance: 1.3586
Risk Warning:
Trading Forex and CFDs carries a high level of risk to your capital and you should only trade with money you can afford to lose. Trading Forex and CFDs may not be suitable for all investors, so please ensure that you fully understand the risks involved and seek independent advice if necessary.
Disclaimer:
The above opinions given constitute general market commentary, and do not constitute the opinion or advice of IC Markets or any form of personal or investment advice.
Any opinions, news, research, analyses, prices, other information, or links to third-party sites contained on this website are provided on an "as-is" basis, are intended only to be informative, is not an advice nor a recommendation, nor research, or a record of our trading prices, or an offer of, or solicitation for a transaction in any financial instrument and thus should not be treated as such. The information provided does not involve any specific investment objectives, financial situation and needs of any specific person who may receive it. Please be aware, that past performance is not a reliable indicator of future performance and/or results. Past Performance or Forward-looking scenarios based upon the reasonable beliefs of the third-party provider are not a guarantee of future performance. Actual results may differ materially from those anticipated in forward-looking or past performance statements. IC Markets makes no representation or warranty and assumes no liability as to the accuracy or completeness of the information provided, nor any loss arising from any investment based on a recommendation, forecast or any information supplied by any third-party.
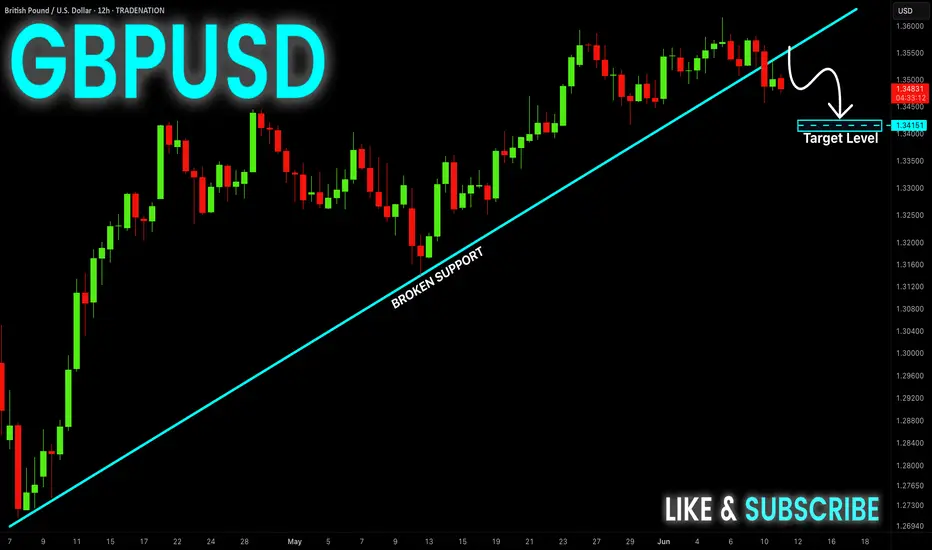
GBP-USD Bearish Breakout! Sell!
Hello,Traders!
GBP-USD made a bearish
Breakout of the rising support
Which is a resistance now and
The breakout is confirmed
So we are bearish biased
And we will be expecting
A further bearish move down
Sell!
Comment and subscribe to help us grow!
Check out other forecasts below too!
Disclosure: I am part of Trade Nation's Influencer program and receive a monthly fee for using their TradingView charts in my analysis.
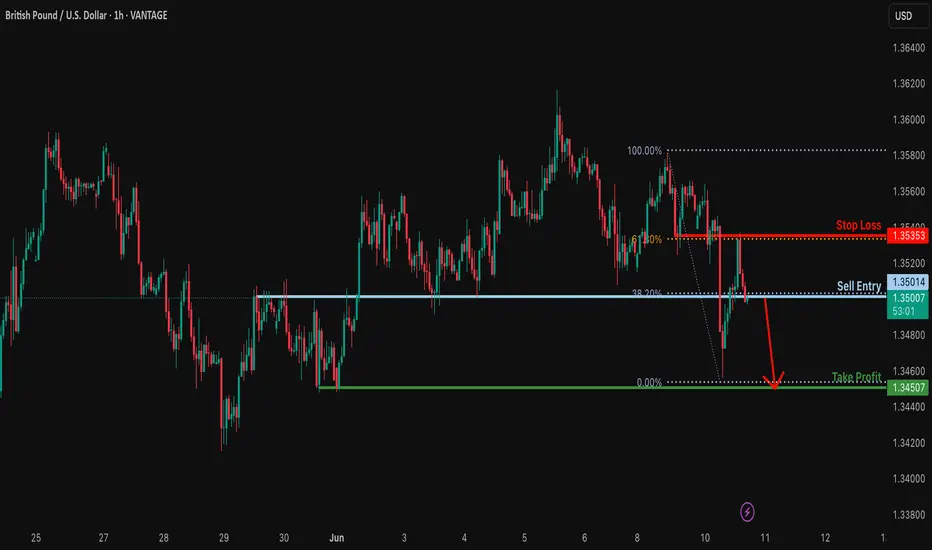
Potential bearish breakout?GBP/USD is reacting off the support level which is an overlap support that aligns with the 38.2% Fibonacci retracement and could drop from this level to our take profit.
Entry: 1.3501
Why we like it:
There is an overlap support level that lines up with the 38.2% Fibonacci retracement.
Stop loss: 1.3535
Why we like it:
There is an overlap resistance level that lines up with the 61.8% Fibonacci retracement.
Take profit: 1.3450
Why we like it:
There is a pullback support level.
Enjoying your TradingView experience? Review us!
Please be advised that the information presented on TradingView is provided to Vantage (‘Vantage Global Limited’, ‘we’) by a third-party provider (‘Everest Fortune Group’). Please be reminded that you are solely responsible for the trading decisions on your account. There is a very high degree of risk involved in trading. Any information and/or content is intended entirely for research, educational and informational purposes only and does not constitute investment or consultation advice or investment strategy. The information is not tailored to the investment needs of any specific person and therefore does not involve a consideration of any of the investment objectives, financial situation or needs of any viewer that may receive it. Kindly also note that past performance is not a reliable indicator of future results. Actual results may differ materially from those anticipated in forward-looking or past performance statements. We assume no liability as to the accuracy or completeness of any of the information and/or content provided herein and the Company cannot be held responsible for any omission, mistake nor for any loss or damage including without limitation to any loss of profit which may arise from reliance on any information supplied by Everest Fortune Group.
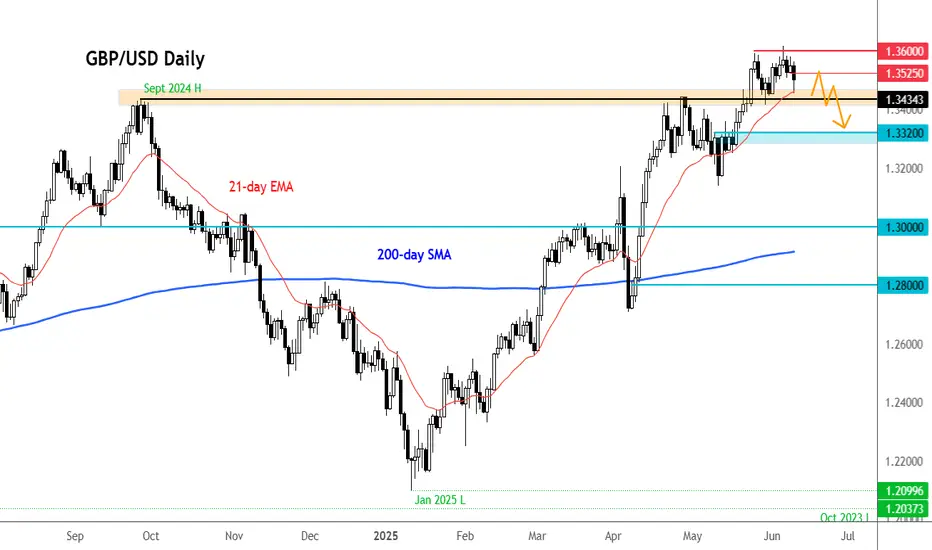
GBP/USD eases off highs again after poor UK dataAfter an initial tumble to just shy of 1.3450 in response to this morning’s disappointing UK jobs and wages print, the pound staged a spirited recovery, climbing back to a high of 1.3536. However, that rebound appears to be fading, with sterling once again drifting lower as the US dollar finds its footing across the board.
The underwhelming labour market data has bolstered expectations for a Bank of England rate cut in August, with a second move potentially on the cards in November, should incoming data allow. With rate cut probabilities on the rise, the pound’s four-month rally could be running out of steam.
June remains in positive territory for GBP/USD, which raises the prospect of a fifth consecutive monthly gain. But that run may be living on borrowed time. Any further deterioration in UK data—or even a modest pick-up in risk appetite favouring the dollar—could well tip the scales back in favour of the greenback.
From a technical standpoint, cable is beginning to look somewhat top-heavy. The key support zone between 1.3430 and 1.3450 has held up thus far, but a clean break below this region would mark a bearish shift in sentiment. Should that occur, a retreat towards the low 1.30s could swiftly come back into play.
By Fawad Razaqzada, market analyst with FOREX.com
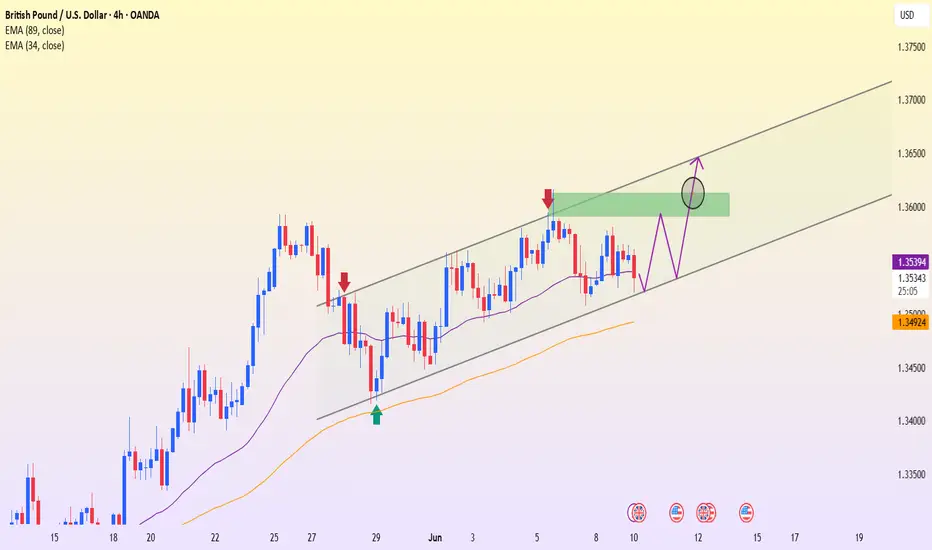
GBPUSD – Holding the Uptrend, Eyeing Resistance BreakoutThe GBPUSD pair continues to respect a well-defined ascending channel on the H4 chart. Each time price retraces to the lower boundary, buying pressure has consistently stepped in. Currently, price is hovering near the channel’s lower edge and the EMA89 – forming a technical support area around 1.35370. If this zone holds, there is a strong potential for a rebound toward the resistance zone near 1.36100–1.36300, which has rejected price twice before.
From a news perspective, markets are awaiting the U.S. CPI report tomorrow. If inflation data comes in weaker, expectations for the Fed to cut interest rates will increase, putting pressure on the USD and allowing GBP to extend gains. Additionally, the Bank of England is expected to maintain a more hawkish stance due to persistent domestic inflation – which further supports the pound’s upward momentum.
Watching the EMA and lower channel boundary is key. If a clear bullish signal forms at this zone, a trend-following long strategy could carry a high probability of success.
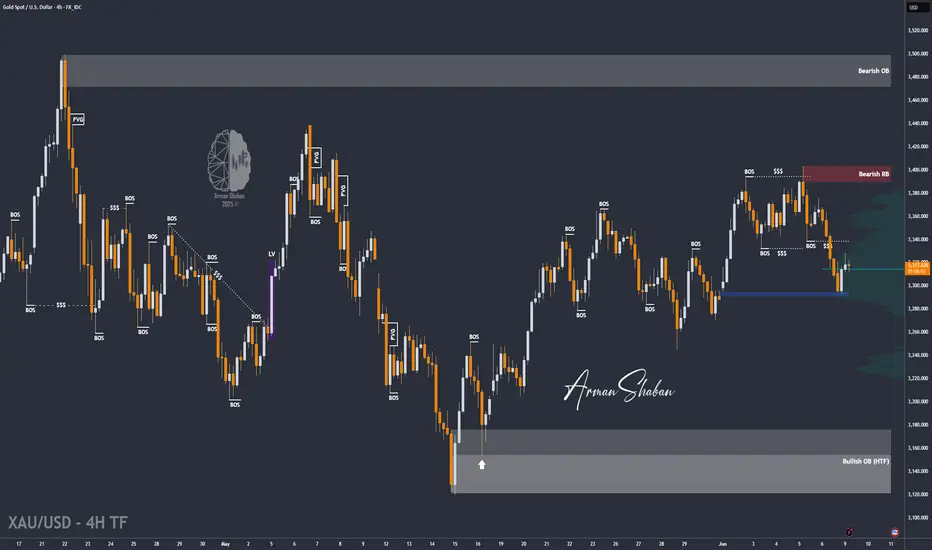
$Gold Fills the Gap – Is a Bullish Bounce Toward $3350 Next?By examining the gold chart on the 4-hour timeframe, we can see that in last week’s analysis, the price successfully hit all four targets: $3338, $3332, $3326, and $3317, and finally closed on Friday at $3309. This move delivered over 390 pips of return, and I hope you made the most out of it!
Now, let’s move on to the latest gold analysis: As you can see, today gold dropped to the $3294 zone, finally filling the liquidity gap previously marked on the chart. Currently, gold is trading around $3315, and I expect further bullish movement toward the $3330 area as the first upside target.
After that, we should closely watch the $3332–$3352 zone for a potential corrective reaction.
There are more details in this analysis that I’ll share soon — with your support!
THE MAIN TA :
DeGRAM | GBPUSD broke the channel📊 Technical Analysis
● Pullback stalled exactly on the purple trend-support (≈1.348) and the channel mid-line after a false break of the upper wedge, preserving the sequence of higher-lows since May.
● Price is basing inside the 1.337-1.353 support strip; reclaim of 1.3530 would invalidate the bearish trap and open the next channel-median / April swing at 1.3590, while the lower rail at 1.3250 guards the up-trend.
💡 Fundamental Analysis
● UK April wage growth held at 5.7 % y/y, keeping BoE tightening bias alive, while softer US CPI expectations cool Treasury yields—narrowing the rate gap and underpinning sterling.
✨ Summary
Long 1.337-1.348; confirmation above 1.353 targets 1.3590, stretch 1.3700. View void on an H4 close below 1.3250.
-------------------
Share your opinion in the comments and support the idea with a like. Thanks for your support!
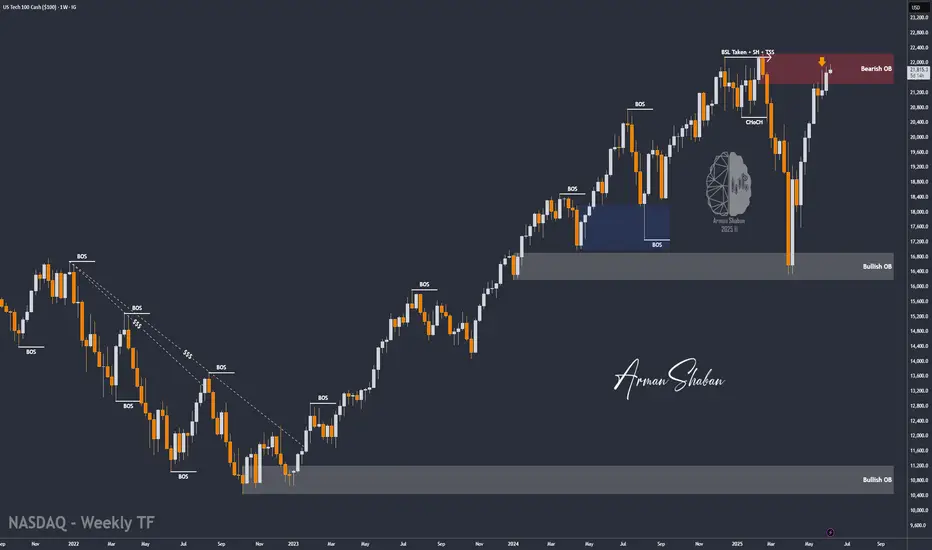
Nasdaq at Supply Zone – Rejection or Breakout? (READ THE CAPTIONBy examining the #Nasdaq chart on the weekly timeframe, we can see that the price is still trading within the supply zone around 21,850. We are still waiting for a strong rejection from this level, which could lead to a short-term price correction in this index.
The potential downside targets are:
21,000, 20,700, 20,200, and 19,150.
The key supply range lies between 21,400 and 22,200.
Additionally, there is a possibility of a liquidity grab or stop-hunt above 22,200 before any real drop begins.
This analysis will be considered invalid if price closes above 22,400 in the next three weeks.
On the fundamental side, there are several macro factors to watch:
Interest Rate Expectations:
Although inflation in the U.S. has cooled compared to last year, the Fed remains cautious. If upcoming CPI or PPI prints show unexpected resilience, the likelihood of rate cuts this year could diminish, pressuring tech-heavy indices like Nasdaq.
Tech Sector Valuations:
Valuations in major tech names — such as NVIDIA, Apple, and Microsoft — have reached historically high multiples. This makes Nasdaq particularly vulnerable to correction, especially if earnings disappoint or growth expectations soften.
Geopolitical Risks:
Ongoing tensions between the U.S. and China over trade and technology, as well as potential instability in the Middle East, could contribute to a risk-off sentiment — further supporting the case for a short-term pullback.
Earnings Season Ahead:
Q2 earnings season is around the corner. Any signs of slowing revenue growth or reduced forward guidance from major tech firms could act as a catalyst for the expected correction.
Please support me with your likes and comments to motivate me to share more analysis with you and share your opinion about the possible trend of this chart with me !
Best Regards , Arman Shaban
GBPUSD SHORT FORECAST Q2 W24 D10 Y25GBPUSD SHORT FORECAST Q2 W24 D10 Y25
Professional Risk Managers👋
Welcome back to another FRGNT chart update📈
Diving into some Forex setups using predominantly higher time frame order blocks alongside confirmation breaks of structure.
Let’s see what price action is telling us today!
💡Here are some trade confluences📝
✅Weekly order block
✅15' order block
✅Intraday 15' break of structure
✅Tokyo ranges to be filled
🔑 Remember, to participate in trading comes always with a degree of risk, therefore as professional risk managers it remains vital that we stick to our risk management plan as well as our trading strategies.
📈The rest, we leave to the balance of probabilities.
💡Fail to plan. Plan to fail.
🏆It has always been that simple.
❤️Good luck with your trading journey, I shall see you at the very top.
🎯Trade consistent, FRGNT X

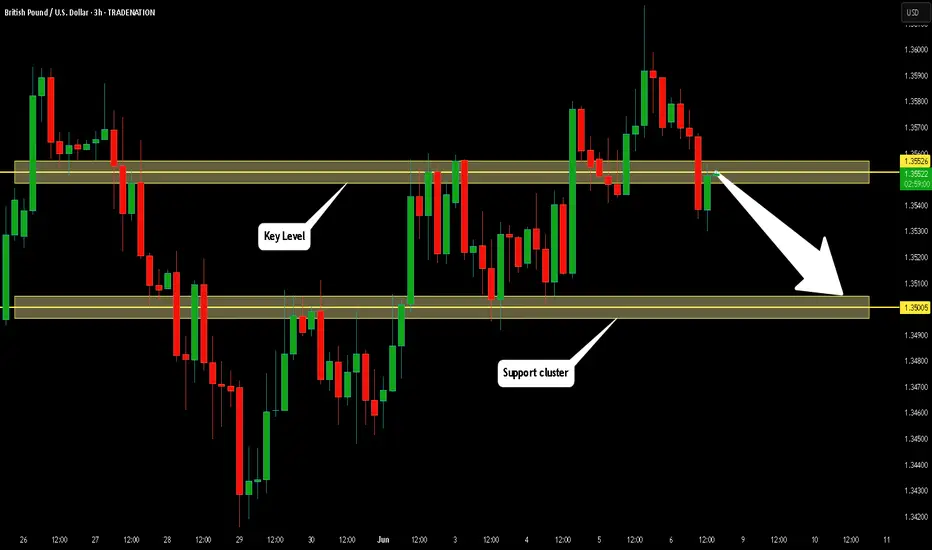
GBPUSD Is Very Bearish! Short!
Please, check our technical outlook for GBPUSD.
Time Frame: 3h
Current Trend: Bearish
Sentiment: Overbought (based on 7-period RSI)
Forecast: Bearish
The price is testing a key resistance 1.355.
Taking into consideration the current market trend & overbought RSI, chances will be high to see a bearish movement to the downside at least to 1.350 level.
P.S
Overbought describes a period of time where there has been a significant and consistent upward move in price over a period of time without much pullback.
Disclosure: I am part of Trade Nation's Influencer program and receive a monthly fee for using their TradingView charts in my analysis.
Like and subscribe and comment my ideas if you enjoy them!
GBPUSD Will Go Down! Short!
Take a look at our analysis for GBPUSD.
Time Frame: 9h
Current Trend: Bearish
Sentiment: Overbought (based on 7-period RSI)
Forecast: Bearish
The market is approaching a key horizontal level 1.356.
Considering the today's price action, probabilities will be high to see a movement to 1.346.
P.S
We determine oversold/overbought condition with RSI indicator.
When it drops below 30 - the market is considered to be oversold.
When it bounces above 70 - the market is considered to be overbought.
Disclosure: I am part of Trade Nation's Influencer program and receive a monthly fee for using their TradingView charts in my analysis.
Like and subscribe and comment my ideas if you enjoy them!

XAUUSD BULLISH OR BEARISH DETAILED ANALYSISXAUUSD is currently forming a clean bullish pennant pattern on the daily timeframe, signaling a potential continuation of the dominant uptrend. After a strong impulsive rally that pushed gold prices to new highs, the market entered into a consolidation phase, tightening within the pennant structure. This type of price action typically precedes a breakout, and with current price action hovering near the upper boundary of the pennant, a bullish breakout looks imminent. If we break above this consolidation zone, the next target stands at 3500, in line with the measured move projection from the prior leg.
From a fundamental standpoint, gold remains in strong demand amid ongoing macroeconomic uncertainties and shifting central bank policies. Recent data out of the US showed signs of a cooling labor market and slowing inflation pressures, increasing the odds of the Federal Reserve leaning toward rate cuts in the second half of 2025. A dovish Fed would weaken the US dollar and lower Treasury yields—two key drivers that historically push gold prices higher. Additionally, continued central bank gold buying globally, especially from emerging markets, is providing a strong underlying bid for XAU.
The current consolidation is healthy and is allowing the market to build momentum before another leg up. Volatility is compressing, volume remains steady, and price structure is respecting key trendlines. Once we get confirmation with a breakout and close above the upper pennant boundary, it would open the door to a swift move toward the 3500 region. Traders should monitor volume and RSI closely for early signs of breakout confirmation.
In this environment of economic uncertainty, demand for safe-haven assets like gold is only increasing. With technicals and fundamentals aligned, XAUUSD is gearing up for a powerful bullish wave. As long as we hold above the key 3280–3300 support range, the bullish thesis remains fully intact. This setup offers excellent reward-to-risk potential and is one of the more compelling opportunities currently on the radar.

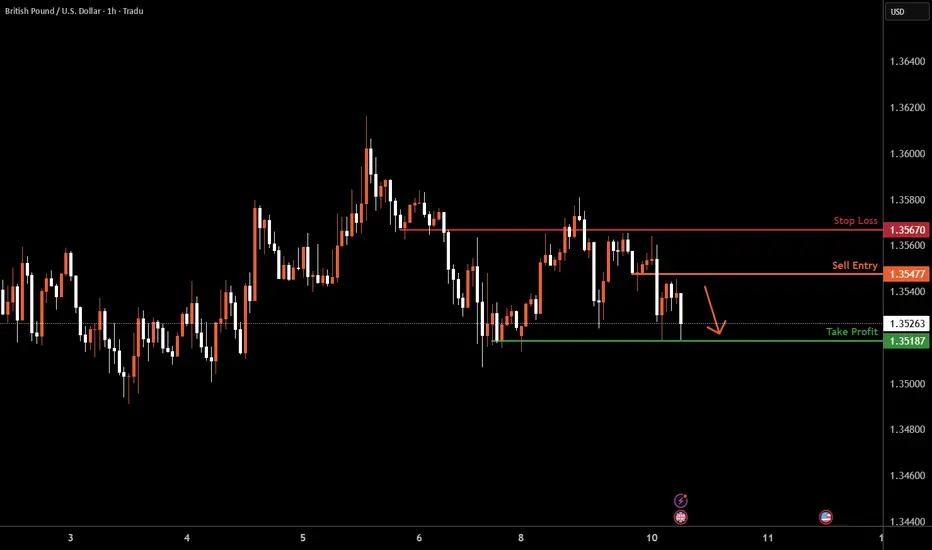
GBPUSD H1 I Bearish Reversal Based on the H1 chart, the price could rise toward our sell entry level at 1.3547, a pullback resistance.
Our take profit is set at 1.3518, a swing low support.
The stop loss is set at 1.3567, a pullback resistance.
High Risk Investment Warning
Trading Forex/CFDs on margin carries a high level of risk and may not be suitable for all investors. Leverage can work against you.
Stratos Markets Limited (tradu.com ):
CFDs are complex instruments and come with a high risk of losing money rapidly due to leverage. 63% of retail investor accounts lose money when trading CFDs with this provider. You should consider whether you understand how CFDs work and whether you can afford to take the high risk of losing your money.
Stratos Europe Ltd (tradu.com ):
CFDs are complex instruments and come with a high risk of losing money rapidly due to leverage. 63% of retail investor accounts lose money when trading CFDs with this provider. You should consider whether you understand how CFDs work and whether you can afford to take the high risk of losing your money.
Stratos Global LLC (tradu.com ):
Losses can exceed deposits.
Please be advised that the information presented on TradingView is provided to Tradu (‘Company’, ‘we’) by a third-party provider (‘TFA Global Pte Ltd’). Please be reminded that you are solely responsible for the trading decisions on your account. There is a very high degree of risk involved in trading. Any information and/or content is intended entirely for research, educational and informational purposes only and does not constitute investment or consultation advice or investment strategy. The information is not tailored to the investment needs of any specific person and therefore does not involve a consideration of any of the investment objectives, financial situation or needs of any viewer that may receive it. Kindly also note that past performance is not a reliable indicator of future results. Actual results may differ materially from those anticipated in forward-looking or past performance statements. We assume no liability as to the accuracy or completeness of any of the information and/or content provided herein and the Company cannot be held responsible for any omission, mistake nor for any loss or damage including without limitation to any loss of profit which may arise from reliance on any information supplied by TFA Global Pte Ltd.
The speaker(s) is neither an employee, agent nor representative of Tradu and is therefore acting independently. The opinions given are their own, constitute general market commentary, and do not constitute the opinion or advice of Tradu or any form of personal or investment advice. Tradu neither endorses nor guarantees offerings of third-party speakers, nor is Tradu responsible for the content, veracity or opinions of third-party speakers, presenters or participants.
GBPUSDHello Traders! 👋
What are your thoughts on GBPUSD?
On the 4-hour timeframe, GBPUSD has broken below its ascending trendline and is now trading below a key resistance zone.
We expect the pair to consolidate briefly within this area, and then move lower toward the specified support level.
As long as the price remains below the resistance and the broken trendline, the bearish bias remains valid.
Don’t forget to like and share your thoughts in the comments! ❤️
Bearish breakout?The Cable (GBP/USD) is falling towards the pivot, which is an overlap support, and could bounce to the 1st resistance which is a pullback resistance.
Pivot: 1.3505
1st Support: 1.3415
1st Resistance: 1.3581
Risk Warning:
Trading Forex and CFDs carries a high level of risk to your capital and you should only trade with money you can afford to lose. Trading Forex and CFDs may not be suitable for all investors, so please ensure that you fully understand the risks involved and seek independent advice if necessary.
Disclaimer:
The above opinions given constitute general market commentary, and do not constitute the opinion or advice of IC Markets or any form of personal or investment advice.
Any opinions, news, research, analyses, prices, other information, or links to third-party sites contained on this website are provided on an "as-is" basis, are intended only to be informative, is not an advice nor a recommendation, nor research, or a record of our trading prices, or an offer of, or solicitation for a transaction in any financial instrument and thus should not be treated as such. The information provided does not involve any specific investment objectives, financial situation and needs of any specific person who may receive it. Please be aware, that past performance is not a reliable indicator of future performance and/or results. Past Performance or Forward-looking scenarios based upon the reasonable beliefs of the third-party provider are not a guarantee of future performance. Actual results may differ materially from those anticipated in forward-looking or past performance statements. IC Markets makes no representation or warranty and assumes no liability as to the accuracy or completeness of the information provided, nor any loss arising from any investment based on a recommendation, forecast or any information supplied by any third-party.
GBPUSD H1 I Bearish Reversal Based on the H1 chart, the price is approaching our sell entry level at 1.3547, a pullback resistance.
Our take profit is set at 1.3518, an overlap support.
The stop loss is set at 1.3567, an overlap resistance.
High Risk Investment Warning
Trading Forex/CFDs on margin carries a high level of risk and may not be suitable for all investors. Leverage can work against you.
Stratos Markets Limited (tradu.com ):
CFDs are complex instruments and come with a high risk of losing money rapidly due to leverage. 63% of retail investor accounts lose money when trading CFDs with this provider. You should consider whether you understand how CFDs work and whether you can afford to take the high risk of losing your money.
Stratos Europe Ltd (tradu.com ):
CFDs are complex instruments and come with a high risk of losing money rapidly due to leverage. 63% of retail investor accounts lose money when trading CFDs with this provider. You should consider whether you understand how CFDs work and whether you can afford to take the high risk of losing your money.
Stratos Global LLC (tradu.com ):
Losses can exceed deposits.
Please be advised that the information presented on TradingView is provided to Tradu (‘Company’, ‘we’) by a third-party provider (‘TFA Global Pte Ltd’). Please be reminded that you are solely responsible for the trading decisions on your account. There is a very high degree of risk involved in trading. Any information and/or content is intended entirely for research, educational and informational purposes only and does not constitute investment or consultation advice or investment strategy. The information is not tailored to the investment needs of any specific person and therefore does not involve a consideration of any of the investment objectives, financial situation or needs of any viewer that may receive it. Kindly also note that past performance is not a reliable indicator of future results. Actual results may differ materially from those anticipated in forward-looking or past performance statements. We assume no liability as to the accuracy or completeness of any of the information and/or content provided herein and the Company cannot be held responsible for any omission, mistake nor for any loss or damage including without limitation to any loss of profit which may arise from reliance on any information supplied by TFA Global Pte Ltd.
The speaker(s) is neither an employee, agent nor representative of Tradu and is therefore acting independently. The opinions given are their own, constitute general market commentary, and do not constitute the opinion or advice of Tradu or any form of personal or investment advice. Tradu neither endorses nor guarantees offerings of third-party speakers, nor is Tradu responsible for the content, veracity or opinions of third-party speakers, presenters or participants.

GBPUSD - Long on fullfillment Looking at GBPUSD
The order flow on the 4HR and 15min are still bullish.
Looking for that upside momentum until we take out a 4HR level of demand.
So until the buyers have had enough and the sellers take over. Lets see what we get overnight.
Will leave a pending order on this until the London open and then re-assess in the morning
If you have any questions don't be shy
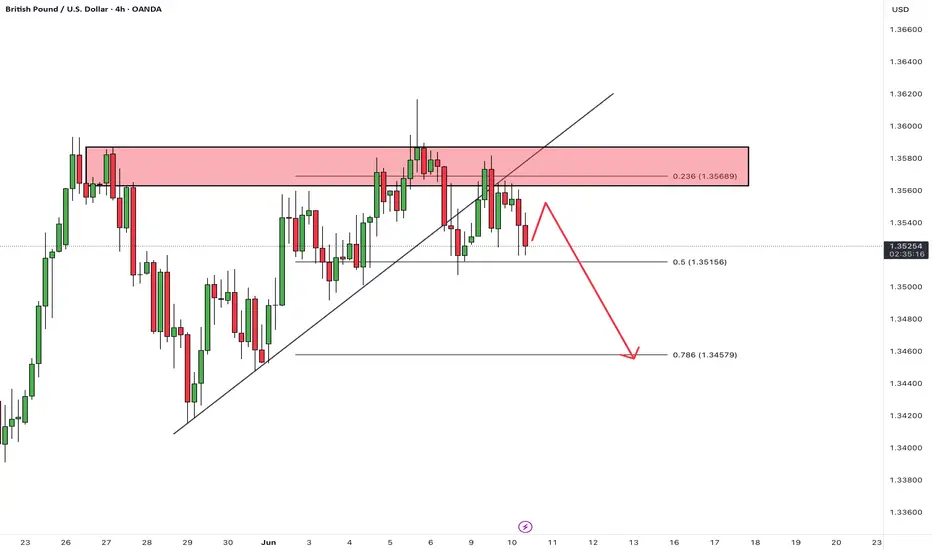
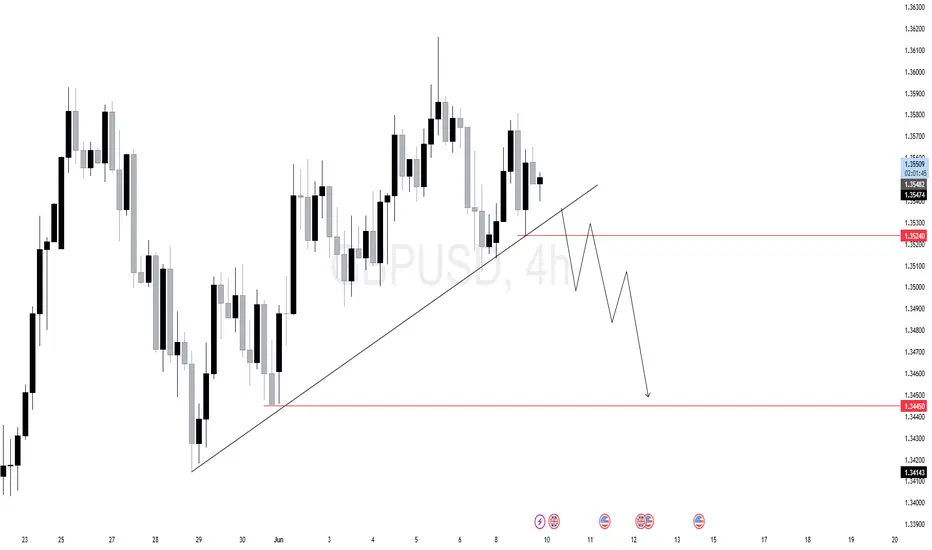
$GU (GBPUSD) 4H AnalysisExpectation: Break of trendline → retest → drop toward 1.34450 liquidity.
Momentum is exhausting near resistance, and price is now testing a key ascending trendline...We’ve swept short-term buy stops and failed to sustain bullish continuation.
Buy-side liquidity above recent highs has been swept.
Now, sell-side liquidity rests below 1.35240 (marked in red), a key equal low / internal liquidity pool...Below that, there’s a clean draw to the 1.34450–1.34143 imbalance zone, where liquidity and inefficiency align.
Price could pull back after the trendline break, then resume bearish continuation.
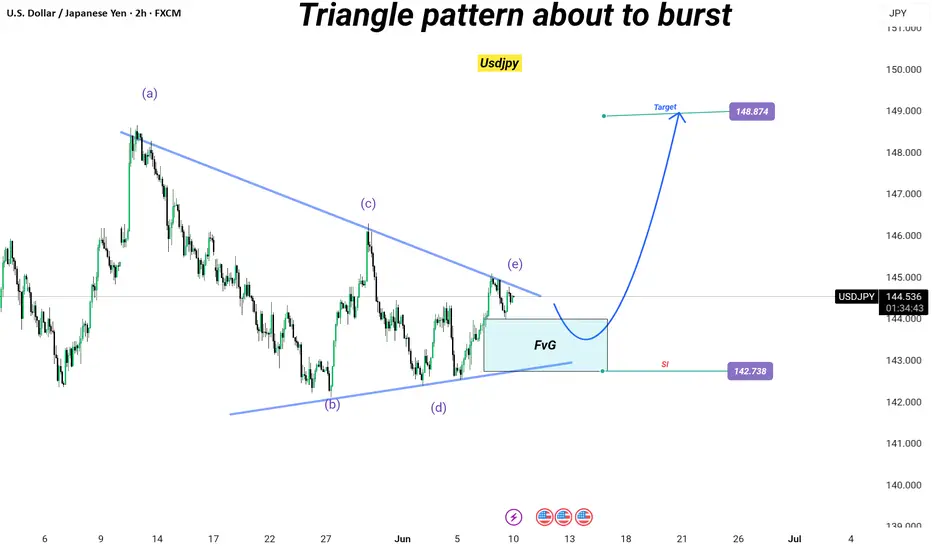
Usdjpy|| — the next move could be explosiveUSD/JPY
Timeframe: 2H
Strategy: Elliott Wave + Triangle Pattern + Fair Value Gap (FvG)
Formation: Contracting Triangle – Wave (a) to (e)
Risk-Reward: High Conviction Setup
Status: On the verge of breakout
🔍 Technical Breakdown:
The chart shows a classic contracting triangle pattern with completed internal waves (a)-(b)-(c)-(d)-(e).
Price is reacting near wave (e), signaling a potential bullish breakout.
A clean Fair Value Gap (FvG) zone lies just below current price — possible last dip before the breakout surge.
Target zone = 148.874, derived from the triangle's height projected from breakout point.
Strong confluence with liquidity hunt below before expansion move.
🎯 Target: 148.874
🛑 Stop Loss: Below 142.738 (SI Level / structural low)
🟢 Entry Trigger: Breakout above trendline + retest confirmation or Smart Money entry at FvG
This setup aligns with Elliott Wave triangle theory, often seen before sharp impulse waves. Smart Money is likely filling orders in the FvG zone before the upward expansion.