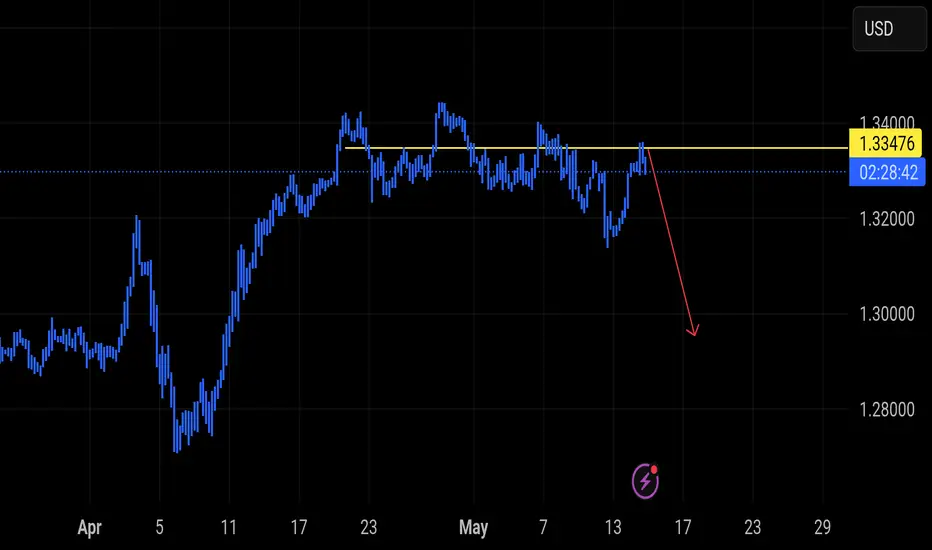
GBPUSD Rejected Key Resistance – Bearish Continuation in Play?
**Pair:** GBPUSD
**Current Price:** ~1.3340
**Bias:** Bearish
---
**Analysis:**
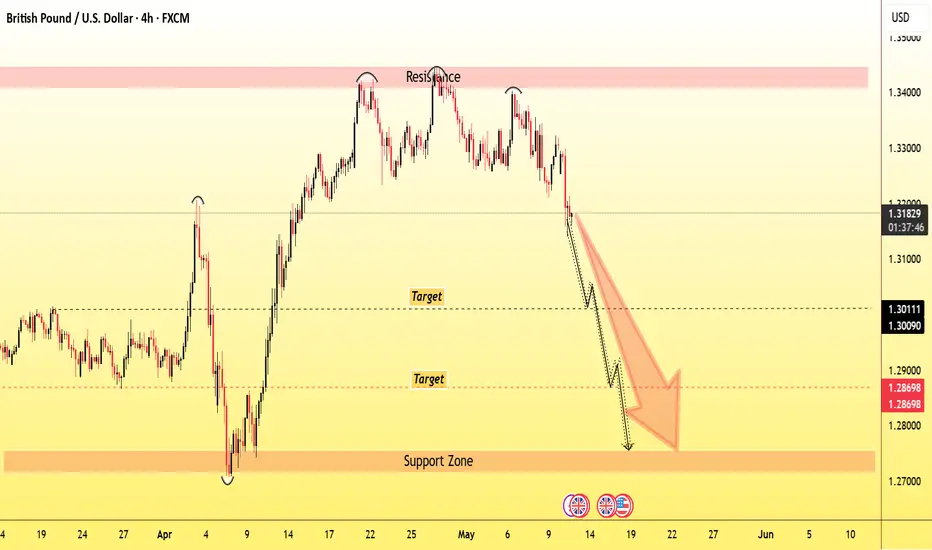
GBPUSD has rejected a key resistance level around **1.3340**, which has historically acted as a strong barrier. After multiple failed attempts to break above, price formed a **lower high** and is now pushing lower with bearish momentum.
The recent move suggests a shift in sentiment, with sellers likely aiming for the next key levels near **1.3000** and potentially **1.2800**, where prior support zones exist.
---
**Technical Highlights:**
- **Resistance Level:** 1.3340 (historical supply zone)
- **Market Structure:** Lower highs, early signs of bearish trend
- **Target Zone:** 1.3000 – 1.2800
- **Invalidation:** Sustained move above 1.3500
---
**Trade Idea (Not Financial Advice):**
Look for potential short opportunities on lower timeframes, ideally after a bearish retest near 1.3340 with confirmation.
---
> **Disclaimer:**
> This analysis is for educational purposes only and does not constitute financial advice. Trading involves significant risk, and you should always conduct your own research and use proper risk management. Past performance does not guarantee future results.
Gbpusd_forecast
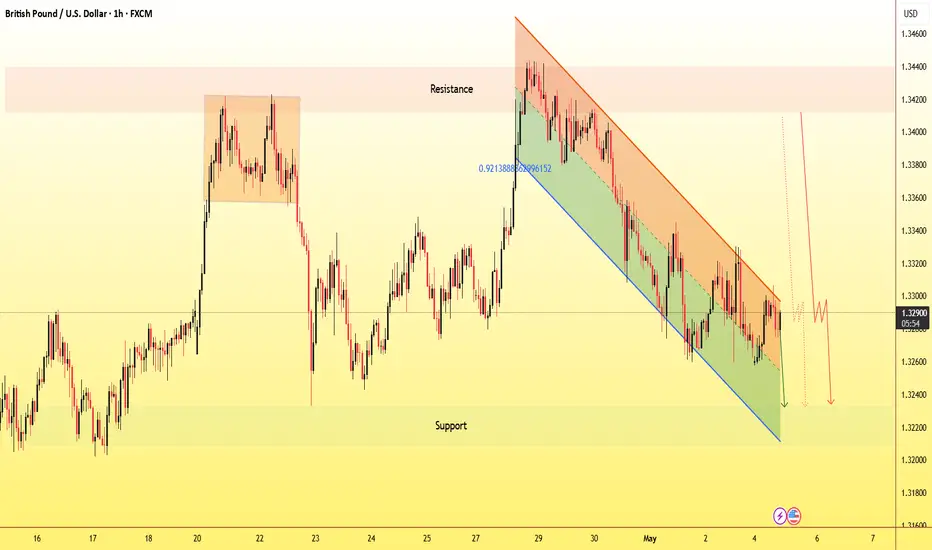
GBP/USD Bullish Playbook – Multi-Timeframe Strategy (May 2025)GBP/USD is in a clear daily uptrend, with price respecting an ascending channel since December 2024. A recent pullback to the 1.3200–1.3250 support zone set the stage for a bounce, aligning with a 1-hour double bottom and a 15-minute bull flag forming around 1.3300–1.3360.
Key short-term levels:
Support: 1.3300–1.3310 (H1 neckline & intraday trendline).
Resistance: 1.3360–1.3370 (flag high and daily breakout zone).
Trading plan:
Buy dips near 1.3300 with stops under 1.3285.
Target: 1.3360, then 1.3400–1.3450.
Breakout trade: Long above 1.3370 if momentum holds.
Fade scenario: Short 1.3360 rejections back to 1.3320.
All three timeframes support a bullish bias into higher highs, with clean setups and tight stops. This plan favors high-RR trades in a tight range with breakout potential.
GBPUSD LIVE TRADE AND EDUCATIONAL BREAKDOWN FOR BEGINNERS 218PIPGBP/USD holds recovery gains near 1.3350 as US Dollar loses further ground
GBP/USD is trading near 1.3350 in Wednesday’s European session, extending Tuesday's 1% rally. The pair capitalizes on renewed US Dollar sell-off even as risk sentiment turns negative. Fedspeak and trade talks remain in focus.

Market Analysis: GBP/USD Edges HigherMarket Analysis: GBP/USD Edges Higher
GBP/USD is attempting a fresh increase above the 1.3270 resistance.
Important Takeaways for GBP/USD Analysis Today
- The British Pound is attempting a fresh increase above 1.3250.
- There was a break above a key bearish trend line with resistance at 1.3270 on the hourly chart of GBP/USD at FXOpen.
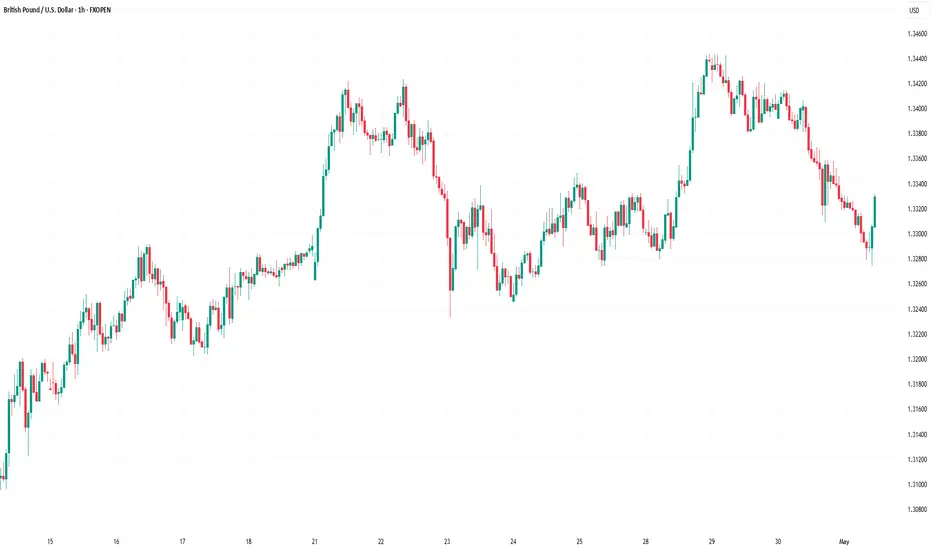
GBP/USD Technical Analysis
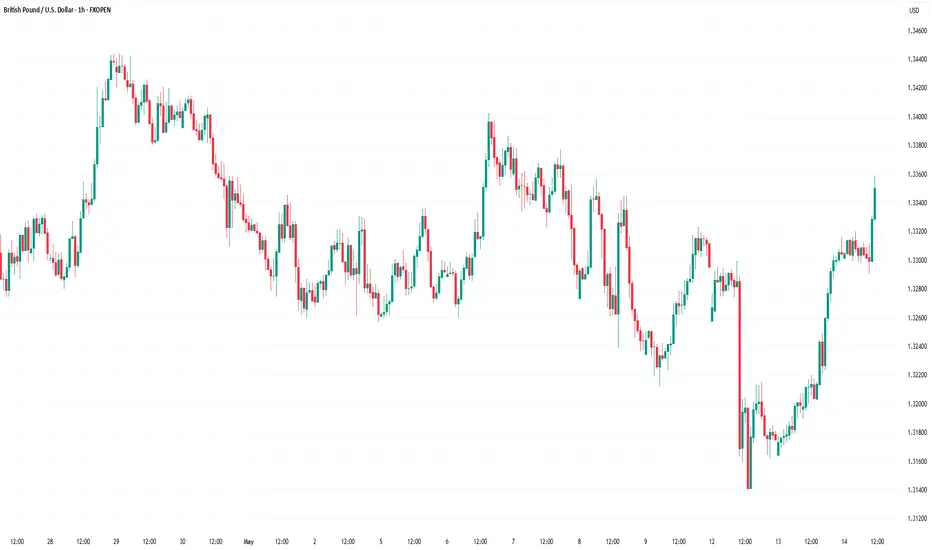
On the hourly chart of GBP/USD at FXOpen, the pair declined after it failed to clear the 1.3440 resistance. As mentioned in the previous analysis, the British Pound traded below the 1.3200 support against the US Dollar.
Finally, the pair tested the 1.3140 zone and is currently attempting a fresh increase. The bulls were able to push the pair above the 50-hour simple moving average and 1.3215.
There was a break above a key bearish trend line with resistance at 1.3270. The pair surpassed the 50% Fib retracement level of the downward move from the 1.3402 swing high to the 1.3139 low. It is now showing positive signs above 1.3300.
On the upside, the GBP/USD chart indicates that the pair is facing resistance near 1.3340 and the 76.4% Fib retracement level of the downward move from the 1.3402 swing high to the 1.3139 low.
The next major resistance is near 1.3400. A close above the 1.3400 resistance zone could open the doors for a move toward 1.3440. Any more gains might send GBP/USD toward 1.3500.
On the downside, immediate support is near 1.3270. If there is a downside break below 1.3270, the pair could accelerate lower. The first major support is near the 1.3215 level and the 50-hour simple moving average.
The next key support is seen near 1.3140, below which the pair could test 1.3080. Any more losses could lead the pair toward the 1.3000 support.
This article represents the opinion of the Companies operating under the FXOpen brand only. It is not to be construed as an offer, solicitation, or recommendation with respect to products and services provided by the Companies operating under the FXOpen brand, nor is it to be considered financial advice.
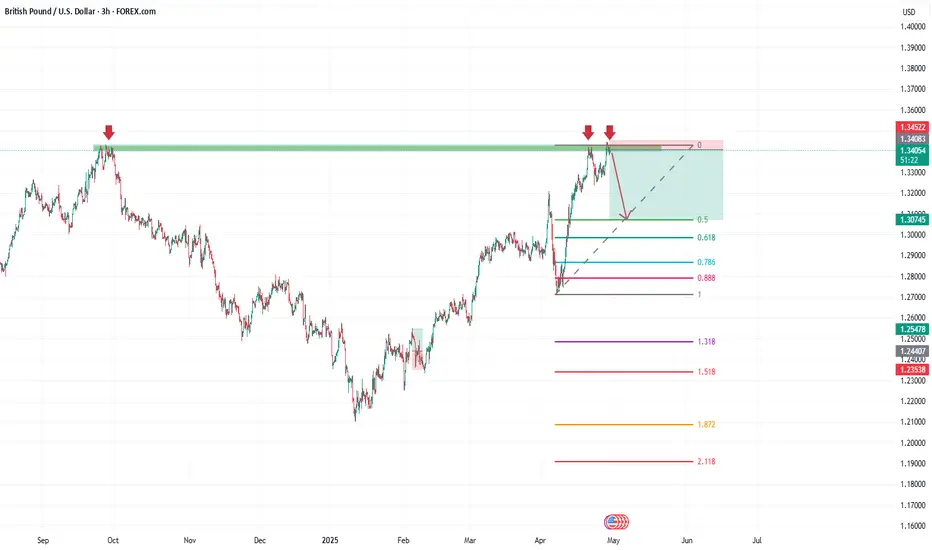
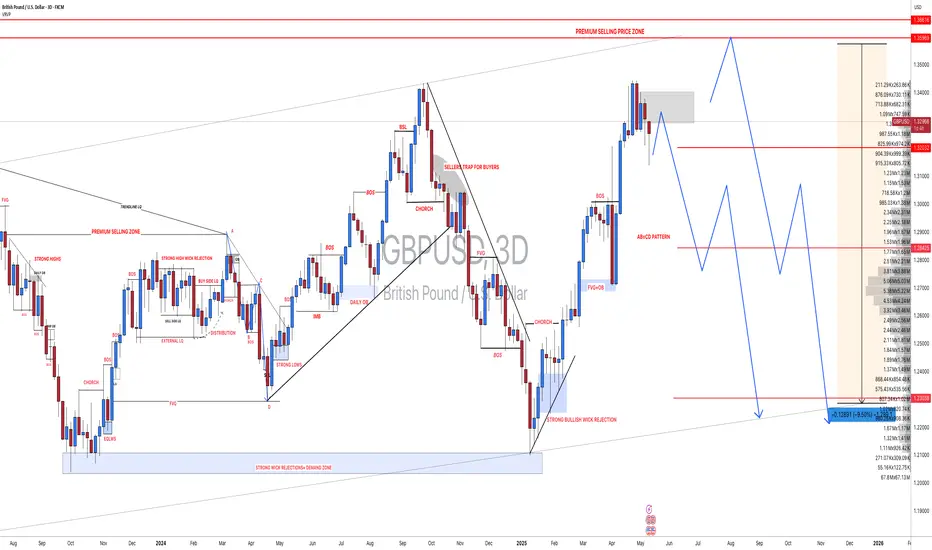
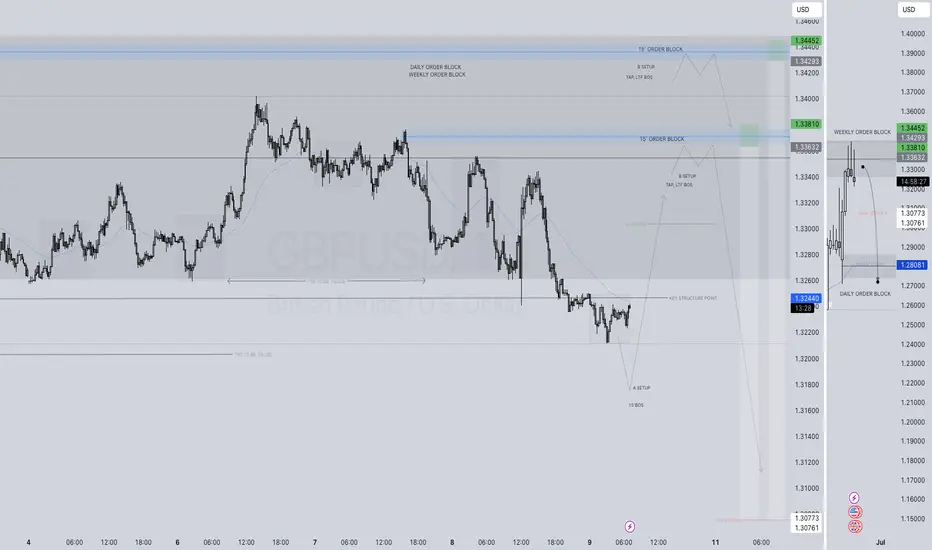
GBPUSD SHORT FORECAST Q2 W20 D14 Y25GBPUSD SHORT FORECAST Q2 W20 D14 Y25
Professional Risk Managers👋
Welcome back to another FRGNT chart update📈
Diving into some Forex setups using predominantly higher time frame order blocks alongside confirmation breaks of structure.
Let’s see what price action is telling us today!
💡Here are some trade confluences📝
✅Weekly order block rejection
✅Daily order block rejection
✅Intraday 15' order blocks
✅Tokyo ranges to be filled
🔑 Remember, to participate in trading comes always with a degree of risk, therefore as professional risk managers it remains vital that we stick to our risk management plan as well as our trading strategies.
📈The rest, we leave to the balance of probabilities.
💡Fail to plan. Plan to fail.
🏆It has always been that simple.
❤️Good luck with your trading journey, I shall see you at the very top.
🎯Trade consistent, FRGNT X

GBPUSD: Strong Sell Momentum Built Up! What is next?GBPUSD is building strong sell momentum, increasing sell volume. At the same time, DXY is in correction mode, so keep that in mind. If DXY plummets again, it may invalidate our first entry. However, there’s a second entry that could be a safer zone for those looking for a stable entry.
There are three take profit targets that can be set according to your trading plan. This analysis doesn’t guarantee that the price will move as described.
Good luck and trade safely!
Thank you for your unwavering support! 😊
If you’d like to contribute, here are a few ways you can help us:
- Like our ideas
- Comment on our ideas
- Share our ideas
Team Setupsfx_
❤️🚀
GBP/USD Multi-Timeframe Summary (May 13–17):GBP/USD Multi-Timeframe Summary (May 13–17):
On the daily chart, GBP/USD faces strong resistance at 1.345–1.350 (double-top) and support near 1.280–1.290. The recent pullback to 1.320 aligns with the 61.8% retracement of the April–May rally.
On the hourly chart, price is consolidating in a falling channel between 1.318–1.336, with a bear trap on May 8 indicating demand near the lows. A clean hourly break above 1.336 suggests momentum toward 1.345, while a break below 1.318 targets the 1.300–1.290 daily demand zone.
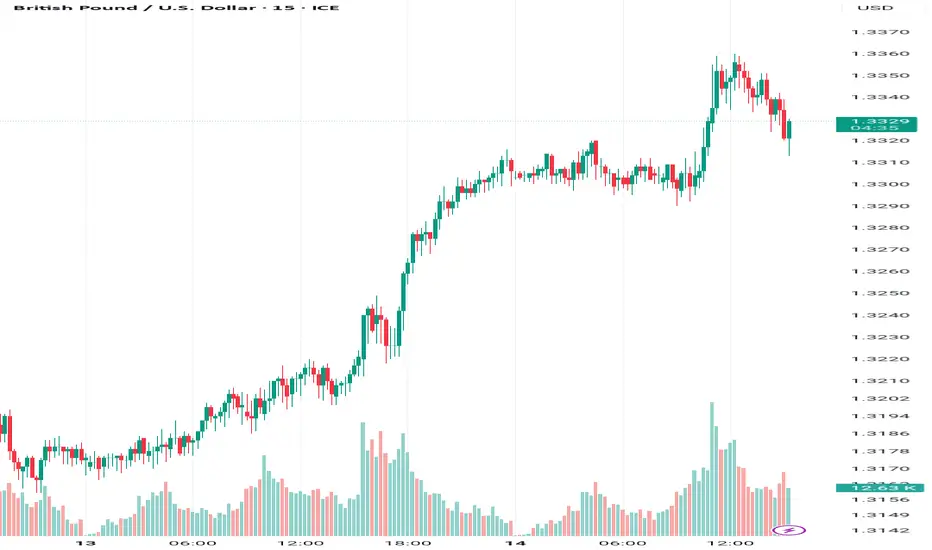
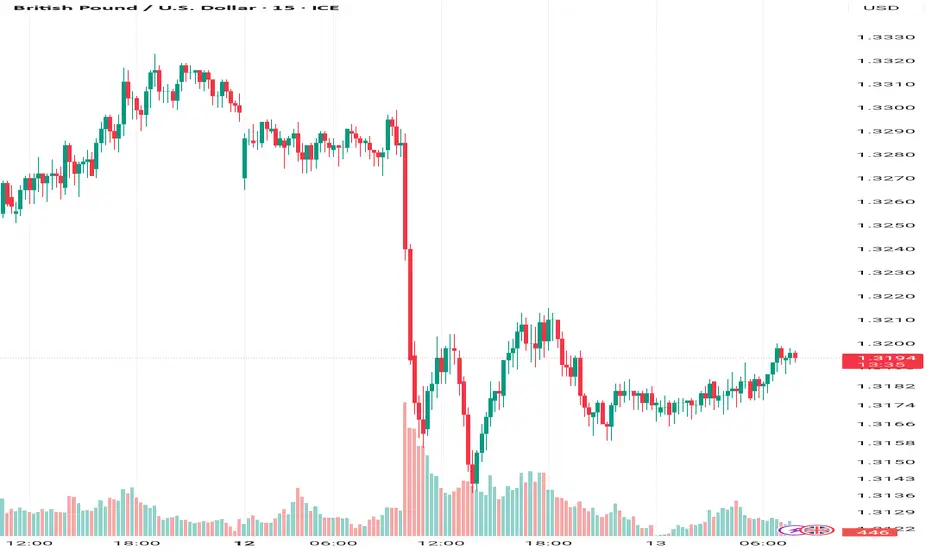
The 15-minute chart shows a V-reversal from 1.314, followed by a tight flag between 1.318–1.322. This zone offers short-term breakout or fade trades.
Key levels:
Resistance: 1.336, 1.345
Support: 1.318, 1.312, 1.290
Trade triggers: Buy >1.322, Sell <1.318 (tight stops, 15–30 pip targets)
Strategy:
Scalp intraday flags on 15′, trade hourly range extremes, and watch for a breakout from the daily structure.
GBPUSD INVERSE CUP AND HANDLE PATTERNTechnical Overview
Resistance Level: 1.34400
Support Level: 1.27500
Bearish Targets: 1.30200 and 1.28800
The resistance at 1.34400 represents the peak before the formation of the inverted cup, serving as a critical level where selling pressure may intensify. The support at 1.27500 aligns with the neckline of the pattern; a decisive break below this level would confirm the bearish breakout, potentially leading to the projected targets.
📉 Trading Strategy
Consider entering a short position upon a confirmed break below the 1.27500 support level, accompanied by increased trading volume to validate the breakout.
Place a stop-loss order above the handle's peak, near 1.34400, to protect against false breakouts and limit potential losses.
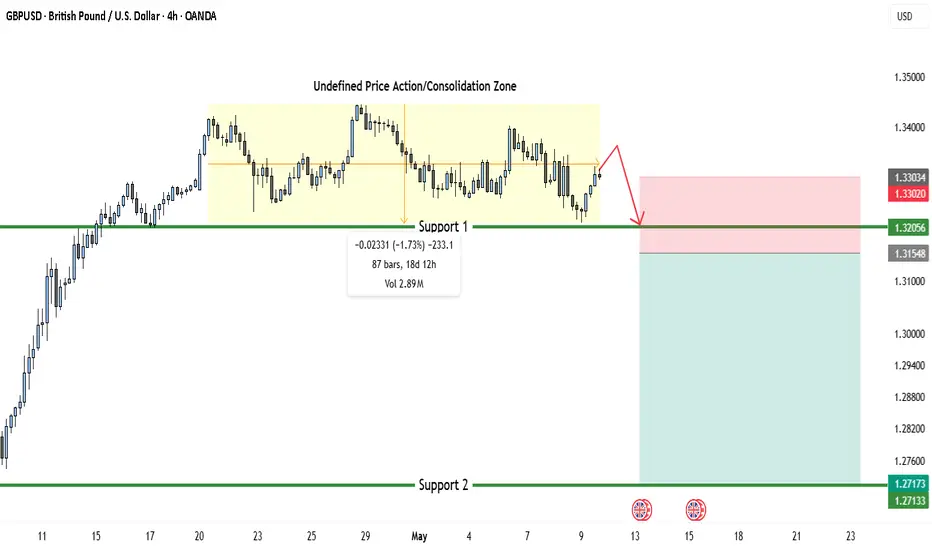
GBP/USD Trading Idea: Sell Below 1.32056 Targeting 1.27133The GBP/USD pair is currently trading within an Undefined Price Action/Consolidation Zone, suggesting indecision and reduced momentum. Price has been moving sideways for several days with no clear trend direction. This area typically signals accumulation or distribution before a breakout.
Key Levels Identified
Support 1 (Breakout Level): 1.32056
Support 2 (Target Level): 1.27133 – 1.27173 (zone)
Resistance (Invalidation Zone): Around 1.33034
Trade Setup (Bearish Bias Upon Breakout)
Trade Idea
Price is currently ranging but has tested the Support 1 zone multiple times. The more a support level is tested, the weaker it becomes. A clean break below Support 1 (1.32056) would likely signal the end of the consolidation phase and could trigger a strong bearish move. If this breakdown occurs, a short position becomes valid.
Entry
Sell Stop Order below 1.32056 (e.g., at 1.31950) to catch the breakout momentum.
Take Profit (TP)
Primary Target: Support 2 zone between 1.27133 and 1.27173, representing a major historical support level. This provides a potential reward of approximately 480 pips from entry.
Stop Loss (SL)
Placed above recent swing high and resistance of the range: around 1.33034.
Risk is about 90 pips, providing a Risk-Reward Ratio (RRR) of ~1:5 – favorable for short sellers.
Additional Notes
Volume Analysis: Volume appears to have dropped inside the consolidation zone, often indicating a buildup phase. A breakout with rising volume would confirm the trade signal.
Event Risk: UK-related macroeconomic events are marked on May 13 and 15. Monitor for volatility which could trigger the breakout.
Bias: Currently unbiased but leaning bearish due to:
Flat momentum within the zone
Multiple failures to sustain above mid-range
Potential for breakdown continuation aligned with the higher time frame trend
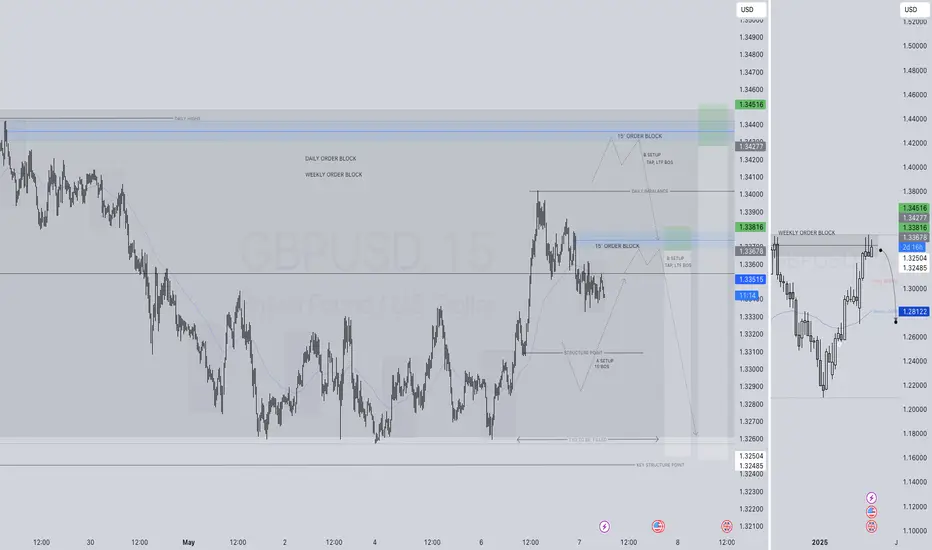
GBPUSD SHORT FORECAST Q2 W19 D9 Y25GBPUSD SHORT FORECAST Q2 W19 D9 Y25
Professional Risk Managers👋
Welcome back to another FRGNT chart update📈
Diving into some Forex setups using predominantly higher time frame order blocks alongside confirmation breaks of structure.
Let’s see what price action is telling us today!
💡Here are some trade confluences📝
✅Weekly order block rejection
✅Daily order block rejection
✅Intraday 15' order blocks
✅Tokyo ranges to be filled
🔑 Remember, to participate in trading comes always with a degree of risk, therefore as professional risk managers it remains vital that we stick to our risk management plan as well as our trading strategies.
📈The rest, we leave to the balance of probabilities.
💡Fail to plan. Plan to fail.
🏆It has always been that simple.
❤️Good luck with your trading journey, I shall see you at the very top.
🎯Trade consistent, FRGNT X
GBPUSD STRONG DOWNTRND PATTERNTechnical Analysis
1. Trend Overview:
The GBP/USD pair is in a strong bearish trend, confirmed by:
Price consistently forming lower highs and lower lows
Breakdown of key support zones(1.3200), turning them into new resistance (especially 1.34400)
Momentum oscillators and moving averages showing sustained downward pressure
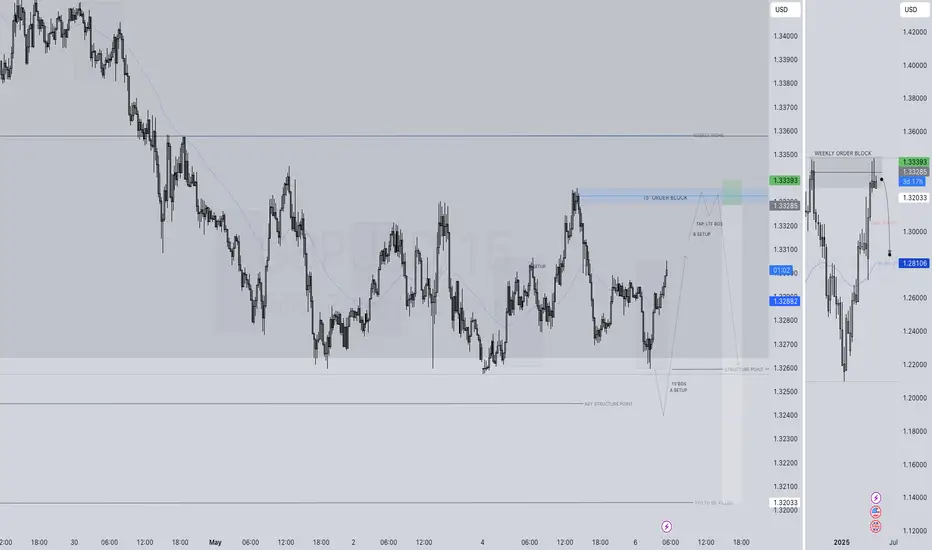
GBPUSD SHORT FORECAST Q2 W19 D7 Y25GBPUSD SHORT FORECAST Q2 W19 D7 Y25
Professional Risk Managers👋
Welcome back to another FRGNT chart update📈
Diving into some Forex setups using predominantly higher time frame order blocks alongside confirmation breaks of structure.
Let’s see what price action is telling us today!
💡Here are some trade confluences📝
✅Weekly order block rejection
✅Daily order block rejection
✅Intraday 15' order blocks
✅Tokyo ranges to be filled
🔑 Remember, to participate in trading comes always with a degree of risk, therefore as professional risk managers it remains vital that we stick to our risk management plan as well as our trading strategies.
📈The rest, we leave to the balance of probabilities.
💡Fail to plan. Plan to fail.
🏆It has always been that simple.
❤️Good luck with your trading journey, I shall see you at the very top.
🎯Trade consistent, FRGNT X
GBPUSD SHORT FORECAST Q2 W19 D6 Y25GBPUSD SHORT FORECAST Q2 W19 D6 Y25
Professional Risk Managers👋
Welcome back to another FRGNT chart update📈
Diving into some Forex setups using predominantly higher time frame order blocks alongside confirmation breaks of structure.
Let’s see what price action is telling us today!
💡Here are some trade confluences📝
✅Weekly order block rejection
✅Daily order block rejection
✅Intraday 15' order blocks
✅Tokyo ranges to be filled
🔑 Remember, to participate in trading comes always with a degree of risk, therefore as professional risk managers it remains vital that we stick to our risk management plan as well as our trading strategies.
📈The rest, we leave to the balance of probabilities.
💡Fail to plan. Plan to fail.
🏆It has always been that simple.
❤️Good luck with your trading journey, I shall see you at the very top.
🎯Trade consistent, FRGNT X
GBP/USD at a Crossroads: Breakout or Breakdown?The GBP/USD has been in a strong uptrend since early 2025, rallying from around 1.2100 to a recent peak near 1.3450.
The daily chart shows a pullback from this high, indicating consolidation or a corrective phase. Despite short-term bearish pressure, the broader trend remains intact above key support at 1.3200 and 1.3000.
On the hourly chart, price action reveals a consolidation range between 1.3260 and 1.3400, forming lower highs and signaling potential bearish continuation if support at 1.3320 breaks. Conversely, repeated rejections below 1.3400 without major selloffs suggest buyers may still be present.
The 15-minute chart highlights tight intraday consolidation between 1.3335 and 1.3355, forming a potential bear flag or ascending triangle. A break below 1.3320 could target 1.3280–1.3250.
A breakout above 1.3380–1.3400 may resume the uptrend toward 1.3450–1.3500.
The higher-probability scenario is a bullish continuation, but caution is advised given decreasing momentum.

GBP/USD Short Trade Setup: Reversal from 1.34370 with Target at Entry Point:
Marked at 1.34370, where the analyst anticipates a reversal or price rejection.
Stop Loss:
Positioned above at 1.34975, covering a 2.62% risk margin. This is a protective level in case the price moves against the trade.
Target (Take Profit):
Set at 1.31015, just above a strong support zone around 1.30818. This is where the analyst expects the price to eventually fall.
Resistance Point:
Noted around 1.33007 – 1.32859, acting as an intermediate level of interest and possible price reaction zone.

2025 SO FAR GBPUSD GBPUSD took support from support line,
currency pair was bullish for 4 months, My analysis target met properly.
folllow me for simple and accurate
swing analysis of INDICE - CURRENCY - COMMODITIES.

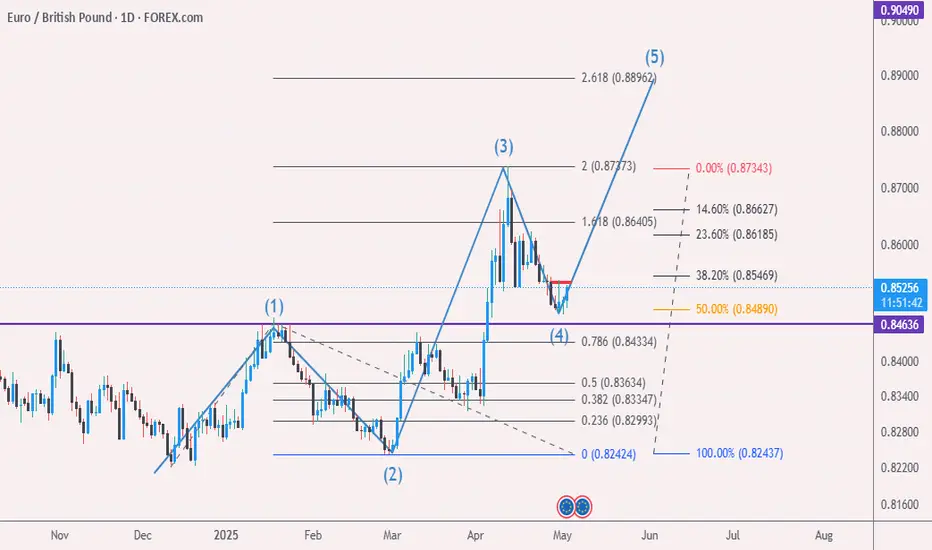
Eur/Gbp Elliott wave May/02 hello eveyone...
as you can see it seems wave 4 completed ( Holding 50% ) and wave 5 can start....
Market Analysis: GBP/USD Corrects GainsMarket Analysis: GBP/USD Corrects Gains
GBP/USD started a downside correction from the 1.3450 zone.
Important Takeaways for GBP/USD Analysis Today
- The British Pound rallied above 1.3200 and 1.3320 before the bears appeared.
- There is a key bearish trend line forming with resistance at 1.3375 on the hourly chart of GBP/USD at FXOpen.
GBP/USD Technical Analysis
On the hourly chart of GBP/USD at FXOpen, the pair formed a base above the 1.3200 level. The British Pound started a steady increase above the 1.3320 resistance zone against the US Dollar, as discussed in the previous analysis.
The pair even cleared 1.3400 before the bears appeared. A high was formed at 1.3443 before there was a downside correction. There was a move below the 1.3400 and 1.3350 levels.
A low was formed at 1.3301 and the pair is now consolidating losses. On the upside, the pair is facing resistance near the 1.3335 level and the 23.6% Fib retracement level of the downward move from the 1.3443 swing high to the 1.3301 low.
The next key resistance near the 1.3375 level. There is also a key bearish trend line forming with resistance at 1.3375. The trend line is near the 50% Fib retracement level of the downward move from the 1.3443 swing high to the 1.3301 low.
An upside break above the 1.3375 zone could send the pair toward 1.3410. Any more gains might open the doors for a test of 1.3445.
If there is another decline, the pair could find support near the 1.3300 level. The first major support sits near the 1.3245 zone. The next major support is 1.3200. If there is a break below 1.3200, the pair could extend the decline. The next key support is near the 1.3150 level. Any more losses might call for a test of the 1.3080 support.
This article represents the opinion of the Companies operating under the FXOpen brand only. It is not to be construed as an offer, solicitation, or recommendation with respect to products and services provided by the Companies operating under the FXOpen brand, nor is it to be considered financial advice.
GBPUSD SHORT FORECAST Q2 W18 D1 Y25GBPUSD SHORT FORECAST Q2 W18 D1 Y25
Professional Risk Managers👋
Welcome back to another FRGNT chart update📈
Diving into some Forex setups using predominantly higher time frame order blocks alongside confirmation breaks of structure.
Let’s see what price action is telling us today!
💡Here are some trade confluences📝
✅Weekly order block rejection
✅Daily order block rejection
✅Daily high rejection
✅Daily imbalance fill targets
🔑 Remember, to participate in trading comes always with a degree of risk, therefore as professional risk managers it remains vital that we stick to our risk management plan as well as our trading strategies.
📈The rest, we leave to the balance of probabilities.
💡Fail to plan. Plan to fail.
🏆It has always been that simple.
❤️Good luck with your trading journey, I shall see you at the very top.
🎯Trade consistent, FRGNT X

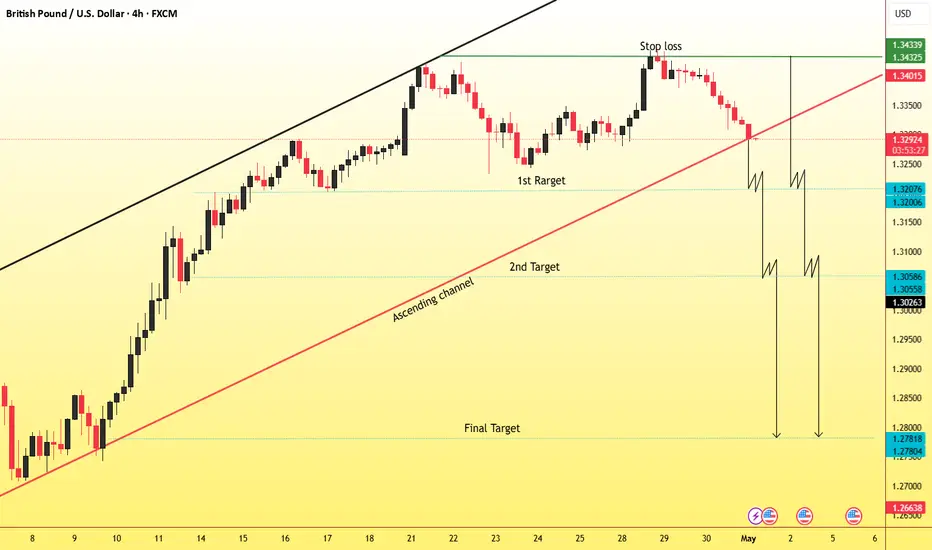
GBPUSD STRONG BEARISH PATTERN (H4)Bearish Scenario for GBP/USD
Current Sentiment: The GBP/USD market is displaying a continuous bearish pattern, indicating strong selling pressure. Price action suggests that bears are in control, pushing the pair lower through support levels.
Entry: Price is currently trending downwards after a potential lower high formation, breaking key support zones.
Bearish Targets:
1st Target: 1.32000 – This level aligns with a minor support area where previous consolidation occurred. A breach here confirms continued selling momentum.
2nd Target: 1.30600 – Historical support level; expect a potential short-term bounce or consolidation.
Final Target: 1.28100 – Major support level from previous long-term lows. A break below this could signal a shift in the broader market structure.
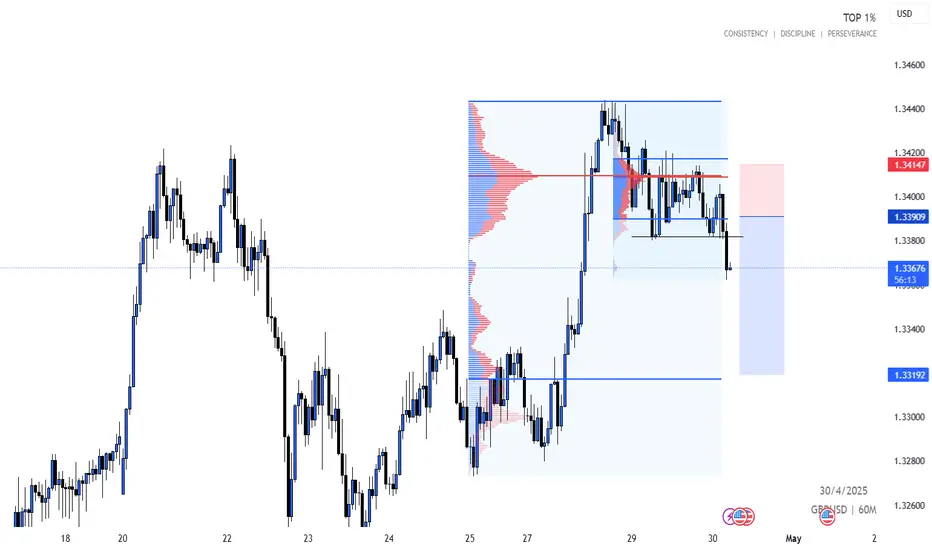
GBP/USD Breakdown Below Value Area –Bearish Continuation in PlanGBP/USD has broken below the recent range low near 1.3380, confirming a potential shift in structure. This move comes after multiple failed attempts to sustain above the Point of Control (POC) at 1.3415, where high volume previously suggested heavy positioning.
The volume profile reveals a low-volume node just below the current price, which may accelerate price movement toward the next significant high-volume support zone around 1.3319.
🔹 Bias: Bearish
🔹 Entry Confirmation: Break and close below 1.3380
🔹 Target: 1.3319
🔹 Stop Loss: Above 1.3415 (POC & resistance zone)
This setup aligns with a rejection from value area highs and a breakdown into thin liquidity zones. I’ll be watching for volume confirmation and price behavior at lower levels for continuation or reversal clues.
🧠 Plan your trade, trade your plan.
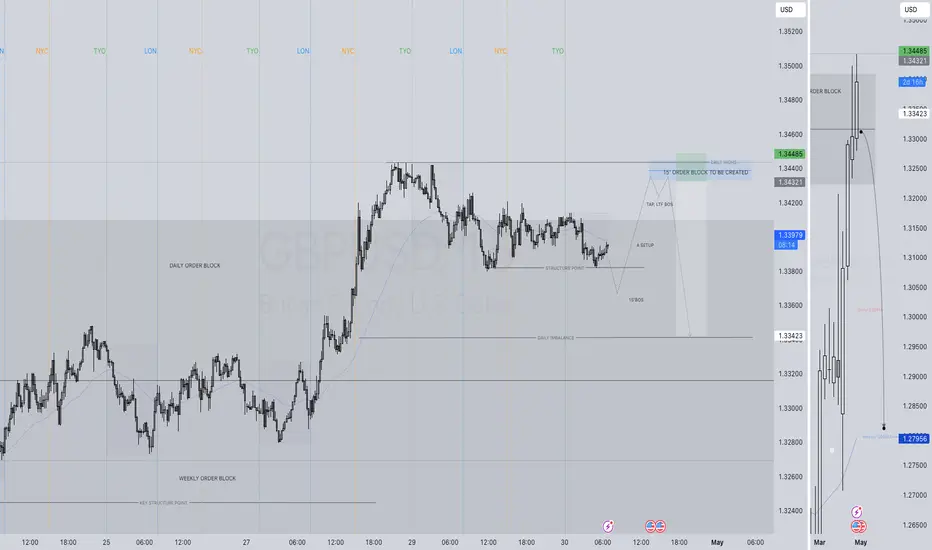
GBPUSD SHORT FORECAST Q2 W18 D30 Y25GBPUSD SHORT FORECAST Q2 W18 D30 Y25
Professional Risk Managers👋
Welcome back to another FRGNT chart update📈
Diving into some Forex setups using predominantly higher time frame order blocks alongside confirmation breaks of structure.
Let’s see what price action is telling us today!
💡Here are some trade confluences📝
✅Weekly order block rejection
✅Daily order block rejection
✅Daily high rejection
✅Daily imbalance fill targets
🔑 Remember, to participate in trading comes always with a degree of risk, therefore as professional risk managers it remains vital that we stick to our risk management plan as well as our trading strategies.
📈The rest, we leave to the balance of probabilities.
💡Fail to plan. Plan to fail.
🏆It has always been that simple.
❤️Good luck with your trading journey, I shall see you at the very top.
🎯Trade consistent, FRGNT X
GBPUSD SELL/SHORTBy utilizing levels, historical patterns, , we can formulate a hypothesis that the market might follow a similar trajectory if bearish sentiment prevails.