GBP/USD Is About to Explode – Here’s Why This Level Matters🚨 GBP/USD at a Critical Zone – Breakout or Reversal?
Let’s break down the price action from a technical perspective 👇
📊 Daily Technical Analysis – GBP/USD (April 2025)
The GBP/USD pair is trading near a key inflection point, with price action hinting at a potential breakout — or a deeper correction.
📈 Trend Overview:
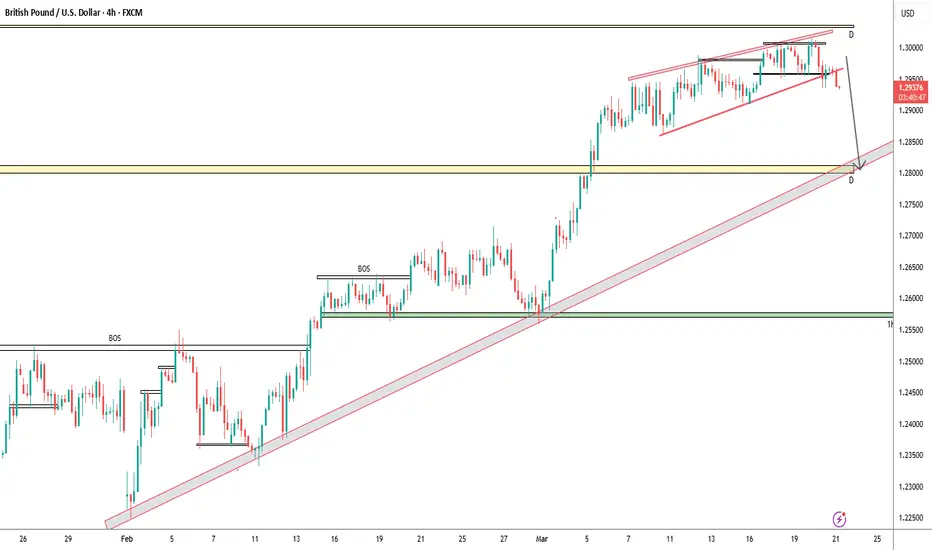
The broader trend remains bullish, following a steady rally from the 1.2300 area back in February. The pair has been forming higher highs and higher lows, indicating strong underlying demand.
However, we’re now seeing signs of bullish exhaustion as the price struggles near the 1.2850 – 1.2900 resistance zone — an area that previously acted as a strong supply level.
🧱 Key Resistance Levels:
1.2850 – 1.2900: Major resistance zone; a daily close above this level would likely accelerate bullish momentum.
1.3000: Psychological round number and the next natural target.
1.3140: Historical swing high from mid-2023, could serve as the next upside objective.
🛡️ Key Support Levels:
1.2680: Previous higher low and potential first line of defense.
1.2520: Strong structural support — a break below this zone may shift the medium-term outlook to neutral or even bearish.
1.2300: February’s key low and the base of the current trend.
📐 Technical Structures:
Price appears to be forming an ascending triangle — a classic bullish continuation pattern — with flat resistance at 1.2850 and rising higher lows from below. This supports the idea of an impending breakout if bulls regain control.
Additionally, the pair is moving within a rising price channel, offering clean structure for both trend-following and breakout traders.
🧭 Potential Scenarios:
✅ Bullish Breakout:
A confirmed close above 1.2900 would likely open the door toward 1.3000, followed by 1.3140. This scenario aligns with the current market structure, assuming continued weakness in the USD or sustained risk appetite.
❌ Bearish Rejection:
Failure to break the resistance zone, especially with bearish reversal candles, could trigger a drop toward 1.2680, and possibly 1.2520. A daily close below 1.2520 would be a strong technical warning for bulls.
📌 Conclusion:
GBP/USD is sitting at a technically significant level. The prevailing trend favors the bulls, but the outcome at 1.2850–1.2900 will be decisive. Watch price action closely for confirmation — breakout or rejection, the next move could be sharp.
💬 What’s your take on this setup? Do you see a breakout or a reversal ahead? Drop your thoughts in the comments 👇
Gbpusd_forecast

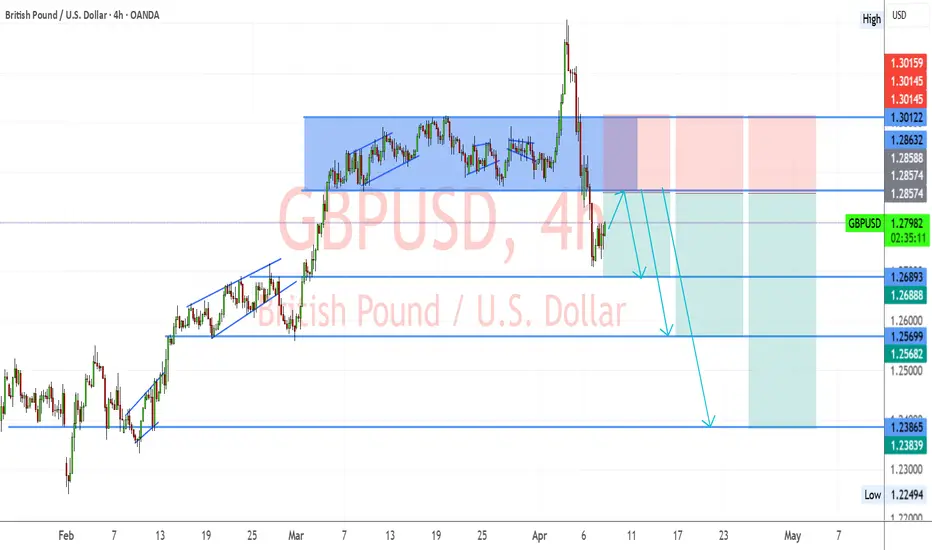
GBPUSD Watch – Bearish Momentum Building Below Supply ZoneGBPUSD pair has broken sharply below the long-standing accumulation range between 1.2857 – 1.3012, signaling a shift in market sentiment. The recent bearish engulfing structure has pushed price into a corrective pullback phase, with sellers likely to re-enter on rallies.
Key Technical Levels:
Current Price: 1.2795
Resistance (Supply Zone): 1.2857 – 1.2863
First Support Target: 1.2688 – 1.2690
Mid-Level Target: 1.2568 – 1.2570
Final Bearish Target: 1.2383 – 1.2390 (demand zone & key support)
Trade Scenario:
📉 Bearish Bias:
Price is expected to retrace into the supply zone (1.2857–1.2863) and then reject.
If resistance holds and structure remains intact, expect continuation toward:
TP1: 1.2689
TP2: 1.2568
TP3: 1.2385
🔁 Invalidation Zone:
A sustained break and close above 1.2863 would invalidate the bearish setup and could trigger a move toward 1.3012.
Technical Confluence:
✅ Previous consolidation turned into a strong resistance zone
✅ Bearish breakout from range
✅ Clean lower highs and lower lows structure
✅ Volume drop on the pullback (likely a corrective move)
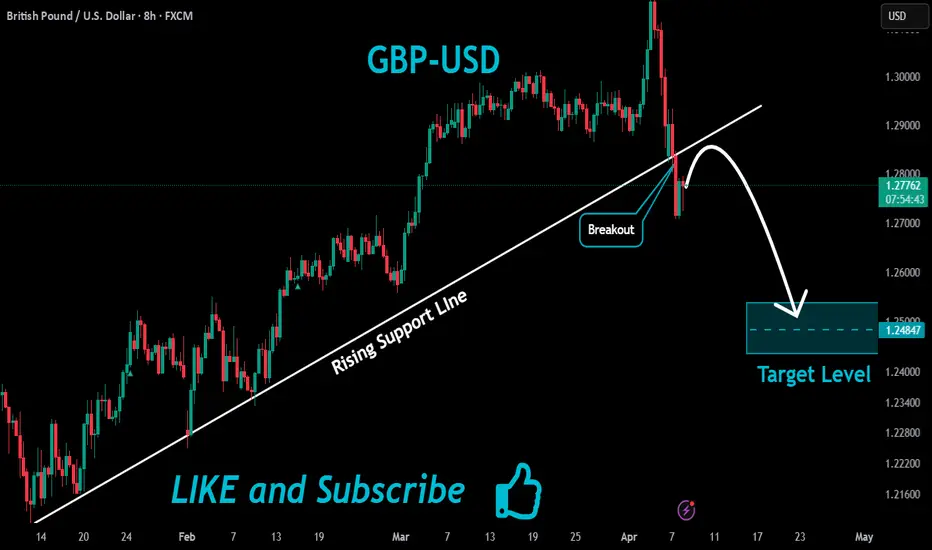
GBPUSD Bearish Breakout !
HI,Traders !
GBPUSD broke the rising
Support line and the breakout
Is confirmed so we are
Bearish biased and we
Will be expecting a
Further move down !
Comment and subscribe to help us grow !
GBPUSD: A 1300+| Pips Swing Move One Not To Miss! USD has dominated the market which ultimately taking price of some of the pair to record low and at discounted zone. Although, we should wait for price to breakthrough the inducement line and then enter with accurate risk management.
Team Setupsfx_
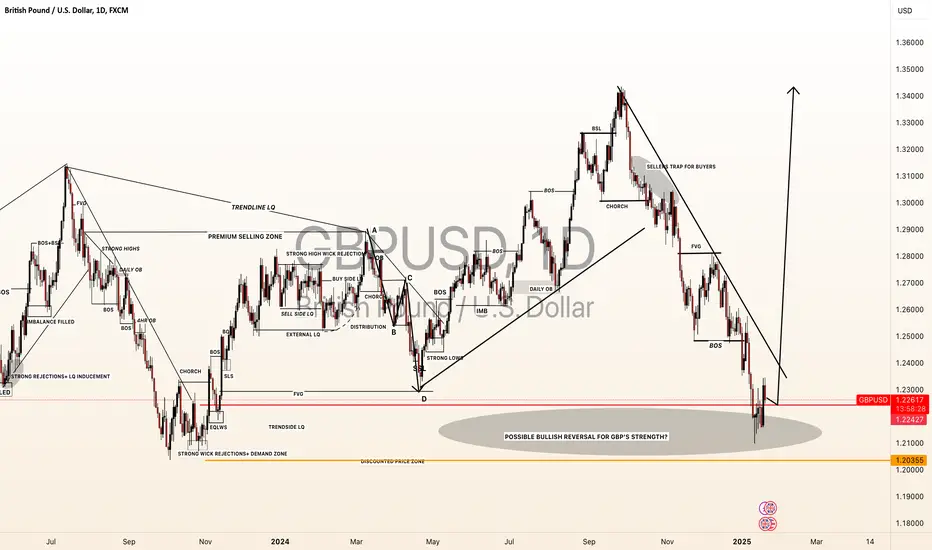
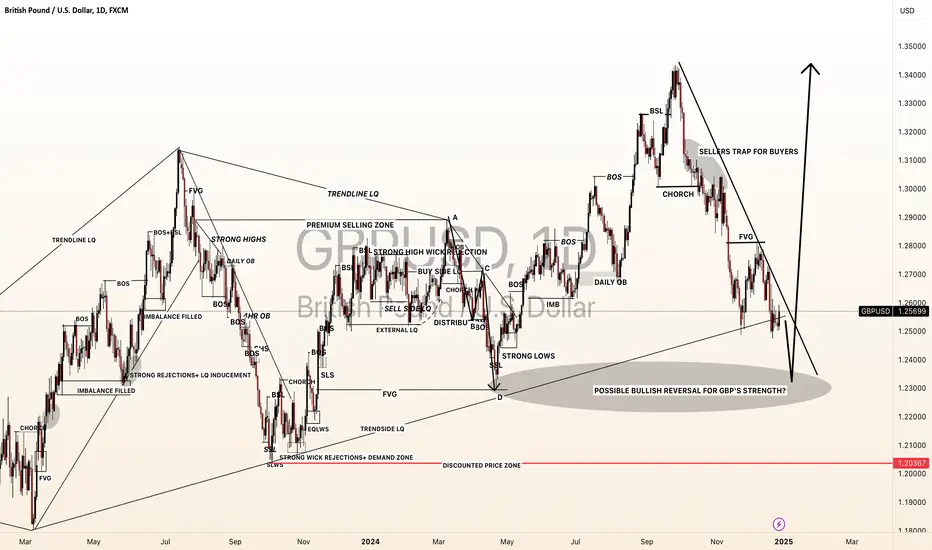
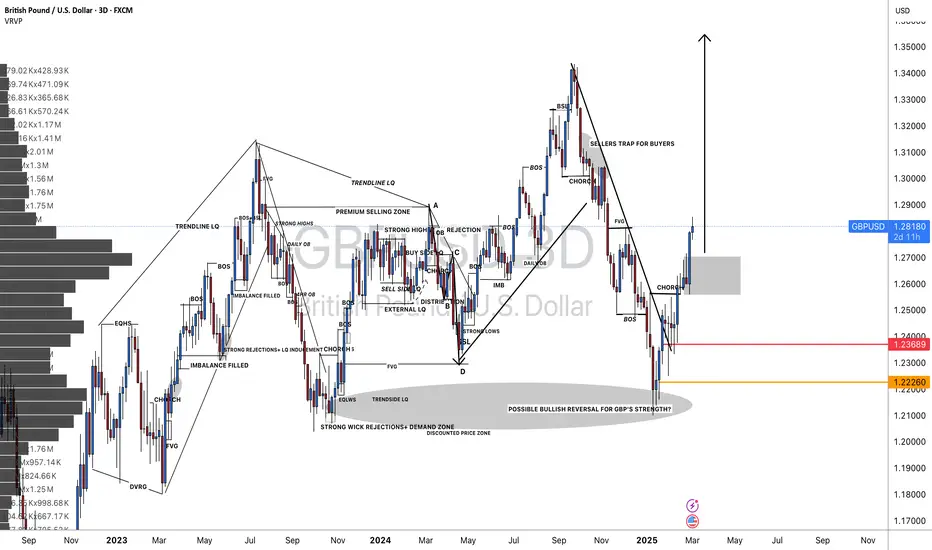
Will GBPUSD reverse in 2025?Dear Traders,
Hope you are enjoying the holidays, we are getting ready for the new year and in meantime we have identified a key level emerging on GU that will possible shape the price next couple of months. Looking at the detailed of how price behaved in these last two months. We can expect USD exhaustion. Good luck.
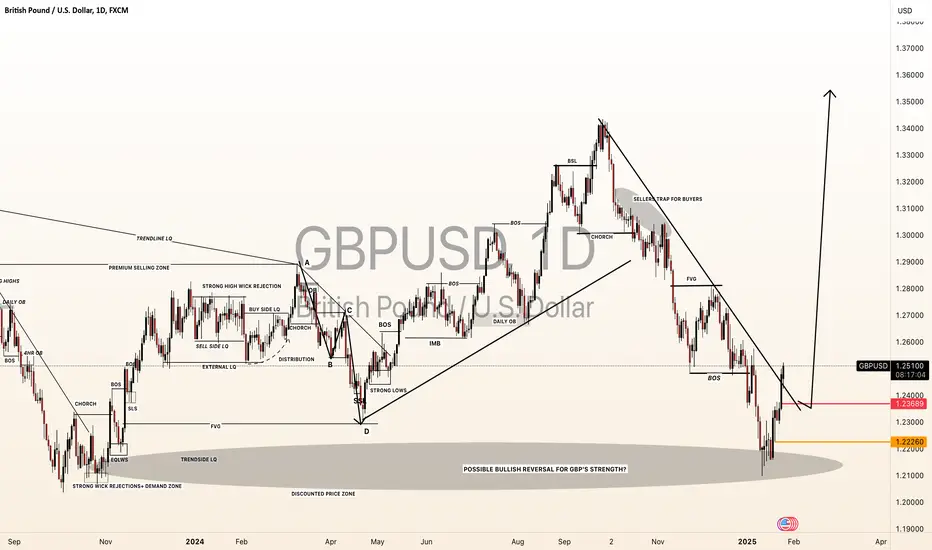
GBPUSD: 700+ Pips Swing Buy! Get ready for big moveDear Traders,
GBPUSD our first few ideas are up and running in profit of 700+ pips, we are expecting bullish move to continue dominating the market. Now we think price is likely to remain bullish for next few weeks, while wee may also notice some correction in the market.
Want to support us?
-Please like and comment our ideas which will encourage us to post more educative posts like this. ;)
Thank you
GBPUSD: 2000+ Pips Buying Opportunity! Dear Traders,
Hope you are doing great, we have an excellent buying opportunity on GU which worth up to 2000 pips. Please wait for price to make correction and enter accordingly. Use accurate risk management.
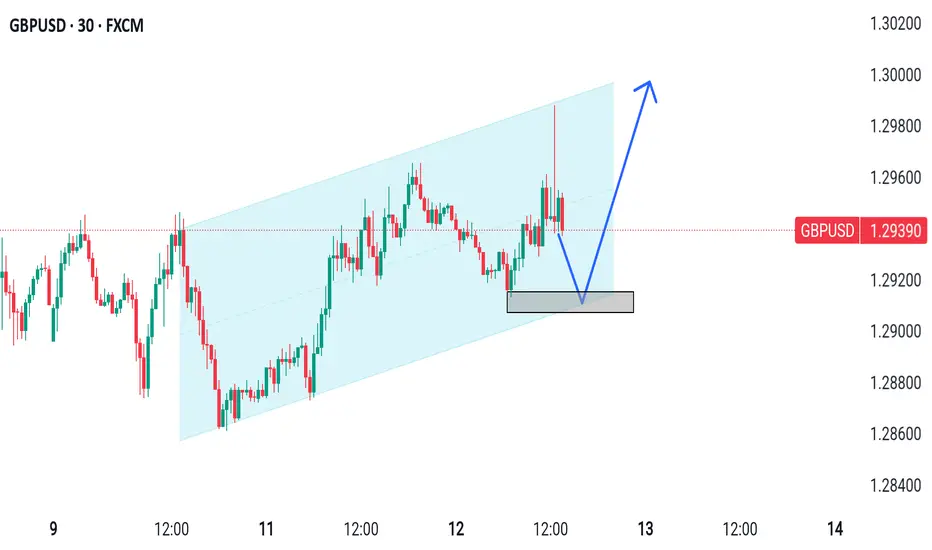
GBP/USD Technical & Fundamental AnalysisThis chart presents a long (buy) trade setup on GBP/USD (British Pound to US Dollar) 30-minute timeframe.
Technical Analysis
1. Entry & Stop Loss (SL) 🛑
Entry Zone: 1.29050 - 1.29100 (Purple Support Area)
Stop Loss: Below 1.28850 (Red Box)
2. Target Zones 🎯
Target 1: 1.29300 – Minor resistance, suitable for first take-profit (TP1).
Target 2: 1.29500 – Stronger resistance level.
Target 3: 1.29700 – Major resistance area, final take-profit (TP3).
3. Market Structure & Price Action 📈
The price reacted to the entry zone, a support level.
A retest of previous demand zones before potential bullish continuation.
Risk-to-Reward Ratio (RRR): Favorable, as upside potential is greater than downside risk.
Bullish Confirmation: If price holds above the 1.29050 zone, an upward move is likely.
Recent Fundamental Factors Affecting GBP/USD
1. UK Economic Data 🇬🇧
UK GDP Growth: Slower growth than expected, but still in positive territory.
Bank of England (BoE) Policy: No immediate rate cuts, keeping GBP stable.
UK Inflation: Still above target, supporting a stronger GBP.
2. US Economic Data 🇺🇸
Federal Reserve (Fed) Policy:
Mixed signals from the Fed—some officials hint at rate cuts later this year.
If the Fed pauses or cuts rates, GBP/USD could rise.
US Non-Farm Payrolls (NFP) Data:
Expected to show job market resilience. A strong NFP could push USD higher, pressuring GBP/USD.
US GDP Data:
Slower-than-expected growth could weaken USD, helping GBP.
3. Market Sentiment 🌍
Risk-On vs. Risk-Off:
If investors shift to risk-on sentiment (buying stocks, GBP), GBP/USD could move higher.
If risk-off sentiment dominates (buying USD as a safe haven), GBP/USD may struggle.
Conclusion & Trading Plan
✅ Buy near 1.29050 - 1.29100 with SL below 1.28850.
✅ Take Profits: TP1 (1.29300), TP2 (1.29500), TP3 (1.29700).
✅ Monitor: US economic data, Fed rate expectations, and risk sentiment.

GBPUSD Weekly FOREX Forecast: Wait for BUYS!In this video, we will analyze GBPUSD and GBP Futures for the week of March 31 - April 4th. We'll determine the bias for the upcoming week, and look for the best potential setups.
The GBP has been a bit stronger than its counterparts, and currently in consolidation. I am waiting for a high probability setup, which would entail as sweep of SSL and a tap of the Weekly +FVG before moving higher.
Enjoy!
May profits be upon you.
Leave any questions or comments in the comment section.
I appreciate any feedback from my viewers!
Like and/or subscribe if you want more accurate analysis.
Thank you so much!
Disclaimer:
I do not provide personal investment advice and I am not a qualified licensed investment advisor.
All information found here, including any ideas, opinions, views, predictions, forecasts, commentaries, suggestions, expressed or implied herein, are for informational, entertainment or educational purposes only and should not be construed as personal investment advice. While the information provided is believed to be accurate, it may include errors or inaccuracies.
I will not and cannot be held liable for any actions you take as a result of anything you read here.
Conduct your own due diligence, or consult a licensed financial advisor or broker before making any and all investment decisions. Any investments, trades, speculations, or decisions made on the basis of any information found on this channel, expressed or implied herein, are committed at your own risk, financial or otherwise.

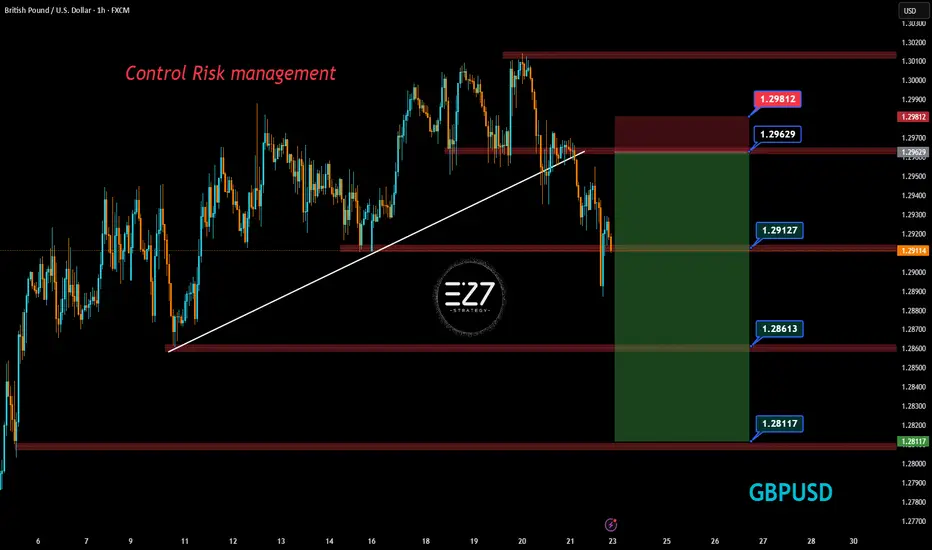
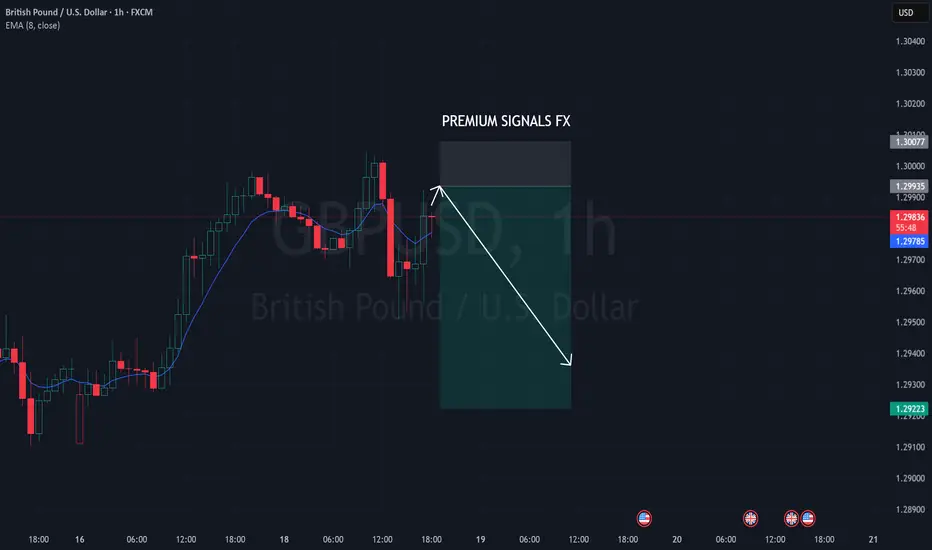
GBPUSD GBPUSD Analysis & Signal (1H Timeframe)
📅 Date: March 23, 2025
On the GBP/USD chart, the price has reached a key resistance zone around 1.29629 after an uptrend, showing signs of rejection. This resistance aligns with a descending trendline, adding to the selling pressure.
Currently, the price is heading toward the demand zone marked between 1.28613 and 1.28117, which could act as a strong support level.
Signal:
Sell:
📍Entry Point: 1.29114 (current price)
🔴Stop Loss: 1.29629 (above resistance)
🟢Take Profit 1: 1.28613
🟢Take Profit 2: 1.28117
⚠️Risk Management:
With the stop loss set above the resistance, the risk-to-reward ratio (R:R) for this trade is at least 1:2. It’s recommended to risk only 1-2% of your capital on this trade.
📝Note: Before entering the trade, wait for additional confirmations (e.g., reversal candlestick patterns or a break of the zone) and assess market conditions.
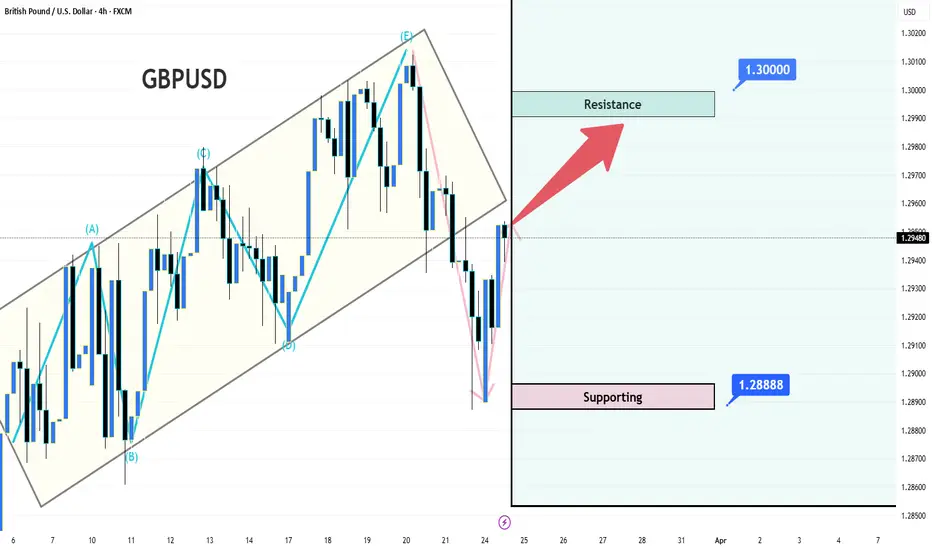
GBPUSD Be bullishIf GBPUSD can effectively break through the resistance level of 1.30000, it is likely to attract more bulls to enter the market, driving the exchange rate to rise further.
The potential resistance levels above might be around 1.31400, 1.32100, etc. On the contrary, if it encounters resistance and drops back near 1.30000, the support levels below are at around 1.28888 and 1.27000.
💎💎💎 GBPUSD 💎💎💎
🎁 Buy@1.28000 - 1.28500
🎁 TP 1.30000 - 1.31400
The market has been extremely volatile lately. If you can't figure out the market's direction, you'll only be a cash dispenser for others. If you also want to succeed,Follow the link below to get my daily strategy updates
Trade Idea: GBP/USD Long SetupPair: GBP/USD
Timeframe: 4-Hour (4H)
Trade Type: Long
Entry: 1.2900 - 1.2950
Stop Loss: 1.2850 (below previous structure low)
Technical Analysis:
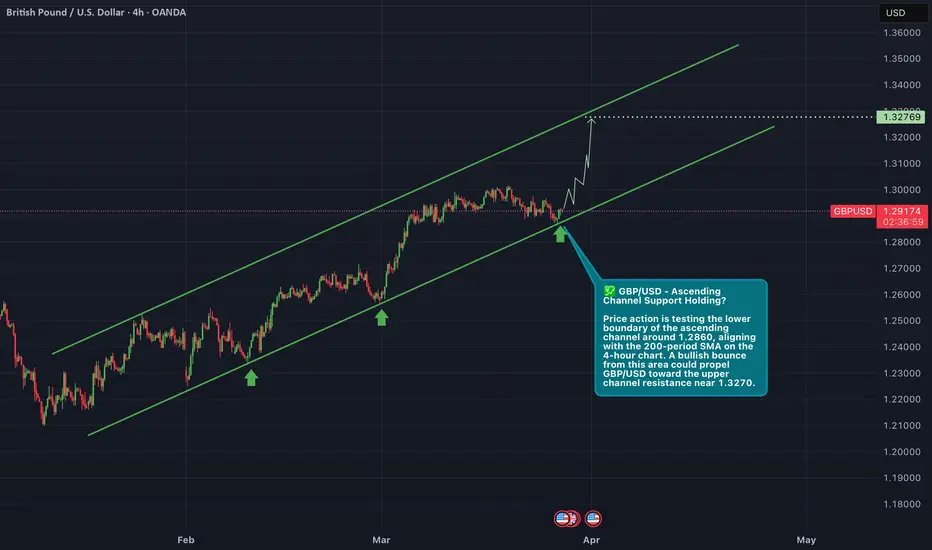
GBP/USD has been trending within a well-defined ascending channel, characterized by higher highs and higher lows. The recent price action saw a pullback toward the lower boundary of this channel, around the 1.2860 region, which coincides with the 200-period Simple Moving Average (SMA) on the 4-hour chart, providing a confluence of support. A bullish candlestick pattern or a bounce from this support zone could signal a potential continuation of the uptrend toward the upper channel resistance near 1.3270. 
Fundamental Analysis:
Recent economic developments support a bullish outlook for GBP/USD:
• UK Inflation Data: The UK’s Consumer Price Index (CPI) rose by 2.8% in February, down from 3% in January and below the expected 2.9%. This easing inflation may influence the Bank of England’s monetary policy decisions, potentially leading to a more accommodative stance, which can be supportive of the GBP. 
• US Economic Factors: The US is set to impose new tariffs starting in April, which could impact market sentiment and influence USD strength. Additionally, upcoming US PMI data may provide further insights into economic conditions that could affect USD performance.
GBP/USD Potential Bear Momentum...I couldn't resist the GBP/USD bear opportunity here displaying a broadening pattern.
I'm already in established shorts on the EUR/USD at 1.0891 but decided to jump in on GBP/USD at 1.2916 considering the price movements can be more pronounced.
Right now, my cap on whether this trade works or not is 1.3000. if we, for whatever reason, pop back up to 1.3000, I'd close this trade but for now, I think this trade looks good and will target 1.2750 however, using chart pattern percentages, I wouldn't be surprised to see 1.2600.
We'll see how this one looks going forward, especially with trump announcing more tariffs later today.
As always, Good Luck & Trade Safe.
GBP/USD Trade idea
GBP/USD is currently around 1.29165.
A recent bearish move has been observed.
There is a Fair Value Gap (FVG) on the H4 timeframe just above the current price.
Expected Price Action (Blue Path):
Price might first move upwards to fill the H4 Fair Value Gap, potentially reaching the 1.29801 level (previous high area).
This area could act as a liquidity grab or inducement zone.
Main Expectation (Red Path):
After hitting the FVG area and liquidity zone, the price is expected to reverse downward.
The target for this move is 1.28121, where there is another key demand area / Weekly Fair Value Gap (W-FVG).
Key Levels:
FVG (H4) – Target for potential upward move.
1.29801 – Liquidity / potential reversal zone.
1.28121 – Main downside target after rejection.

GBPUSD SELLJust a quick trade—I'll update afterward. Follow for simple and effective trades faster!
1RR
GBPUSD Selling Opportunities SpottedWe are basically anticipating for more selling momentum as price formed a wedge at a resistance level. Also, lower timeframe price action shows more bearish activities.
GBPUSD Trade IdeaGBPUSD is showing bullish momentum. In this video, we explore a trade idea that involves a retracement to the 50% equilibrium level of the previous price swing. This is not financial advice.

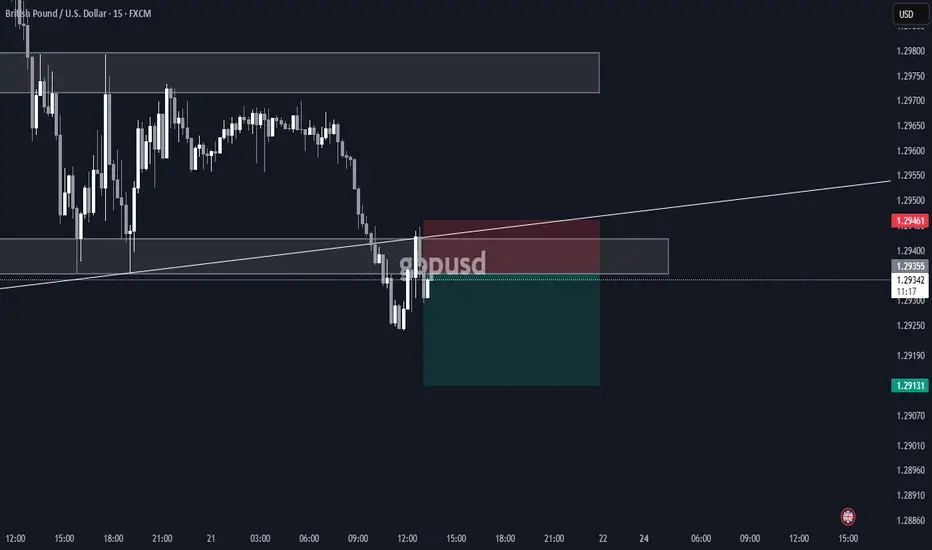
GBP/USD Market Analysis: Potential Short Setup at ResistanceThe GBP/USD pair is trading near the **1.3000** psychological level, showing signs of consolidation after a strong bullish move. The chart suggests a potential reversal as price approaches a key resistance zone, with an apparent liquidity grab at the recent high.
The highlighted area around **1.2946 - 1.2921** represents a significant **H4 demand zone**, where price could retrace before continuing its next move. A break below this zone would indicate a deeper correction, with potential downside targets towards **1.2870** (OA level).
**Key Considerations:**
- A sustained break above **1.3000** could invalidate the bearish setup, leading to further upside momentum.
- A rejection at this level, combined with bearish price action, could confirm a short opportunity with a target towards the demand zone and lower support areas.
**Conclusion:** Traders should monitor price action around the resistance level and confirmation of a bearish reversal before committing to short positions. If bullish momentum persists, a breakout could open the door for further gains.

GBP/USD: Bullish Channel Meets Overbought Zone in RSISince March 3, an unprecedented bullish movement has emerged on the GBP/USD daily chart, with the pair accumulating a gain of over 3% during this period. The bullish pressure continues to be driven by uncertainty surrounding the trade war, which has gradually weakened the U.S. dollar, prompting investors to seek refuge in European currencies.
Today, the market is showing a strong neutral candle, partly due to the expectation surrounding the Federal Reserve’s interest rate decision, which will be announced tomorrow, along with the Bank of England’s decision on Thursday. Until the outcomes of both central bank meetings are known, the neutral bias is likely to dominate short-term movements in GBP/USD.
Bullish Channel
Since mid-January, a consistent bullish pressure has developed in the pair, forming a short-term ascending channel. Currently, price movements are testing the upper boundary of this channel. If buying pressure remains strong, the bullish trend could accelerate in the coming sessions, leading to a steeper channel in the short term.
RSI (Relative Strength Index)
However, the RSI presents a different scenario. The upper boundary of the bullish channel coincides with the overbought zone, as the RSI oscillates near 70 . Additionally, higher highs in price and lower highs in the RSI indicate a persistent divergence. These two signals suggest that buying momentum may be slowing down, potentially leading to short-term bearish corrections.
MACD (Moving Average Convergence Divergence)
The MACD is showing a similar trend to the RSI. The signal line and MACD line are at levels not seen since August 2024, and a potential crossover could occur in the coming sessions. This indicates that the recent bullish momentum in moving averages is gradually fading, which could create room for selling corrections in the upcoming sessions.
Key Levels to Watch:
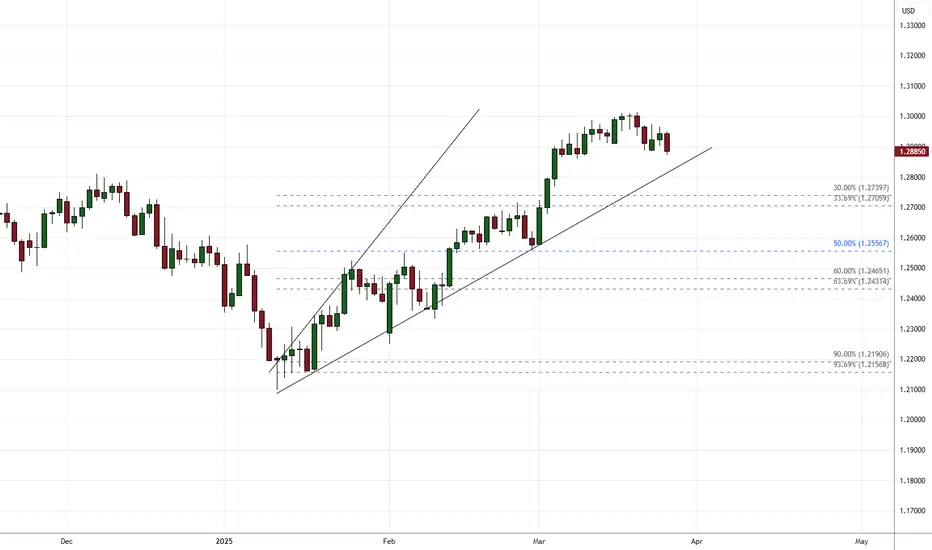
1.29721 – Current Resistance: This significant resistance level sits at the upper boundary of the bullish channel and coincides with the 61.8% Fibonacci retracement level. Sustained breakouts above this level could accelerate buying pressure, leading to a stronger bullish move.
1.27700 – Near-Term Support: This support zone aligns with the 50% Fibonacci retracement level and could serve as a potential area for short-term bearish corrections.
1.26183 – Distant Support: This critical support aligns with the 50- and 100-period moving averages and the lower boundary of the larger bullish channel. A break below this level could jeopardize the current bullish formation, potentially triggering a stronger bearish move.
By Julian Pineda, CFA – Market Analyst

GBPUSD SELL RSI oveerboughtGBPUSD Sell until 8 EMA on daily timeframe, moreover, the RSI is overbought.
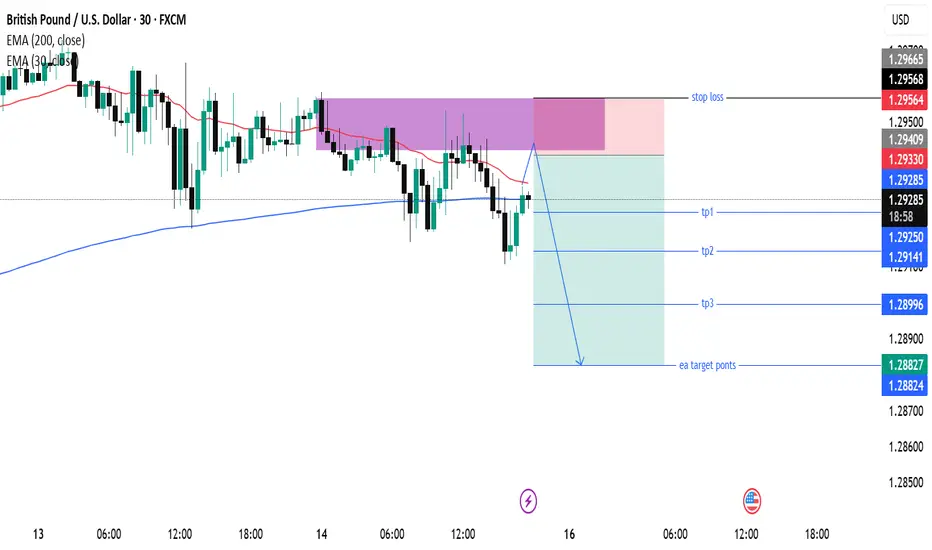
GBP/USD 30-Minute Bearish Trade Setup & Analysis200 EMA (Blue) at 1.29285 – Represents long-term trend support/resistance.
30 EMA (Red) at 1.29329 – Represents short-term trend direction.
Trade Setup:
Entry: The trade seems to enter near the 30 EMA after price rejects a resistance zone (highlighted in purple).
Stop Loss: Placed above the resistance zone at around 1.29564 - 1.29568.
Take Profit Levels:
TP1: ~1.29250
TP2: ~1.28996
TP3: Final target at ~1.28827
Market Analysis:
The price has rejected the 30 EMA, signaling potential bearish movement.
The downtrend projection suggests a possible break below 1.29250, aiming for the lower support levels.
The risk-to-reward ratio appears favorable, with a tight stop loss and multiple profit-taking points.
Possible Scenarios:
Bearish Case (High Probability): If price stays below the 30 EMA, it may continue down towards the target points.
Bullish Case (Low Probability): If price breaks above the resistance zone, it could invalidate the short setup, triggering the stop loss.
Would you like a deeper analysis or confirmation with another indicator?
#GBPUSD 4HGBPUSD (4H Timeframe) Analysis
Market Structure:
The price is currently trading near a key resistance area, where previous selling pressure has been observed. This level has historically acted as a barrier, rejecting upward movements and leading to price declines.
Forecast:
A sell opportunity is anticipated from the resistance area if the price shows signs of rejection, such as bearish candlestick patterns or a decrease in buying momentum.
Key Levels to Watch:
- Entry Zone: Consider entering a sell position if the price fails to break above the resistance and confirms rejection.
- Risk Management:
- Stop Loss: Placed above the resistance area or recent swing high to manage risk.
- Take Profit: Target nearby support levels for potential downside movement.
Market Sentiment:
The resistance area is a critical zone to monitor for potential price reversal. Confirmation through bearish signals is recommended before executing a trade.

GBPUSD Looks Parallel Channel Hello Guys Here Is Chart Of GBPUSD in 30-M AT
Support: Around 1.2900
Target Will Be : 1.3000
Resistance: The upper trendline of the Trend CHENNEL around 1.3000
This analysis assumes the price respects the trend channel. A breakdown below support could invalidate the setup.