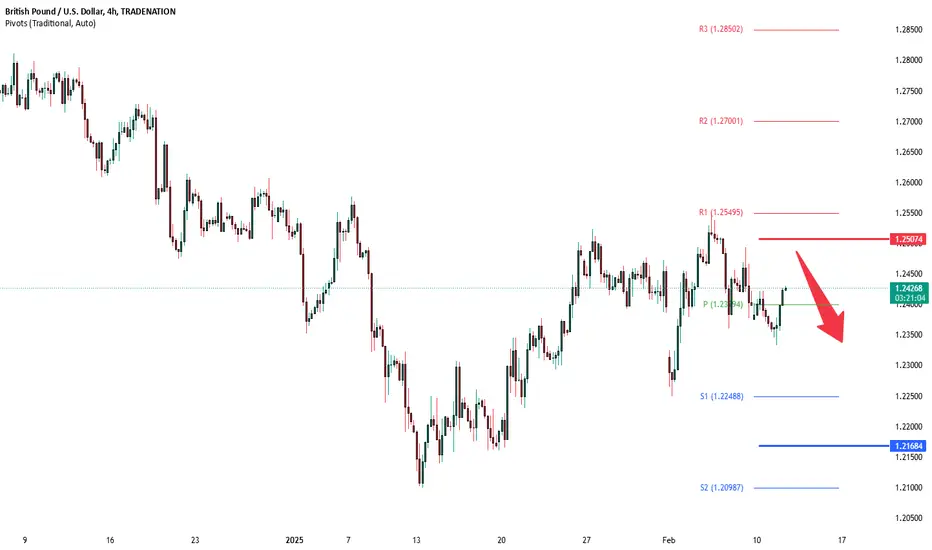
GBPUSD oversold bouncebacks capped by 1.2500 levelThe GBPUSD currency pair price action sentiment appears bearish, supported by the longer-term prevailing downtrend.
The key trading level is at 1.2500, which is the 25th February swing high. An oversold rally from the current levels and a bearish rejection from the 1.2500 level could target the downside support at 1.2250 followed by 1.2170 and 1.2100 levels over the longer timeframe.
Alternatively, a confirmed breakout above the 1.2500 resistance and a daily close above that level could trigger further rallies higher and a retest of the 1.2550 resistance level followed by 1.2600 and 1.2700.
This communication is for informational purposes only and should not be viewed as any form of recommendation as to a particular course of action or as investment advice. It is not intended as an offer or solicitation for the purchase or sale of any financial instrument or as an official confirmation of any transaction. Opinions, estimates and assumptions expressed herein are made as of the date of this communication and are subject to change without notice. This communication has been prepared based upon information, including market prices, data and other information, believed to be reliable; however, Trade Nation does not warrant its completeness or accuracy. All market prices and market data contained in or attached to this communication are indicative and subject to change without notice.
Gbpusd_forecast
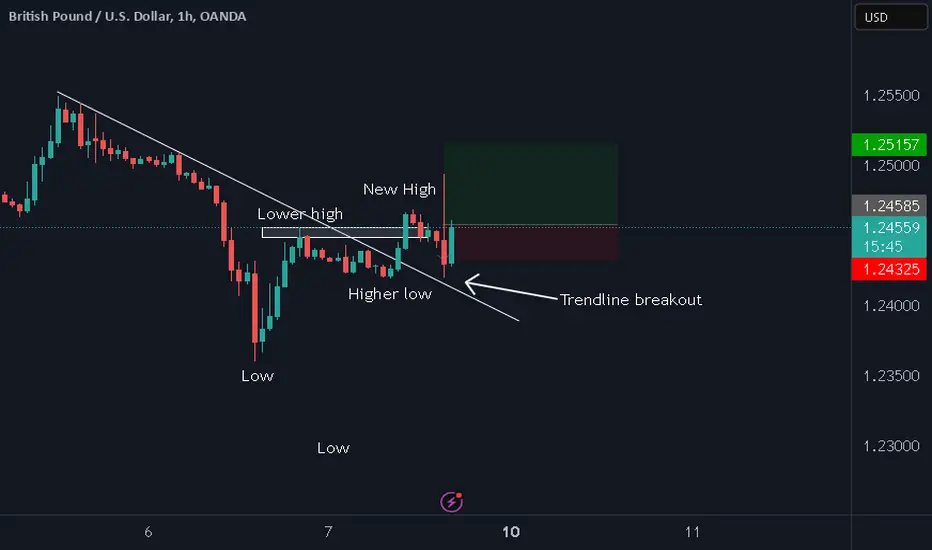
GBPUSD LONG: NFP MISSUS January non-farm payrolls +143K vs +170K expected. As a result, we expect the dollar to show some weakness going into the end-of-the-week trading. We are looking for GBPUSD longs as we can see based on the our, the technicals are in support of the fundamentals.
GBPUSD A Clear Sell To Buy Set UPFirst I want to thank you all for the love you have showed. Much appreciated.
Second, I sound groggy in this video..... just exhausted but hey, I have to do this for you guys.
Anyway, this is a follow up on the last video that I did (attached here) where I mentioned that since we have already gotten a bullish break of internal structure (signaling an internal trend change) we should expect a pullback.
At the time i was recording this, price is approaching a demand zone where we should expect to see a bullish reaction to take us back to where we are looking to get involved with the sells.
If you are comfortable buying from the zone, you should (I will just wait for the reaction off that demand zone into my supply zone to sell).
Caution to the people looking to sell.
If price makes a deeper pullback, (blasting through the demand zone), cancel your sell orders and start looking for buy opportunities.
If the decisional demand zone get's blasted, let's wait for the extreme to hold.

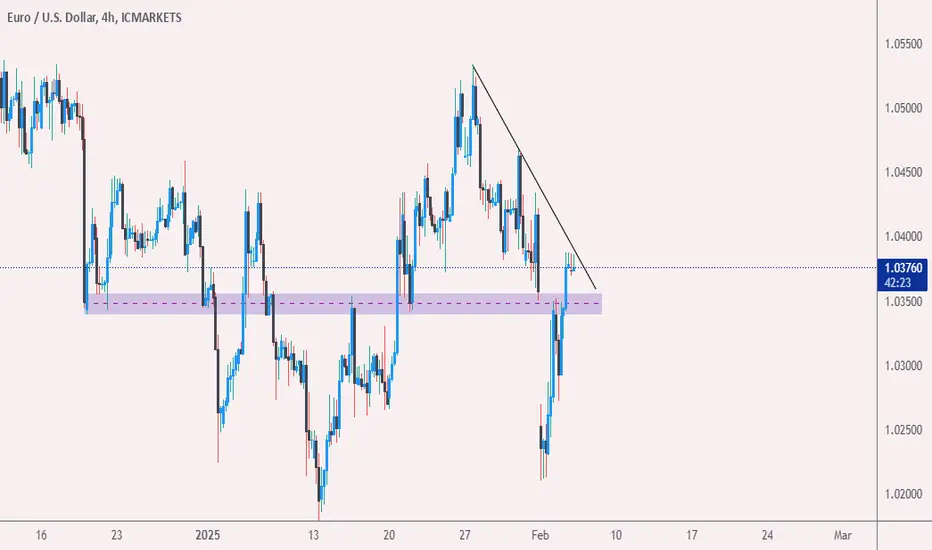
Eur/Usd Sup/ResEur/Usd Break Res...I think it's clear enough in chart...so let's see
will share trade entry later
( any 4H close below 1.03360 means sup not working.. )
Market Analysis: Bullish Harmonic Bat Pattern on GBP/USDOverview of the Setup :
This chart highlights a **Bullish Harmonic Bat Pattern** on the GBP/USD pair, with the potential for a reversal to the upside after completing the pattern near the critical support zone.
---
** Key Observations:
1. Harmonic Pattern :
- The **Bullish Bat Pattern** completes at point X (around 1.22628), which aligns with the 0.886 Fibonacci retracement level of the XA leg. This level represents a strong confluence of support and potential reversal.
- The reaction at this zone suggests that buyers may be stepping in.
2. Price Action :
- The recent downtrend has reached exhaustion at point X, with the price consolidating and showing signs of a potential reversal.
- The price has formed a **lower wick**, indicating rejection of lower levels and possible bullish momentum building.
3. Fibonacci and Take-Profit Targets :
- **Take-Profit Levels (TP):**
- **T1:** 1.23541 (50% retracement of the XA leg).
- **T2:** 1.24187 (0.618 retracement of the XA leg).
- The harmonic structure suggests these levels as the most probable targets for a bullish reversal.
4. Indicators :
- **Stochastic Oscillator:** In the oversold territory, signaling the likelihood of upward price movement as selling pressure weakens.
- **RSI:** Approaching oversold levels, further supporting the bullish reversal hypothesis.
5. Key Levels :
- **Support Zone:** Point X near 1.2260 is the critical level for the pattern’s validity.
- **Resistance Zones:** MHQP at 1.2500 is a longer-term resistance, while intermediate resistance levels are 1.2350 and 1.2418.
---
Outlook and Strategy :
- **Bullish Bias:** The completion of the Bullish Bat Pattern and confluence of support suggest an opportunity for long positions targeting the Fibonacci take-profit levels (T1 and T2).
- **Entry Zone:** Enter long positions near 1.2260 if price action shows sustained bullish rejection.
- **Stop-Loss:** Place stops below 1.2220 to account for false breakouts.
- **Targets:**
- **T1:** 1.2350
- **T2:** 1.2418
Risk Factors :
- A sustained break below 1.2260 would invalidate the pattern and could lead to continued bearish momentum toward 1.2200.
---
This analysis highlights a bullish opportunity driven by the completion of the harmonic pattern, with clearly defined entry, exit, and risk parameters.

GBP/USD Symmetrical Triangle Setup: Bullish Breakout?Here's an analysis based on the chart:
Key Observations :
1. **Bullish Triangle Pattern:**
- A symmetrical triangle or wedge is forming, suggesting potential consolidation before a breakout.
- The upward trendline indicates possible bullish momentum as price approaches a breakout point.
2. **Price Levels:**
- Resistance: 1.24860 (shown as the 1.13 Fibonacci extension level).
- Support: Around 1.24100, where price is currently hovering near the trendline.
3. **RSI (Relative Strength Index):**
- The RSI is above 50, which leans toward bullish momentum.
- Divergence may be forming as price action creates higher lows while RSI doesn't show the same strength.
4. **Candlestick Patterns:**
- Multiple rejections around support suggest buying pressure near the trendline.
Trading Implications:
1. **Bullish Breakout Setup:**
- If price breaks above 1.24860, it could signify a continuation to higher levels, potentially targeting a Fibonacci extension level beyond 1.25.
2. **Reversal or Bearish Setup:**
- If price fails to hold the ascending trendline, expect a move downward, potentially testing 1.23900 or lower.

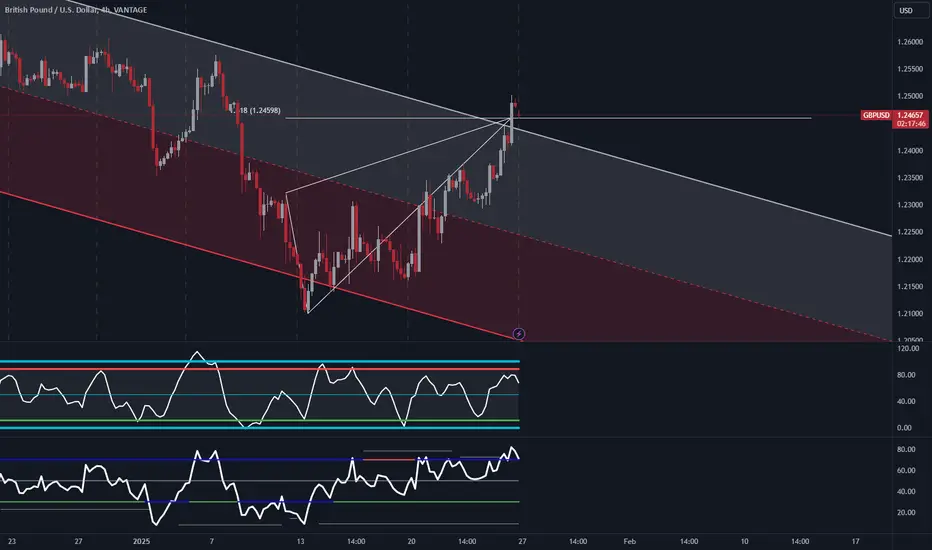
Time to turn around? GBPUSD"That's GBP, the price go up if it's USD" = Central Cee, 21 Savage
Looks like these two rappers may be onto something here, reaching the 1.618 resistance, we may see the dollar rise against the pound again causing GBP to continue falling.
GBPUSD has currently pierced it's way out of the trend channel, let's see how this plays out.
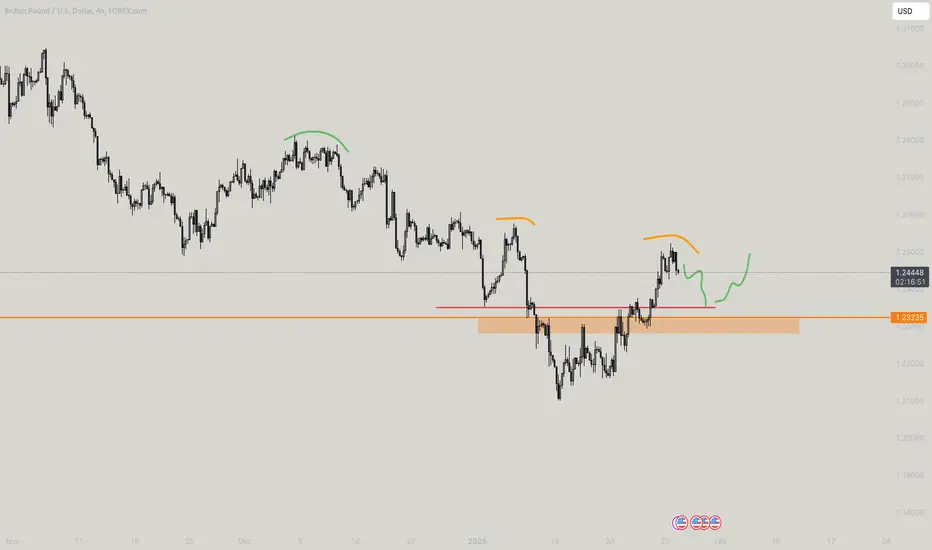
GBPUSD - My Style!This is quite interesting for you to understand!!
Look at the green doodle, it shows where it would move
Red line shows till which time it would fall, expecting a short up move after the fall because theres a steep orderblock where people like to move things up,
The prior orange round half circle marked are 200SMA high lines.
Orange box is also where you can plan buys to wait like a shark to eat a puffer fish!!
GBPUSDHello Traders! What are your thoughts on GBPUSD?
My GBPUSD Technical Analysis Breakdown
Current Market Context
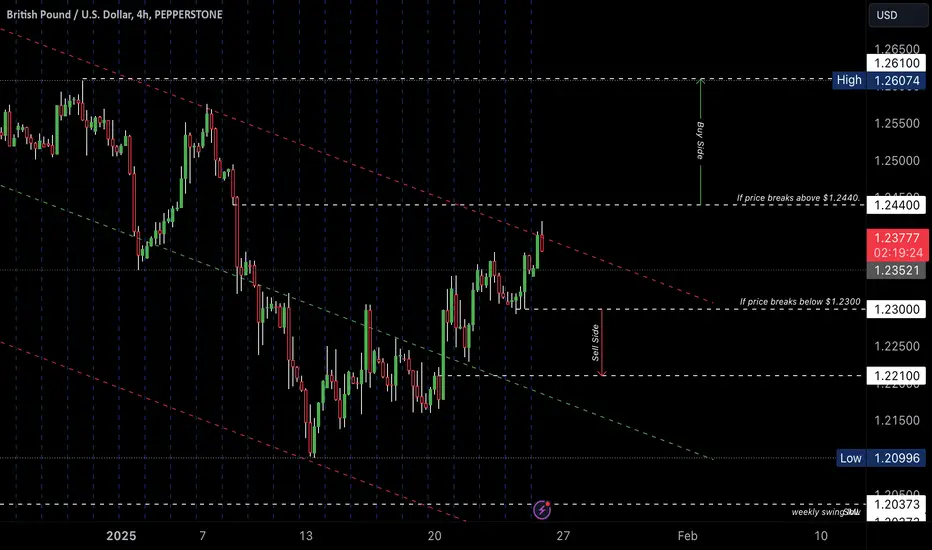
The British Pound versus US Dollar (GBPUSD) has shown resilience by bouncing from the critical $1.2300 support level. This price action suggests buyers are defending this level, though we remain within a larger bearish channel.
Technical Setup
- Strong support established at $1.2300
- Key resistance level: $1.2440 (bearish channel resistance)
- Current price action: Upward momentum from support
- Market structure: Inside bearish channel
Trade Scenarios
1. Bullish Scenario
- Entry Trigger: Clear break and close above $1.2440
- Profit Target: $1.2610
- Stop Loss: Below $1.2300
- Risk/Reward ratio: Approximately 1:2
2. Bearish Scenario
- Entry Trigger: Break below $1.2300
- Profit Target: $1.2210
- Stop Loss: Above $1.2340
- Risk/Reward ratio: Approximately 1:2.2
Today's Trading Plan
- Trading Range: $1.2300 - $1.2475
- Recommendation: Wait for clear breakout confirmation
- Risk Management: Keep position sizes moderate given current market uncertainty
- Key Action Points: Watch for strong price action and volume at key levels before entering
Remember: Enter trades only when your chosen scenario shows clear confirmation signals. This reduces the risk of getting caught in false breakouts.
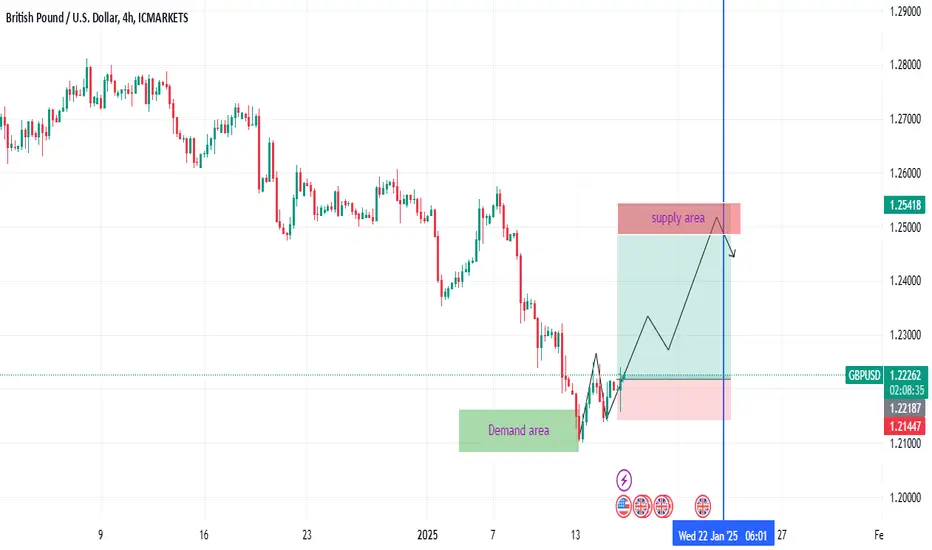
GBPUSD Approaches Major Zone: Monitoring Dollar for Next MoveAt the moment, we are observing the GBPUSD pair with no clear bias, simply monitoring the price action as it approaches a key zone. From a monthly perspective, we can see that the price has been in a bullish trend for several consecutive months. However, it is now reaching an important level where a potential pullback could occur.
The plan is to start monitoring the 4-hour and daily charts, looking for a clear signal that confirms the price's intention to retrace from this area. We are not rushing to take a directional stance until the market provides a more decisive signal.
One key factor to watch is the current behavior of the dollar . It is sitting at a strong support zone, which could be affected by upcoming economic data. If this support breaks, we could see strength in GBPUSD , driven by the dollar's weakness.
It is crucial to keep an eye on the signals coming from the dollar and the forthcoming economic data, as these could trigger significant volatility and help define the next move in GBPUSD. Given the current state of the dollar, the likelihood of a correction or move in GBPUSD is high, but we need confirmation through price action.

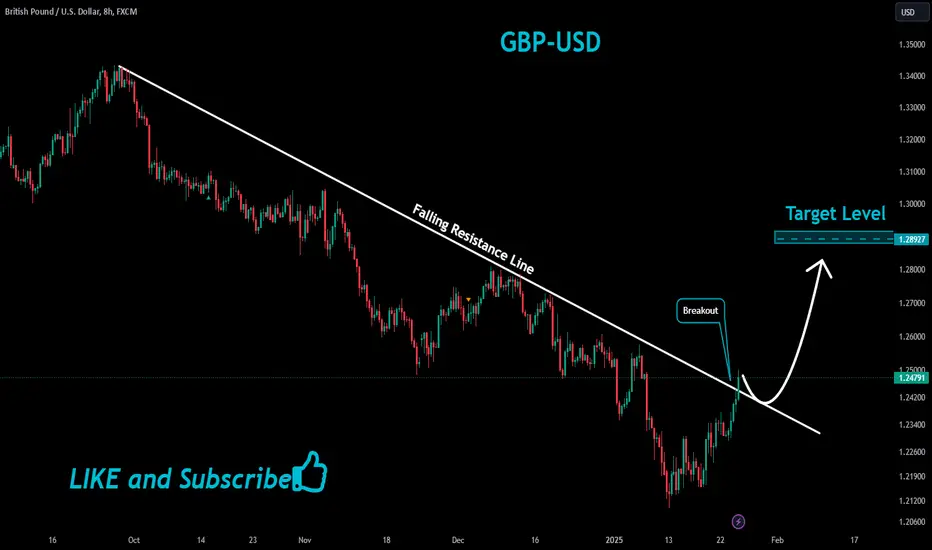
GBPUSD Bullish Breakout!
HI,Traders !
GBP-USD was trading
Beneath the falling resistance
Line but now we are seeing a
Bullish breakout so we are
Now locally bullish biased
And we will be expecting a
Further bullish move up !
Comment and subscribe to help us grow!
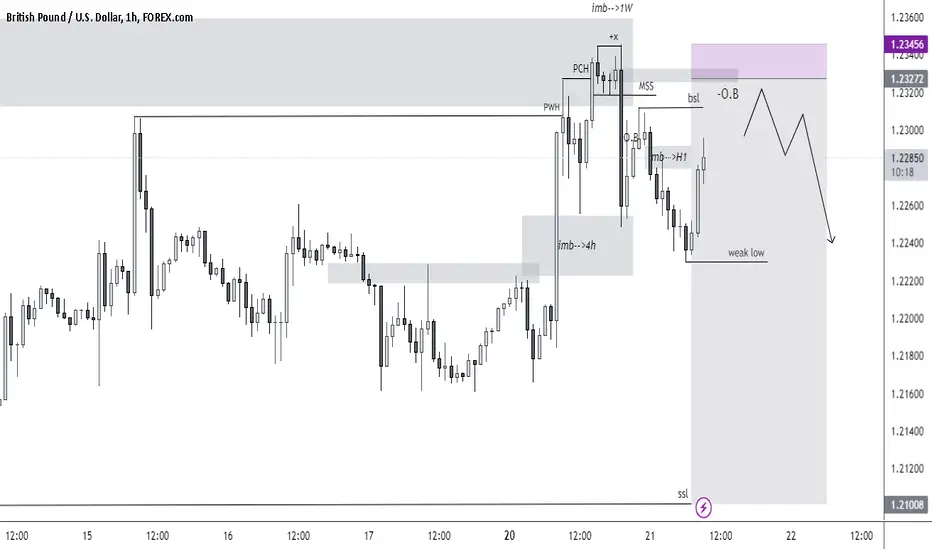
GBPUSD Sell ProjectionPrice bounced from a key level, weekly fair value gap. I observed a bearish break of structure and I'm confident the current bulls are sponsored by a retracement to sweep buyside liquidity before price expands lower to the sellside. Go short!
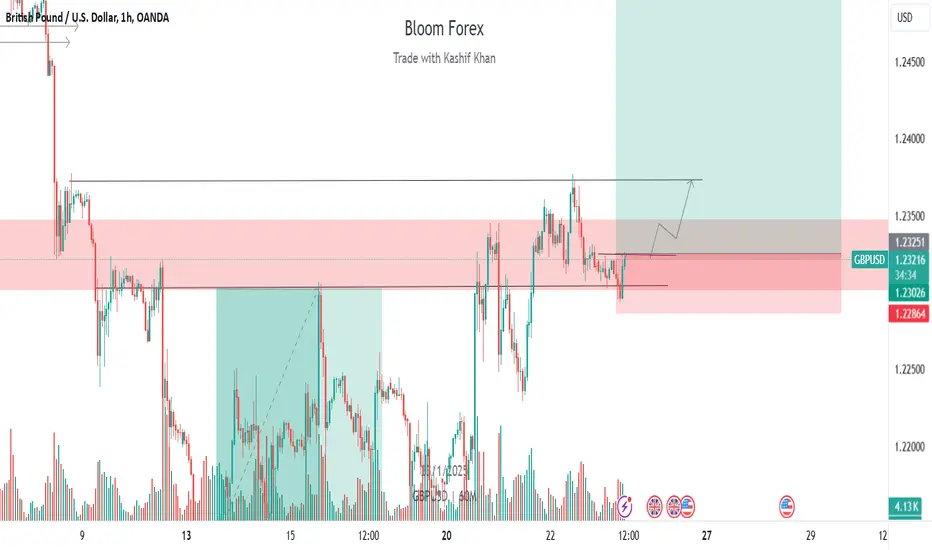
GBPUSD Buy area at 1.23248 with strong confirmationsWait for the breakout and put the trade with proper analysis and risk mangements
GBPUSD Buy area at 1.23248 with strong confirmations
Stop Loos: 1.22963
Take Profit Level: 1.2376
Level 2nd; 1.24932
The Setup follow the 1st risk on account and use trail stop loss.
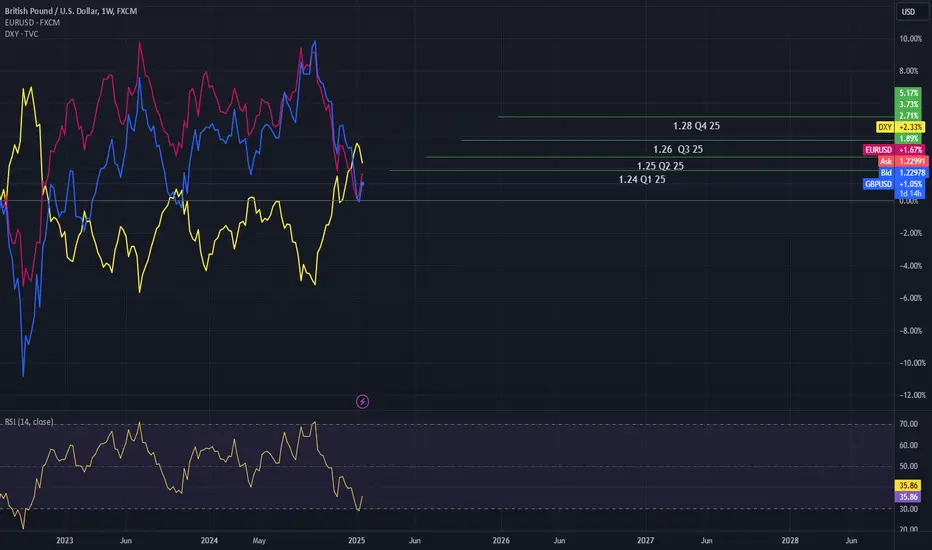
GBPUSD Quarterly Forecast by Global banks, seems they're bullishGBPUSD Quarterly Forecast by Global banks, seems they're bullish
Q1/Q2/Q3/Q4 2025
Forecast - 1.24 / 1.25 / 1.26 / 1.28
Forward - 1.23 / 1.23 / 1.23 / 1.23
Gbpusd Ready To Go DownGBP/USD trades in a tight range near 1.2350 on Wednesday as the US Dollar stays on the back foot amid a positive shift seen in risk sentiment. Investors keep a close eye on comments from US President Donald Trump on trade policies.
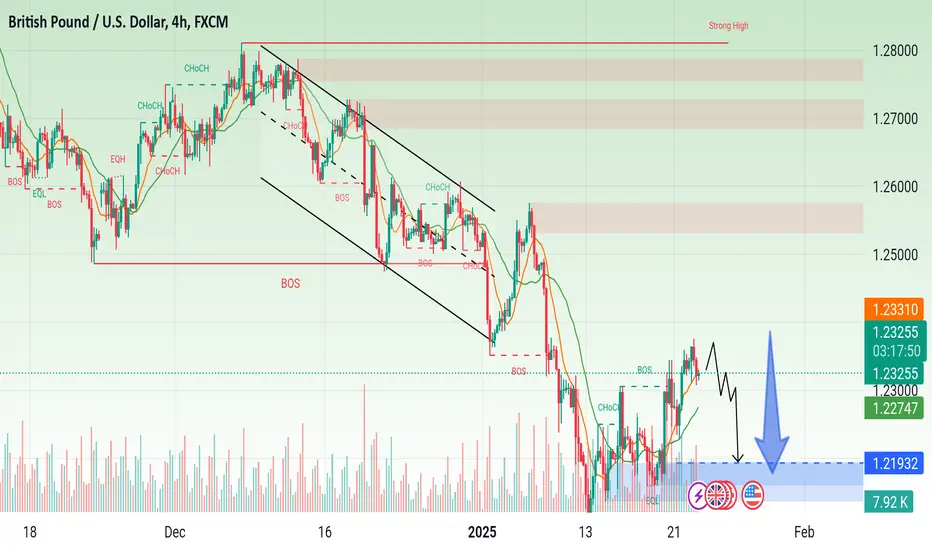
GBP USD Trade Setup Daily Timeframe
On the daily timeframe, GBP USD has broken below a key support level, which has now turned into resistance. and the price is currently rejecting this level.
We will focus on selling opportunities by analyzing the lower timeframes for entry patterns and confirmation.

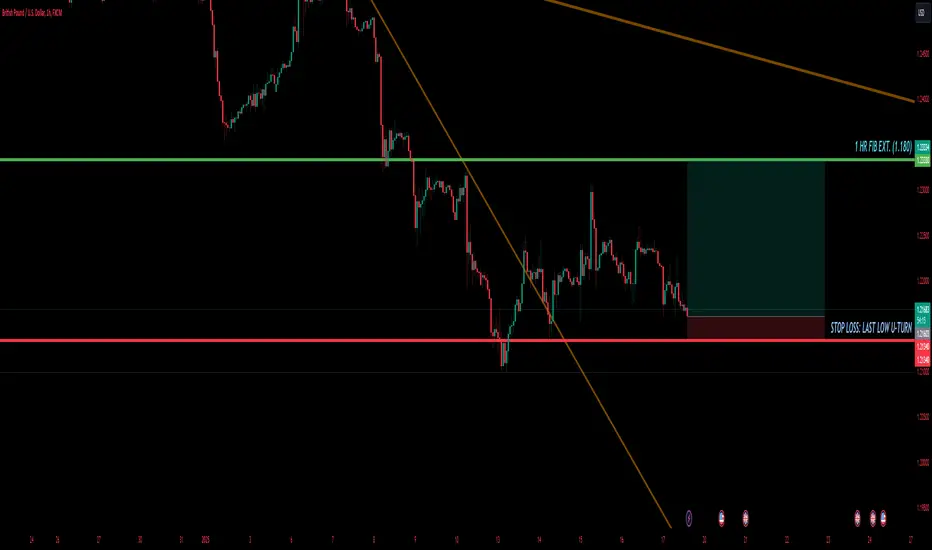
GBP/USD BUY IDEA (R:R=6.5)BUYING GBP/USD now. A beautiful SHALLOW KINGS CROWN formed on the daily chart on January 13th. Currently is in buy zone on 1 hour chart.
My Stop Loss is: 1.21340
My Target is: 1.23330 (1.880 FIB D Ext.)
Hope everyone has a great week trading!
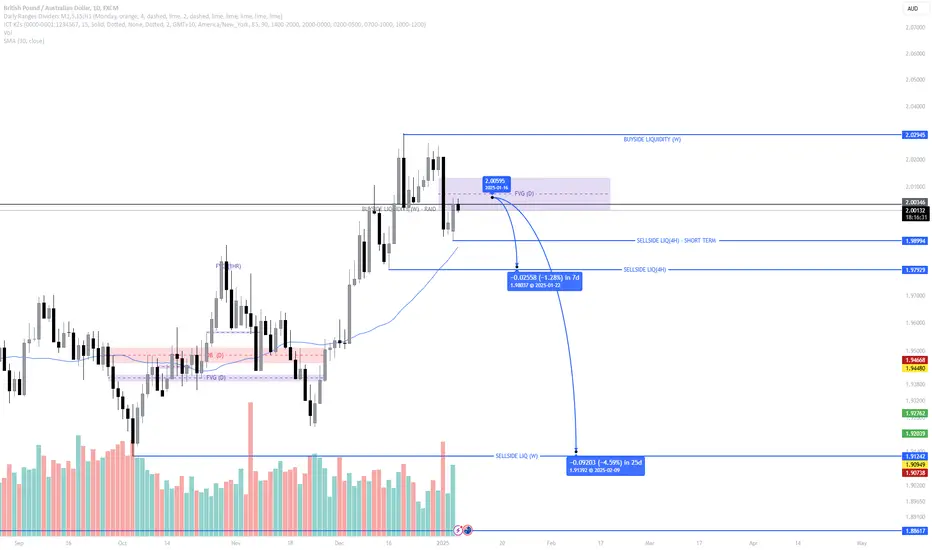
Pound Down Under: Will the FVG Hold or Flip? - GBPAUDThe GBPAUD chart showcases intriguing price action with a potential bearish setup. Following the raid on higher time frame (HTF) buyside liquidity (weekly), price has displaced lower, signaling a short-term bearish bias.
On the daily timeframe, price has formed a high-probability FVG after raiding a short-term low. This FVG becomes a key level to watch:
-Scenario 1: If price respects the FVG, expect continuation to the downside, targeting sell-side liquidity levels at 1.98994 and 1.97929.
-Scenario 2: If the FVG is disrespected and used as an Inverse Fair Value Gap (IFVG), anticipate a bullish reversal, potentially pushing price higher.
Conclusion:
Short-term bearish bias targeting sell-side liquidity zones.
Monitor the FVG closely for confirmation or invalidation.
DYOR!
GBPUSD HTF Bearish Structure & Possible Trade Opportunity 👀 👉 Analyzing the GBPUSD weekly chart reveals a bearish market structure, with a clear lower high and lower low signaling a downtrend. I expect further downside potential following a pullback. In this video, we explore the trend, price action, market structure, and a possible trade setup. ⚠️ This video is for educational purposes only and should not be considered financial advice.

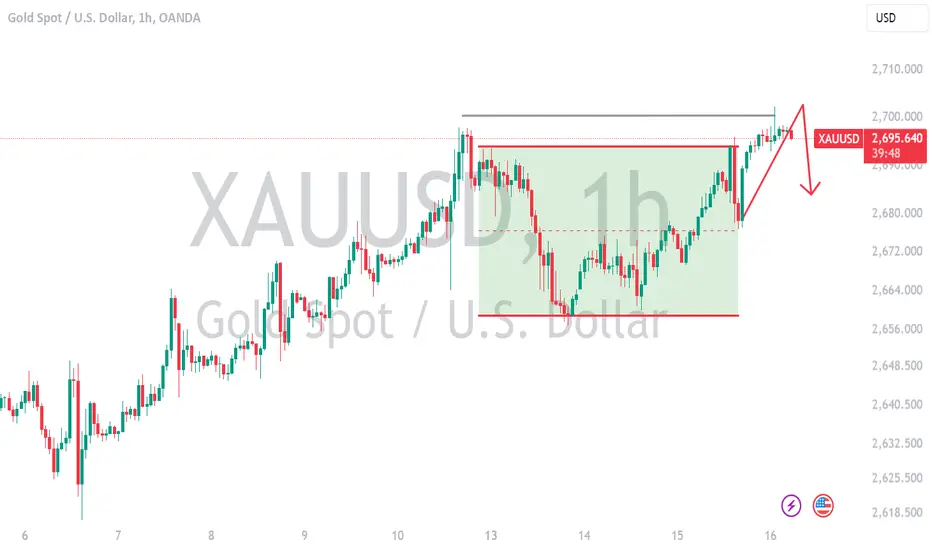
GOLD can jump down more .. Gold is showing signs of potential downside movement, suggesting that bearish pressure could dominate in the near term. Traders should remain vigilant and closely monitor key support levels to confirm the next direction. While the current trend hints at a possible drop, unexpected volatility could still influence the market, making it essential to adopt a cautious approach. Proper risk management and careful analysis are crucial to navigating this environment effectively.
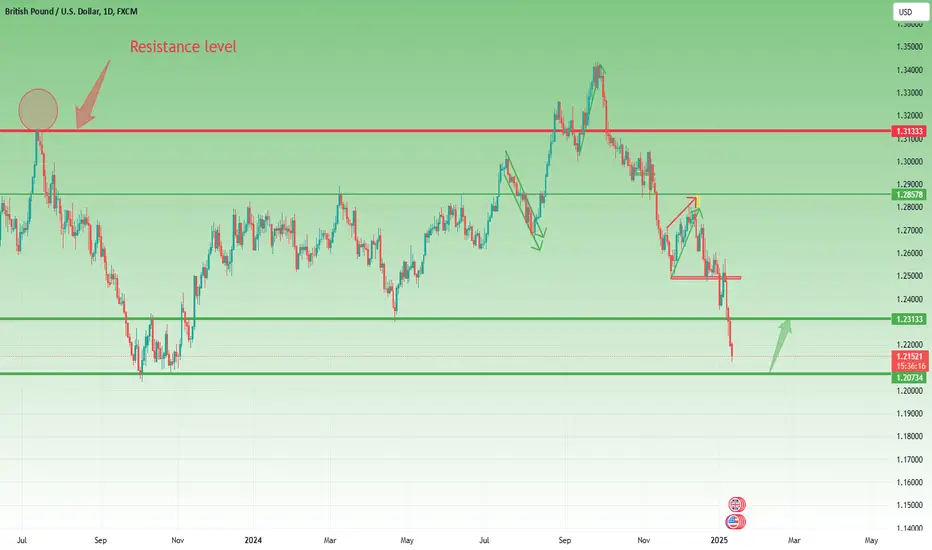
GbpUsd could correct from important supportLast week, GBP/USD saw a sharp decline, dropping over 400 pips from its recent high after briefly spiking above former support, which has now turned into resistance.
The pair is currently trading at 1.2150. Although the overall trend remains strongly bearish, a short-term correction and upward move is possible.
The 1.2070 level serves as key technical support, and with the psychological 1.2000 level nearby, short-term traders might find buying opportunities in this zone.
If a rebound occurs, the 1.2300 level could serve as a potential target for such a trade.
GBPUSD NEXT MOVE?GBPUSD we re expecting some big up side move towards 1.24 area with given stoploss trade safe stay tuned
GBP/USD at Crucial Support: Will It Hold?GBP/USD has broken below the support line and is currently trading near key support levels.
If the price fails to hold these levels, we could see a sharp decline in GBP/USD.
