DeGRAM | GBPUSD is forming the falling wedge📊 Technical Analysis
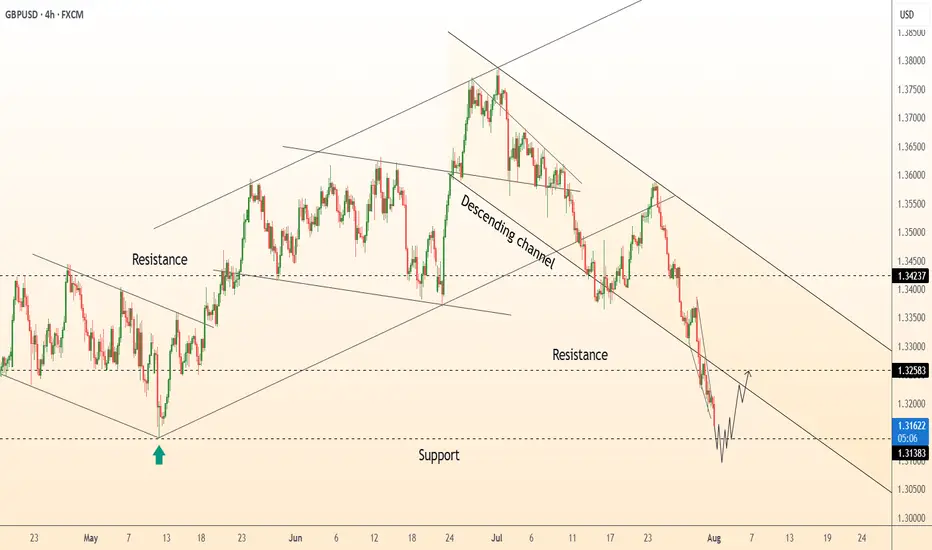
● GBPUSD is attempting a reversal from the lower boundary of a descending channel after forming a short-term double-bottom near 1.3138.
● Price is now climbing toward 1.3258 resistance, supported by bullish divergence and a break of the local falling wedge.
💡 Fundamental Analysis
● The USD is under pressure ahead of key NFP data, as ISM manufacturing misses weighed on Treasury yields.
● Positive UK PMI and consumer lending data have supported GBP, with BoE policy expectations firming above neutral.
✨ Summary
Long bias above 1.3138. Breakout targets 1.3258 ➜ 1.3423. Setup valid while price holds above 1.3110 support.
-------------------
Share your opinion in the comments and support the idea with a like. Thanks for your support!
Gbpusdanalysis
GBPUSD: Bearish Momentum vs. Fundamental Repricing – Key LevelsGBPUSD is at a critical juncture, balancing a clear technical breakdown with a fundamental backdrop favoring near-term volatility. The pair has slipped from its rising wedge structure and is now testing key retracement zones while markets reprice expectations for Fed rate cuts after weak US jobs data. Traders are closely watching whether this bearish momentum will extend toward the 1.3128 support or if a rebound from oversold conditions could trigger a corrective bounce.
Technical Analysis (8H Chart)
Pattern: Clear breakdown from a rising wedge, confirming bearish bias.
Current Level: Price sits near 1.3278, struggling to reclaim the 1.3300 resistance zone.
Key Support Zones:
1.3128 (61.8% Fibonacci retracement) – main bearish target.
1.2945 (78.6% retracement) – extended downside target if selling pressure deepens.
Resistance Levels:
1.3300 (immediate resistance, prior support now flipped).
1.3380 (secondary resistance if a retracement rally occurs).
Projection: Likely bearish continuation toward 1.3128, with a potential retest of 1.3300 before continuation.
Fundamental Analysis
Bias: Bearish in the short term, but Fed policy and risk sentiment remain key drivers.
Key Fundamentals:
USD: Weak NFP (73K), higher unemployment (4.2%), and downward revisions boost Fed cut bets (~75% for September), typically a USD-negative factor.
GBP: BOE maintains a cautious stance due to sticky inflation but lacks clear hawkish conviction as growth slows.
Tariffs: US tariffs add a mild negative weight on GBP trade sentiment.
Risks:
Hot US CPI could slow Fed cut bets, supporting USD.
Hawkish BOE comments could limit GBP downside.
Global risk sentiment shifts could either favor USD (risk-off) or weaken it further (risk-on).
Key Events:
US CPI and PPI for USD direction.
BOE policy updates and UK CPI.
US jobless claims and Fed commentary.
Leader/Lagger Dynamics
GBP/USD is a lagger, mainly reacting to USD shifts. However, its moves directly influence GBP crosses such as GBP/JPY and GBP/CHF.
Summary: Bias and Watchpoints
GBP/USD remains in a bearish phase, targeting 1.3128 with a potential corrective bounce toward 1.3300 first. The primary driver is the technical breakdown, while fundamentals add volatility around US CPI and BOE policy. If CPI surprises lower, the bearish outlook could reverse into a short-term rebound; if CPI is hot, downside momentum could extend. You should monitor USD-driven events closely as GBP/USD sets the tone for broader GBP movements.

GBP/USD: Post-Impulse Sell Setup from Ending DiagonalThe chart depicts a completed 5-wave impulsive structure, culminating at the top of wave (5). The internal wave structure of the final fifth wave forms a classic ending diagonal pattern, typically signaling a trend reversal or deep correction.
After this extended fifth wave, the price has started rolling over, confirming the start of a corrective decline. The wave count now expects an ABC correction targeting the previous wave 4/2 demand zone, highlighted in red.
Target 1 (T1): 1.33608
Target 2 (T2): 1.32436
Stop Loss (SL): 1.35988
Ending diagonal at the top of wave (5) signals exhaustion of bullish momentum.
Clear bearish divergence (not shown here) is commonly seen with this pattern.
The price has broken the short-term structure and is now forming lower highs.
Target zone aligns with previous wave 2 consolidation – a typical retracement zone for post-impulse corrections.

GBPUSD Will Go Down!
HI,Traders !
#GBPUSD keeps falling down
And broke the
Key wide horizontal level
Around 1.33938 which is now
A resistance and the breakout
Is confirmed so we are very
Bearish biased and we will
Be expecting a bearish
Continuation !
Comment and subscribe to help us grow !

GBPUSD – DAILY FORECAST Q3 | W31 | D1 | Y25📊 GBPUSD – DAILY FORECAST
Q3 | W31 | D1 | Y25
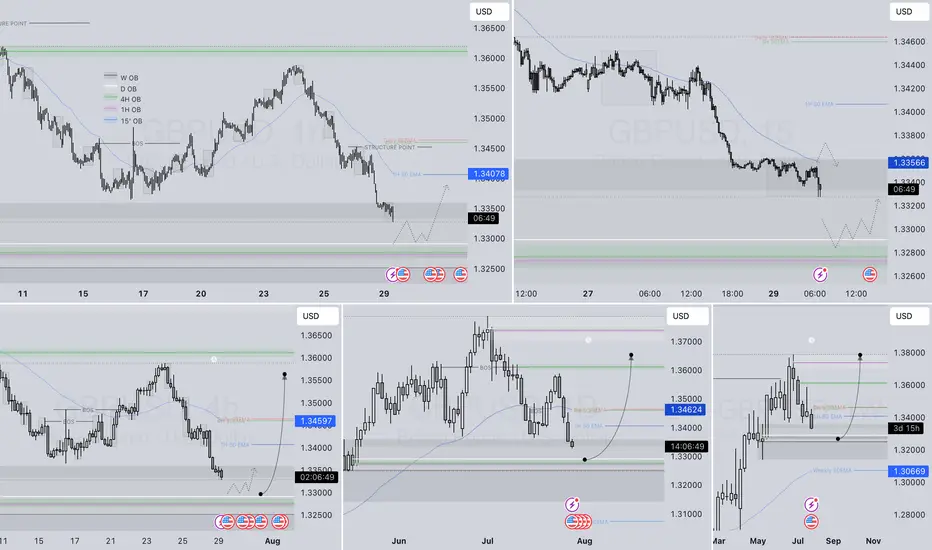
Daily Forecast 🔍📅
Here’s a short diagnosis of the current chart setup 🧠📈
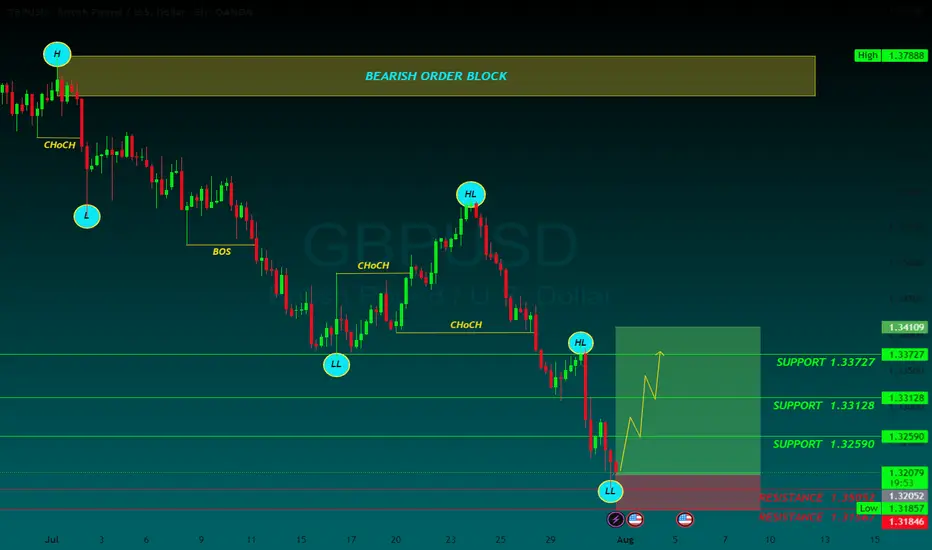
Higher time frame order blocks have been identified — these are our patient points of interest 🎯🧭.
It’s crucial to wait for a confirmed break of structure 🧱✅ before forming a directional bias.
This keeps us disciplined and aligned with what price action is truly telling us.
📈 Risk Management Protocols
🔑 Core principles:
Max 1% risk per trade
Only execute at pre-identified levels
Use alerts, not emotion
Stick to your RR plan — minimum 1:2
🧠 You’re not paid for how many trades you take, you’re paid for how well you manage risk.
🧠 Weekly FRGNT Insight
"Trade what the market gives, not what your ego wants."
Stay mechanical. Stay focused. Let the probabilities work.
FX:GBPUSD
GBPUSD BUYGBP/USD rebounds from lows, back above 1.3200
GBP/USD now alternates gains with losses in the low-1.3200s, reversing an early pullback to the 1.3180 zone. Meanwhile, Cable's inconclusive tone is accompanied by some renewed selling pressuron on the the US Dollar in the wake of US data releases.
Robust macroeconomic data releases from the United States (US) and the Federal Reserve's (Fed) cautious tone on policy-easing fuelled a bullish rally in the US Dollar (USD) midweek, causing GBP/USD to decline sharply.
The US Bureau of Economic Analysis' (BEA) first estimate showed that the United States' (US) economy staged an impressive comeback following the 0.5% contraction seen in the first quarter. The Gross Domestic Product (GDP) grew at an annual rate of 3% in the second quarter, surpassing the market expectation of 2.4%. Additionally, ADP Employment Change came in at 104,000 in July, beating analysts' estimate of 78,000 by a wide margin.
Later in the day, the Fed announced that it maintained the policy rate at the range of 4.25%-4.5% in a widely expected decision. The policy statement showed that Governor Christopher Waller and Governor Michelle Bowman dissented, preferring a 25 basis points (bps) rate cut, which was also anticipated.
In the post-meeting press conference, Fed Chairman Jerome Powell refrained from confirming a rate cut at the next meeting in September, citing heathy conditions in the labor market and explaining that the current policy stance as being appropriate to guard against inflation risks. Moreover, Powell said that the policy was not holding back the economy despite being still modestly restrictive.
According go the CME FedWatch Tool, the probability of a 25 basis points Fed rate cut in September dropped toward 40% from above-60% before the Fed event. In turn, US Treasury bond yields pushed higher and the USD outperformed its rivals during the American trading hours.
The BEA will release Personal Consumption Expenditures (PCE) Price Index data for June on Thursday. Powell said that they expect the annual PCE inflation and Core PCE inflation to come in at 2.5% and 2.7%, respectively. Weekly Initial Jobless Claims will also be featured in the US economic calendar. Ahead of Friday's critical July employment report, investors could remain hesitant to take large positions based on this data.
It's important to note that month-end flows on the last day of July could ramp up volatility toward the end of the European session and trigger irregular movements in the pair.
SUPPORT 1.33727
SUPPORT 1.33128
SUPPORT 1.32590
RESISTANCE 1.3052
RESISTANCE 1.31567
Market Trap Alert! GBP/USD Bearish Robbery Plan🔥💸 "The Cable Heist" – GBP/USD Robbery Plan Using Thief Trading Style 💸🔥
— Unfiltered Forex Forecast with Risky Intentions —
🌍 Hey Money-Makers, Market Hustlers & Chart Bandits! 🤑✈️
Hola! Bonjour! Marhaba! Hallo! Ciao! Welcome to the Forex streets where the smart rob the charts, not banks.
Ready for the GBP/USD Heist? Let’s break it down with our infamous Thief Trading Style – raw, unapologetic, and built for profits.
💼 Operation Name: “The Cable Forex Bank Robbery”
🎯 Pair: GBP/USD – aka “The Cable”
⚔️ Style: Scalp / Day Trade / Swing Heist
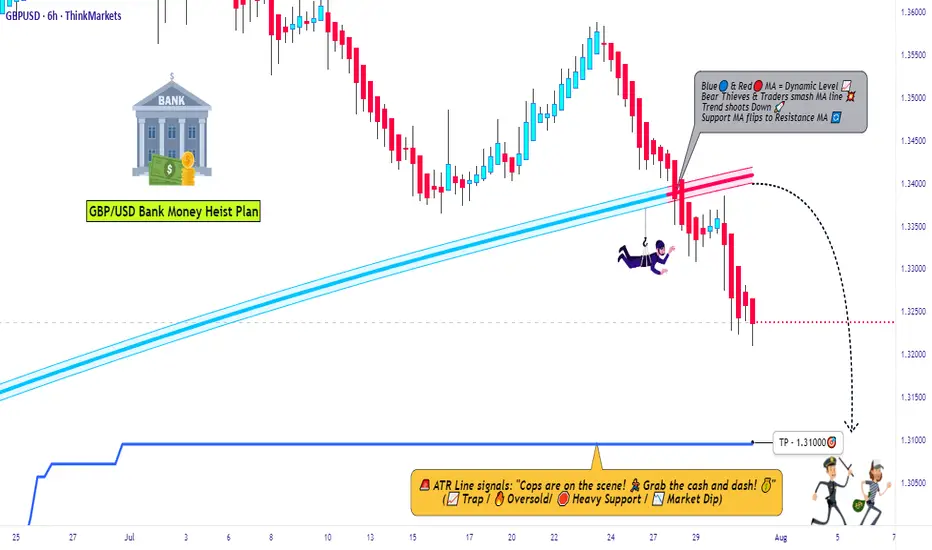
📊 Bias: Short (Bearish Setup)
🛠 STRATEGY SETUP: "Follow the Shadows"
🔍 Analysis Basis:
Smart-Money Traps at Key Levels
Oversold ≠ Reversal (Read between the candles)
Liquidity Hunting Zones
Retail Stop Clusters Exposed
Thief-style DCA Entries (Staggered Entry Levels)
Multi-timeframe Confirmation
COT, Sentiment & News-Driven Volatility
🎯 ENTRY ZONE:
Enter short (sell) using 15M or 30M chart.
Sell Limits near recent highs (pullback zone).
DCA (Layered Entry) recommended – Thief loves catching price slipping.
Let the liquidity work for us.
🛑 STOP LOSS (SL):
Base SL around 1.34000 on 4H Chart – above swing high.
Adjust SL per position size and total entries.
Manage risk, but remember: thieves don’t panic, they plan!
🎯 TARGET ZONE:
TP near 1.31000 or adjust using price action.
Escape before target if market mood flips – no need to be greedy.
Trail SLs if market momentum dies down.
👀 Scalpers' Special Note:
Only SHORT — don’t mess with long side unless you’re a liquidity donor.
Quick ins & outs. If you're loaded with capital, jump in big – else follow the swing team.
Use trailing SLs for safety — protect the loot.
📢 FUNDAMENTALS TO WATCH:
News Impacting GBP/USD
COT Reports
Sentiment Indicators
Macro Trends / Yield Spreads
US Dollar Strength Index (DXY)
UK Economic Reports (CPI, GDP, Rate Decisions)
⚠️ RISK MANAGEMENT TIPS:
🚨 Avoid new entries during news releases
🚨 Use trailing stops during volatility spikes
🚨 Secure running trades before major announcements
🚀 Boost the Robbery – Support the Strategy
💖 Smash that BOOST BUTTON if you're vibing with this setup. Help the Thief crew grow stronger!
Let’s keep milking the market 💸 – one “heist” at a time. Stay dangerous, stay smart.
🔓 NOTE: This isn't investment advice. Just a wild trading idea from a chart outlaw.
Always DYOR – Do Your Own Robbery (Research).
Market conditions shift fast. Stay alert, adapt, and respect your capital.
#ForexThiefStyle #CableHeist #GBPUSDShort #SmartMoneyMoves #LiquidityHunters #ChartOutlaws #TradingRebels #DayTradeLife #ScalpersParadise #ForexGang #FXHeistPlans
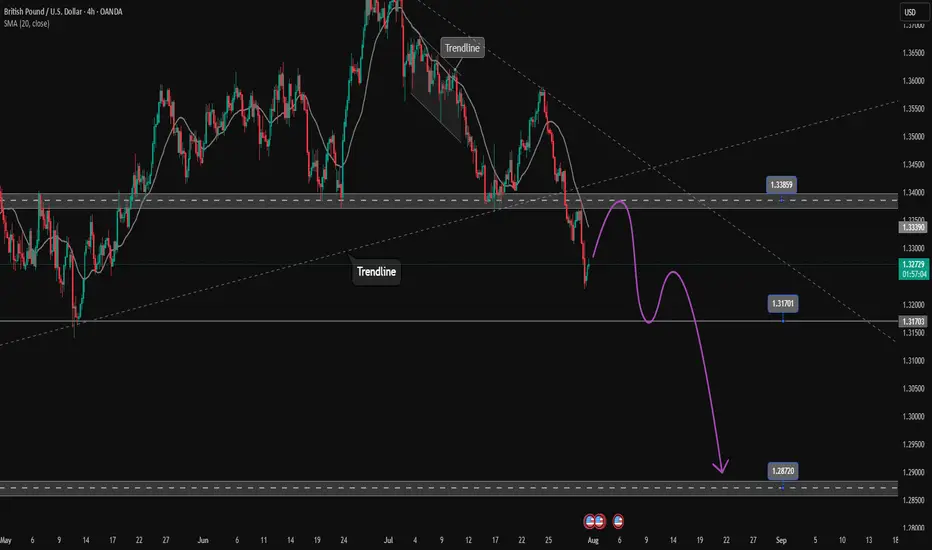
GBPUSD extends to the downside. Wait for retest to sell✏️ OANDA:GBPUSD confirms the downtrend by breaking the trendline. The downtrend is still extending to lower areas because the GBPUSD bearish wave structure is very beautiful. Some selling momentum appears around the breakout zone of 1.339, which will form a bearish structure towards the support of 1.287 in the near future. Putting faith in the trendline at the moment is reliable.
📉 Key Levels
SELL zone 1.339-1.341
SELL DCA trigger: Break and trading bellow 1.317
Target 1.287
Leave your comments on the idea. I am happy to read your views.
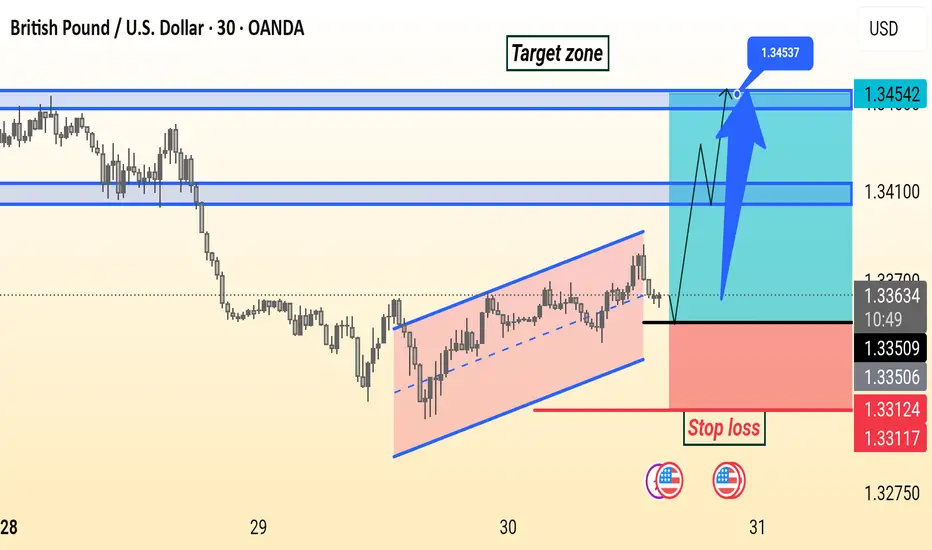
GBPUSD Setup GBP/USD is forming a bullish channel on the 30-minute chart. Price is expected to break above resistance near 1.3365, targeting the 1.3455 zone. Stop loss is set below the channel at 1.3312.
DeGRAM | GBPUSD reached the lower boundary of the channel📊 Technical Analysis
● GBPUSD has broken out of a falling wedge within a descending channel, reclaiming the lower boundary of the broader structure.
● Price is consolidating just above 1.33160 support and appears ready to retest the 1.34650 resistance, aided by a series of higher lows and a bullish break of short-term trendlines.
💡 Fundamental Analysis
● Weakening USD sentiment continues after Friday’s softer core PCE and downward revision of Michigan inflation expectations.
● UK economic sentiment improved after recent wage growth and mortgage approval data exceeded forecasts, bolstering GBP.
✨ Summary
Breakout from wedge confirms bullish bias. Support at 1.33160; target 1.34650 short-term. Watch for rally continuation while holding above 1.33625.
-------------------
Share your opinion in the comments and support the idea with a like. Thanks for your support!

GBPUSD(20250730)Today's AnalysisMarket News:
According to a Reuters/Ipsos poll, Trump's approval rating has fallen to 40%, the lowest level since his second term.
Technical Analysis:
Today's Buy/Sell Levels:
1.3339
Support and Resistance Levels:
1.3395
1.3374
1.3360
1.3317
1.3304
1.3283
Trading Strategy:
If the price breaks above 1.3360, consider a buy entry with the first target at 1.3374. If the price breaks below 1.3339, consider a sell entry with the first target at 1.3317
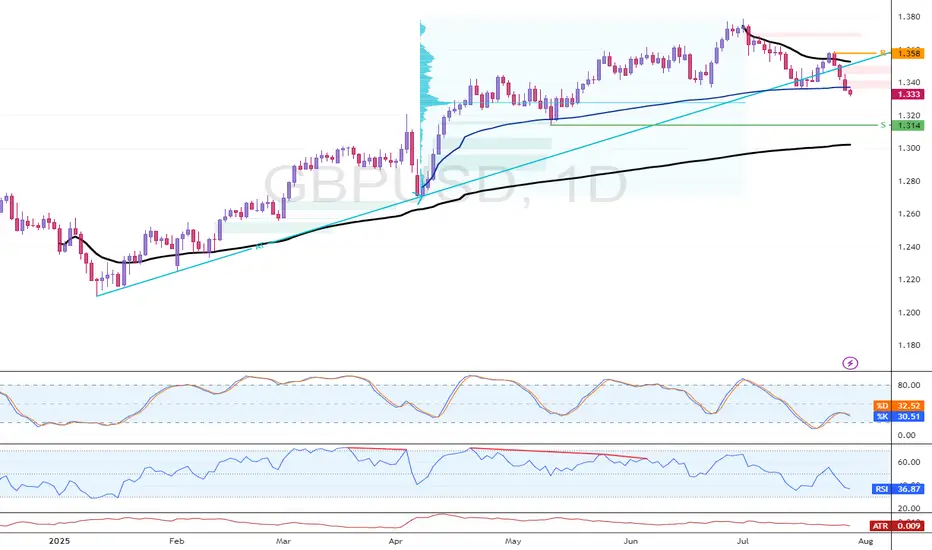
GBP/USD Weakens Below TrendlineFenzoFx—GBP/USD broke below the ascending trendline and currently trades slightly below the VWAP at $1.322. Immediate resistance is at $1.357. From a technical perspective, the downtrend will likely extend to $1.313 if this level holds.
The bearish outlook should be invalidated if GBP/USD closes and stabilizes above $1.357.
GBPUSD – DAILY FORECAST Q3 | W31 | D29 | Y25📊 GBPUSD – DAILY FORECAST
Q3 | W31 | D29 | Y25
Daily Forecast 🔍📅
Here’s a short diagnosis of the current chart setup 🧠📈
Higher time frame order blocks have been identified — these are our patient points of interest 🎯🧭.
It’s crucial to wait for a confirmed break of structure 🧱✅ before forming a directional bias.
This keeps us disciplined and aligned with what price action is truly telling us.
📈 Risk Management Protocols
🔑 Core principles:
Max 1% risk per trade
Only execute at pre-identified levels
Use alerts, not emotion
Stick to your RR plan — minimum 1:2
🧠 You’re not paid for how many trades you take, you’re paid for how well you manage risk.
🧠 Weekly FRGNT Insight
"Trade what the market gives, not what your ego wants."
Stay mechanical. Stay focused. Let the probabilities work.
FX:GBPUSD
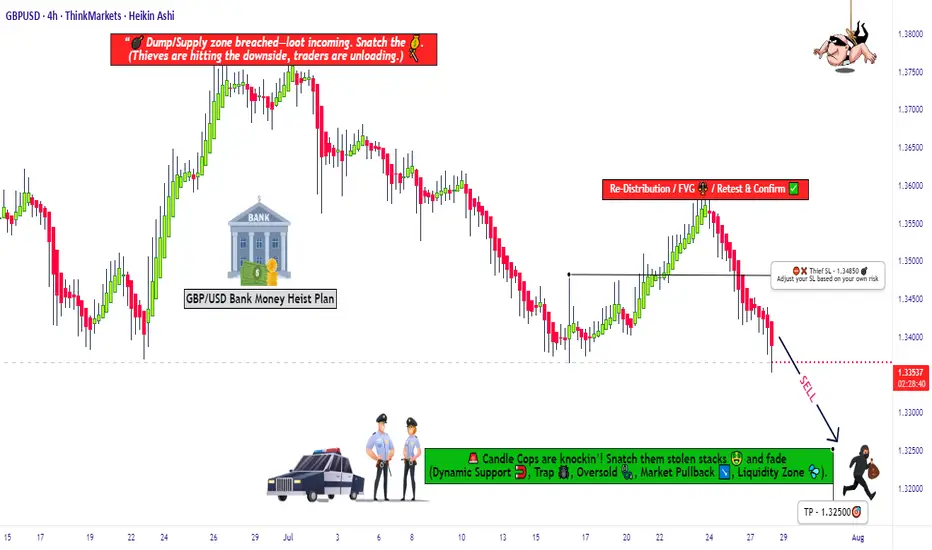
Market Trap Alert! GBP/USD Bearish Robbery Plan🔥💸 "The Cable Heist" – GBP/USD Robbery Plan Using Thief Trading Style 💸🔥
— Unfiltered Forex Forecast with Risky Intentions —
🌍 Hey Money-Makers, Market Hustlers & Chart Bandits! 🤑✈️
Hola! Bonjour! Marhaba! Hallo! Ciao! Welcome to the Forex streets where the smart rob the charts, not banks.
Ready for the GBP/USD Heist? Let’s break it down with our infamous Thief Trading Style – raw, unapologetic, and built for profits.
💼 Operation Name: “The Cable Forex Bank Robbery”
🎯 Pair: GBP/USD – aka “The Cable”
⚔️ Style: Scalp / Day Trade / Swing Heist
📊 Bias: Short (Bearish Setup)
🛠 STRATEGY SETUP: "Follow the Shadows"
🔍 Analysis Basis:
Smart-Money Traps at Key Levels
Oversold ≠ Reversal (Read between the candles)
Liquidity Hunting Zones
Retail Stop Clusters Exposed
Thief-style DCA Entries (Staggered Entry Levels)
Multi-timeframe Confirmation
COT, Sentiment & News-Driven Volatility
🎯 ENTRY ZONE:
Enter short (sell) using 15M or 30M chart.
Sell Limits near recent highs (pullback zone).
DCA (Layered Entry) recommended – Thief loves catching price slipping.
Let the liquidity work for us.
🛑 STOP LOSS (SL):
Base SL around 1.34850 on 4H Chart – above swing high.
Adjust SL per position size and total entries.
Manage risk, but remember: thieves don’t panic, they plan!
🎯 TARGET ZONE:
TP near 1.32500 or adjust using price action.
Escape before target if market mood flips – no need to be greedy.
Trail SLs if market momentum dies down.
👀 Scalpers' Special Note:
Only SHORT — don’t mess with long side unless you’re a liquidity donor.
Quick ins & outs. If you're loaded with capital, jump in big – else follow the swing team.
Use trailing SLs for safety — protect the loot.
📢 FUNDAMENTALS TO WATCH:
News Impacting GBP/USD
COT Reports
Sentiment Indicators
Macro Trends / Yield Spreads
US Dollar Strength Index (DXY)
UK Economic Reports (CPI, GDP, Rate Decisions)
⚠️ RISK MANAGEMENT TIPS:
🚨 Avoid new entries during news releases
🚨 Use trailing stops during volatility spikes
🚨 Secure running trades before major announcements
🚀 Boost the Robbery – Support the Strategy
💖 Smash that BOOST BUTTON if you're vibing with this setup. Help the Thief crew grow stronger!
Let’s keep milking the market 💸 – one “heist” at a time. Stay dangerous, stay smart.
🔓 NOTE: This isn't investment advice. Just a wild trading idea from a chart outlaw.
Always DYOR – Do Your Own Robbery (Research).
Market conditions shift fast. Stay alert, adapt, and respect your capital.
#ForexThiefStyle #CableHeist #GBPUSDShort #SmartMoneyMoves #LiquidityHunters #ChartOutlaws #TradingRebels #DayTradeLife #ScalpersParadise #ForexGang #FXHeistPlans
GBP/USD 4H Bearish Reversal Setup. GBP/USD 4H Chart Analysis (July 24, 2025):
Price is rejecting resistance near 1.35709, forming a bearish setup. A short position is highlighted with entry around 1.35067, stop loss above resistance, and target near the 1.33786 support zone. Bears aim for continuation toward 1.33745.

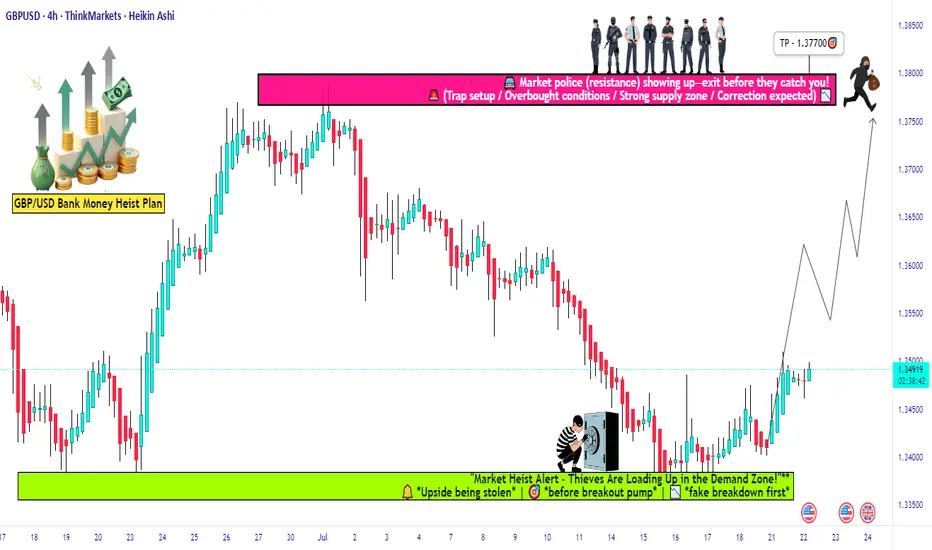
GBP/USD Long Setup: Loot & Escape Before Bears Attack!🏴☠️ GBP/USD HEIST ALERT: "The Cable" Bank Robbery Plan! 💰🚨
Thief Trading Strategy | Swing/Day Trade | High-Risk, High-Reward Loot!
🤑 DEAR MARKET PIRATES & MONEY SNATCHERS!
Based on our 🔥Thief Trading Masterplan🔥, we’re targeting the GBP/USD ("The Cable") for a bullish heist! Police barricades (resistance) are risky, but overbought markets = consolidation = TREND REVERSAL TRAP! Bears are strong here, but smart robbers take profits early!
🎯 Mission: LONG ENTRY + ESCAPE BEFORE THE POLICE (SELLERS) ARRIVE!
🔓 ENTRY: "VAULT IS OPEN!"
📍 Bullish Loot Zone: Swipe longs at any price—but smart thieves use Buy Limits near 15M/30M swing lows for pullback entries!
📍 Pro Thief Move: DCA/Layering strategy (multiple limit orders for max loot).
🛑 STOP LOSS: "DON’T GET CAUGHT!"
📍 SL @ Recent Swing Low (4H): 1.33700 (Adjust based on your risk, lot size, & entry layers!).
📍 Day/Swing Trade? Tighten SL if scalping!
🎯 TARGETS: "LOOT & BOUNCE!"
✅ 1.37700 (Main Heist Target)
✅ Scalpers: Trail SL & escape early!
✅ Swing Bandits: Hold for bigger payout!
📢 THIEF’S FUNDAMENTAL INTEL
Why GBP/USD? Bullish momentum from:
Macro Trends (COT Report, Sentiment, Liquidity Zones)
Intermarket Signals (Stocks, Bonds, Commodities)
News Trap Alerts (Avoid high-impact news chaos!)
🚨 THIEF’S GOLDEN RULES
✔ AVOID NEWS VOLATILITY! (No new trades during releases)
✔ TRAILING SL = SAFE ESCAPE ROUTE! (Lock profits like a pro)
✔ BOOST THIS IDEA! 💥 More boosts = stronger heist crew!
💎 FINAL WARNING
This is a HIGH-RISK heist! Only risk what you can lose.
Market conditions change FAST! Adapt or get caught.
Not advice—just a pirate’s plan! Do your own analysis.
🚀 NEXT HEIST COMING SOON… STAY TUNED, ROBBERS! 🏴☠️💸
GBPUSD ANALYSIS After seeing the weekly find support at the low of the previous bullish candle we could be looking for a push up on this pair but waiting to see how the pair trades for the London session today and if there will be a break of resistance on the 4hr timeframe

GBPUSD(20250728)Today's AnalysisMarket news:
Trump announced that the US and Europe reached a trade agreement: 15% tariffs on the EU, $600 billion in investment in the US, zero tariffs on the US by EU countries, the EU will purchase US military equipment, and will purchase US energy products worth $750 billion. However, the US and Europe have different opinions on whether the 15% tariff agreement covers medicines and steel and aluminum. Von der Leyen: 15% tariff rate is the best result that the European Commission can achieve.
US Secretary of Commerce: The deadline for tariff increase on August 1 will not be extended. The United States will determine the tariff policy on chips within two weeks.
Technical analysis:
Today's buying and selling boundaries:
1.3462
Support and resistance levels:
1.3578
1.3535
1.3507
1.3417
1.3389
1.3346
Trading strategy:
If the price breaks through 1.3462, consider buying, the first target price is 1.3507
If the price breaks through 1.3417, consider selling, the first target price is 1.3389

GBPUSD: Sellers Are Taking ControlWelcome back to the Weekly Forex Forecast for the week of July 28 - Aug 1st
In this video, we will analyze the following FX market:
GBPUSD
GBP is weak vs USD. GU is heading lower with a bit of steam.
The Monthly and the Weekly are still bullish, but the Daily and 4H indicate weakness. I would not entertain longs until I see a bullish BOS.
Look for the CISD on the 4H in the beginning of the week, confirming sells are the way to go.
Enjoy!
May profits be upon you.
Leave any questions or comments in the comment section.
I appreciate any feedback from my viewers!
Like and/or subscribe if you want more accurate analysis.
Thank you so much!
Disclaimer:
I do not provide personal investment advice and I am not a qualified licensed investment advisor.
All information found here, including any ideas, opinions, views, predictions, forecasts, commentaries, suggestions, expressed or implied herein, are for informational, entertainment or educational purposes only and should not be construed as personal investment advice. While the information provided is believed to be accurate, it may include errors or inaccuracies.
I will not and cannot be held liable for any actions you take as a result of anything you read here.
Conduct your own due diligence, or consult a licensed financial advisor or broker before making any and all investment decisions. Any investments, trades, speculations, or decisions made on the basis of any information found on this channel, expressed or implied herein, are committed at your own risk, financial or otherwise.

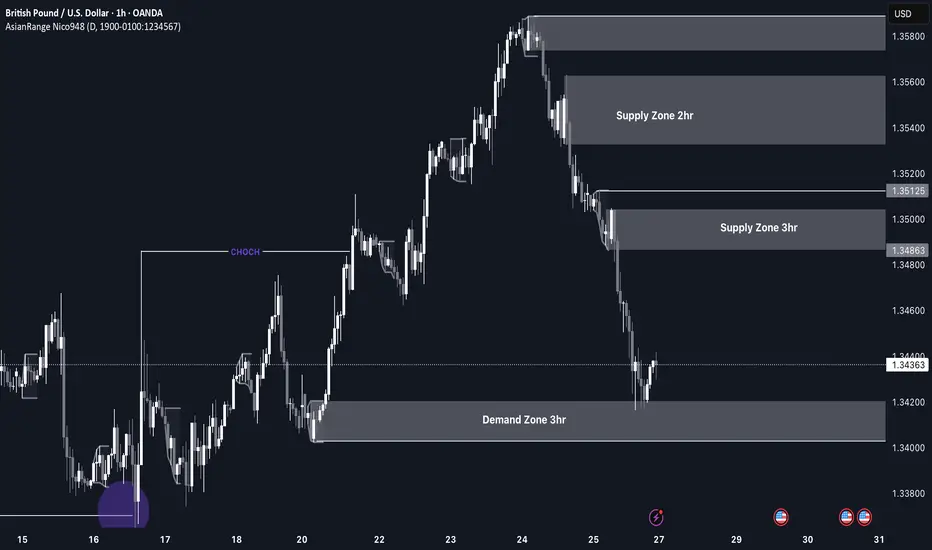
GBP/USD Longs to Shorts GU has been very bearish recently and is currently reacting from a clean demand zone with multiple confluences. While we may see a short-term push to the upside, I’ll be watching to see if price reaches the 3hr supply zone sitting at a premium level.
If price does reach that zone, I’ll be on the lookout for signs of Wyckoff distribution and a slowdown in momentum, which could signal the start of another bearish leg.
Confluences for GU Shorts:
Overall bearish trend remains intact — this is a pro-trend setup
Price may retrace to mitigate a 3hr supply zone
Liquidity to the downside still needs to be taken
Current demand zone may simply serve as a trigger for a retracement up to supply
P.S. If price fails to reach the supply zone and continues dropping, we’ll likely see a new break of structure and the formation of a fresh nearby supply zone, which we can then trade from.
Let’s stay sharp and have a profitable trading week ahead! 🔥📊💰
GBPUSDGBPUSD needs small correction and one more drop before upside.
Disclosure: We are part of Trade Nation's Influencer program and receive a monthly fee for using their TradingView charts in our analysis.

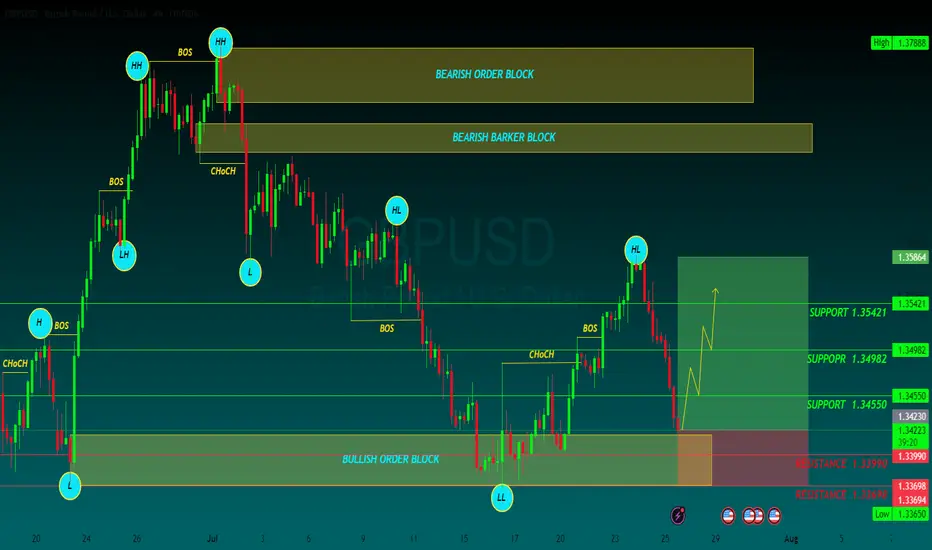
GBPUSD BUYGBP/USD drops to 1.3450 area after weak UK Retail Sales data
GBP/USD continues to push lower after closing in negative territory on Thursday and trades near 1.3450 on Friday. Weaker-than-expected Retail Sales data from the UK and the broad-based US Dollar strength forces the pair to stay on the back foot heading into the weekend
GBP/USD came under bearish pressure on Thursday and lost more than 0.5%, snapping a three-day winning streak in the process. The pair extends its slide on Friday and trades below 1.3500.
The renewed US Dollar (USD) strength weighed on GBP/USD on Thursday. The US Department of Labor reported that the number of first-time applications for unemployment benefits declined to 217,000 in the week ending July 19 from 221,000 in the previous week. This reading came in better than the market expectation of 227,000. Additionally, the S&P Global Composite Purchasing Managers Index (PMI) improved to 54.6 (preliminary) in July from 52.9 in June, reflecting an ongoing expansion in the private sector's business activity, at an accelerating pace.
Meanwhile, the EUR/GBP cross rose more than 0.3% on Thursday as the Euro benefited from the European Central Bank's (ECB) cautious tone on policy-easing. EUR/GBP preserves its bullish momentum and trades at its highest level since early April above 0.8700 on Friday, suggesting that the Euro continues to capture capital outflows out of Pound Sterling.
Early Friday, the UK's Office for National Statistics reported that Retail Sales rose by 0.9% on a monthly basis in June. This reading followed the 2.8% decrease recorded in May but came in worse than the market expectation for an increase of 1.2%, making it difficult for GBP/USD to stage a rebound.
In the second half of the day, Durable Goods Orders data for June will be the only data featured in the US economic calendar. Nevertheless, this data is unlikely to have a long-lasting impact on the USD's valuation.
SUPPORT 1.34550
SUPPORT 1.34982
SUPPORT 1.35421
RESISTANCE 1.33990
RESISTANCE 1.33698
GBPUSD BUY IDEAWe will be looking into taking the buys as per the chart. I hope this is an idea that resonates with you. Happy trading days
