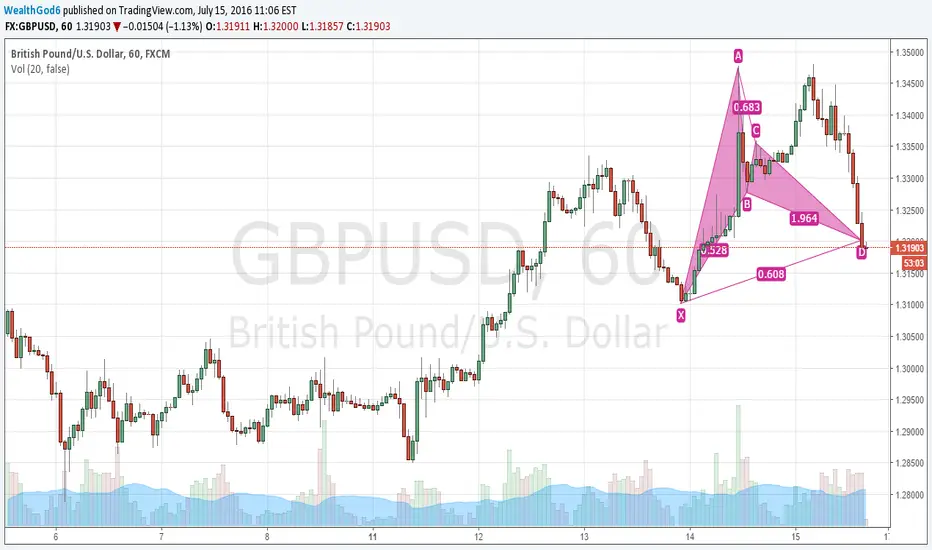
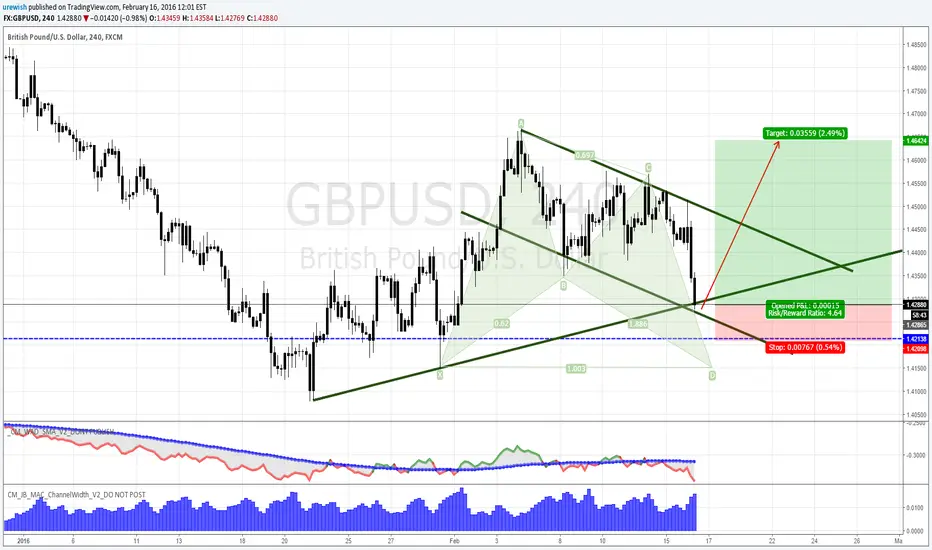
GBPUSD Crab completion!!!Last few hours of the trading week has proven to be a nail bitter. Lets see if structure reigns supreme.
Gbpusdforex
GBPUSD forcast GBPUSD forcast . I dont think GBPUSD will have big buy power . currently trade as short sell when GBP hit resistances.
Forex Market Analysis And Trading Tips Feb 17th 2016SUMMARY:
The primary trend of GBP/USD is bearish on charts and price is trading above the trend line in its 4 hourly chart. In 4 hourly chart the price is sustaining above 50 day SMA and taking resistance of 200 day SMA indicating downtrend of the pair. It is having an important resistance at the level of 1.4405 and support at the level of 1.4175. If it breaks its support level on the downside and sustains below it then we can expect it to show further bearish movement in the pair.
INDICATORS:-
MACD is sustaining in its negative territory indicating the bearish trend in the pair.
RSI is sustaining in its selling zone indicating the upcoming bearish trend in the pair.
STRATEGY:
GBP/USD is looking bearish on charts for next few trading session. One can go for sell on higher level strategy for this pair for intra day to mid term positions in it.
www.tradingsignalreviews.com

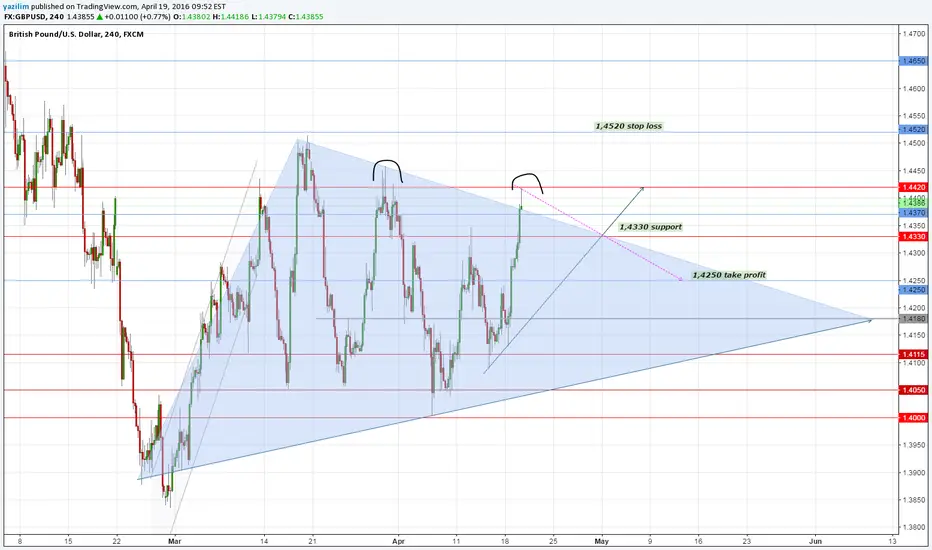
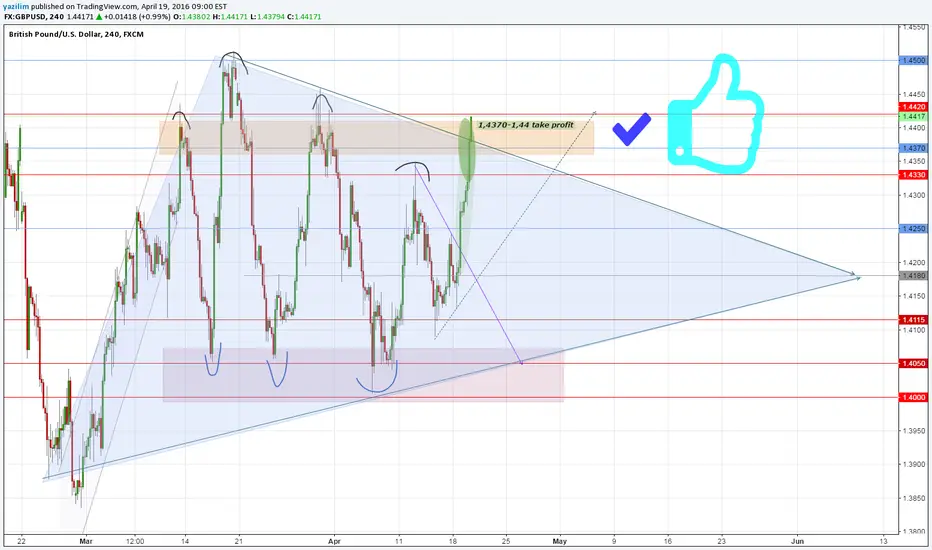
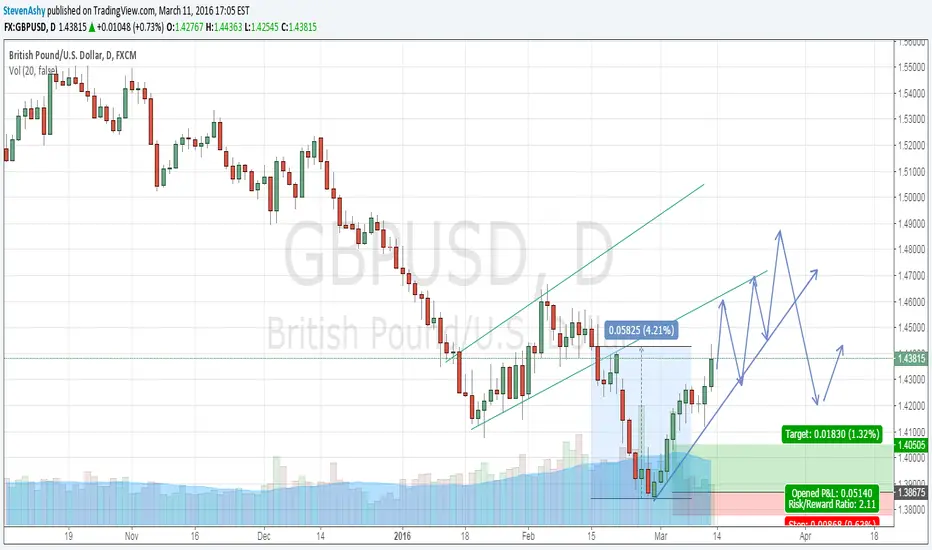
GBPUSD going to Long BUYin my technical view GBPUSD going to UP,
because GBPUSD have 2 Supports. also have Gartley pattren.. with Bullish Channel
Technical Analysis Idea GBP/USD - 04/02/2016The British Pound retains a strong upward tone after of the BOE's economic policy statement, trading a handful of pips above the fresh 4-week high posted last Wednesday, and pressuring the 50% retracement of the latest daily decline between 1.5239 and 1.4078.
Carney says the Bank of England expects real incomes in the UK to grow solidly this year, after several lean years.
And business investment should also continue to grow strongly.
Retracements are now seen as buying opportunities, with short term supports at 1.4605 and 1.4560 ahead of the critical one at 1.4530. This last should keep the downside contained in order to maintain the bullish potential.
www.tradingsignalreviews.com

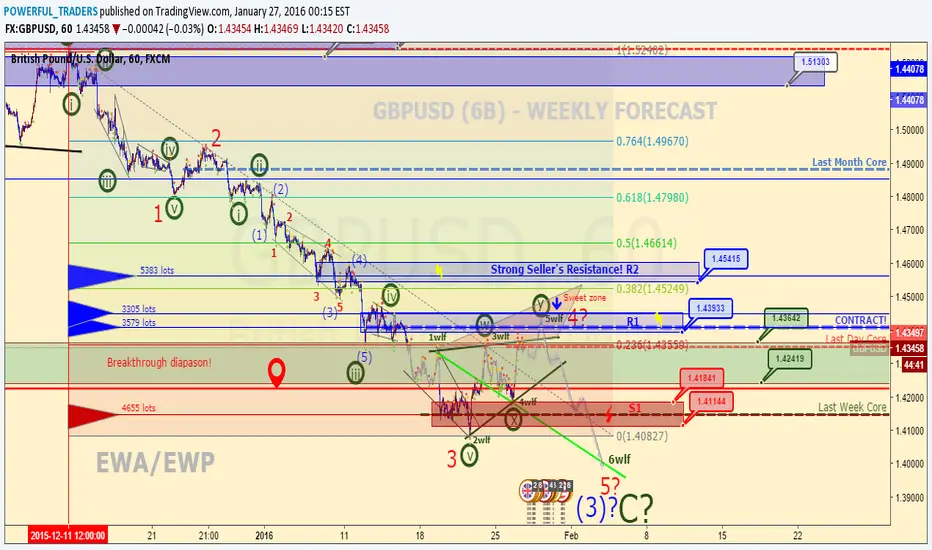
GBPUSD (6B) - WEEKLY FORECAST!Hello Traders!
Binary EWA/EWP! Anyway, short! Target - 1.39400
Sincerely yours, Powerful Traders.
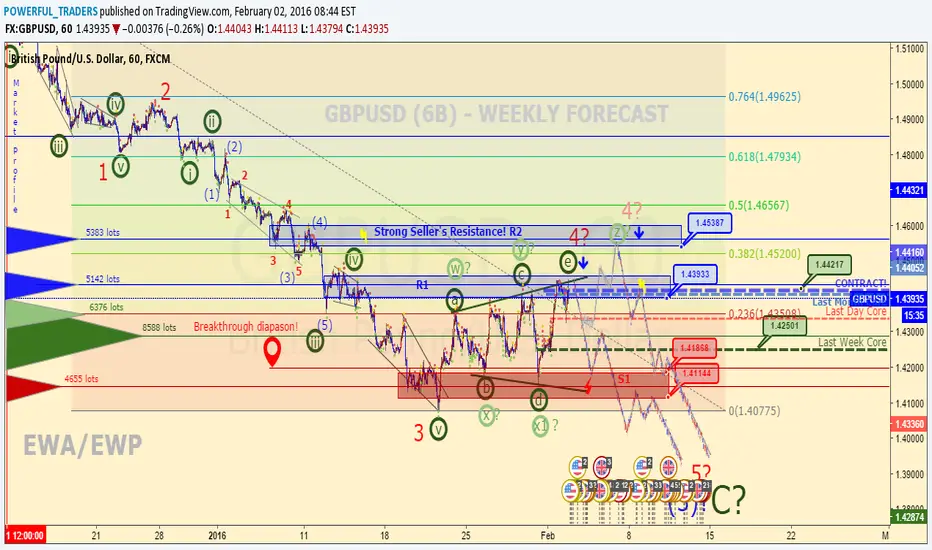
GBPUSD (6B) - WEEKLY FORECASTHello Traders!
Sell Limit - 1.44049, S/L - 1.46000, T/P - 1.44000
Best regards, Powerful Traders!