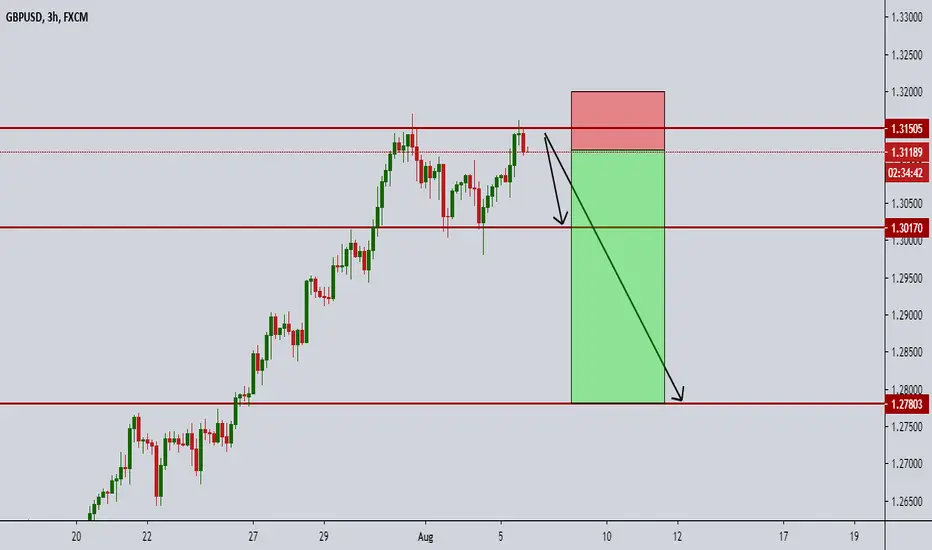
GBPUSD READY TO DROP AGAIN TO NEW LOWS !!!as we see brexit talks in move and pound is in a big selling pressure with no deal
and against pound if we see $ DXY it is moving to upward and looking for more up moves
so we are selling this pair with a low risk and higher rewards friend we appreciate ur
likes and Comments if you like our idea follow us for more updates
Gbpusdprediction
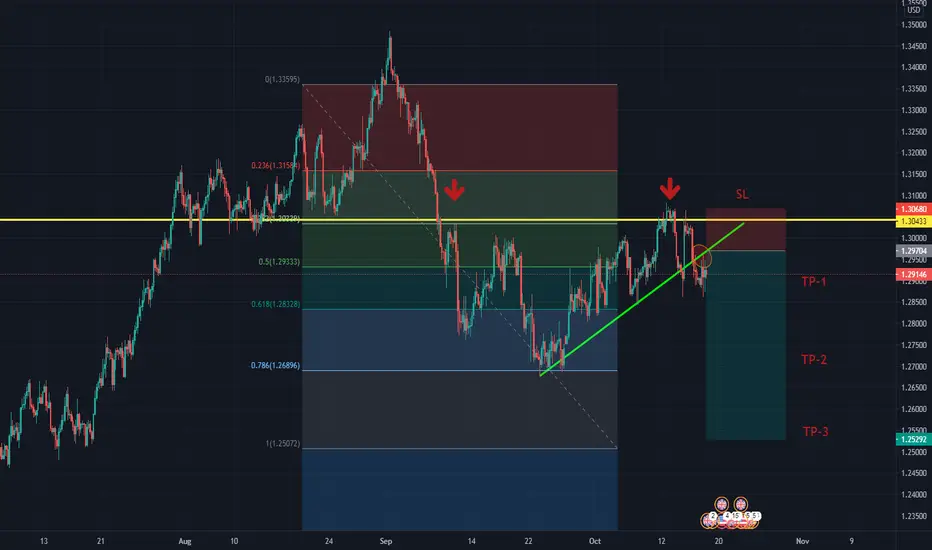
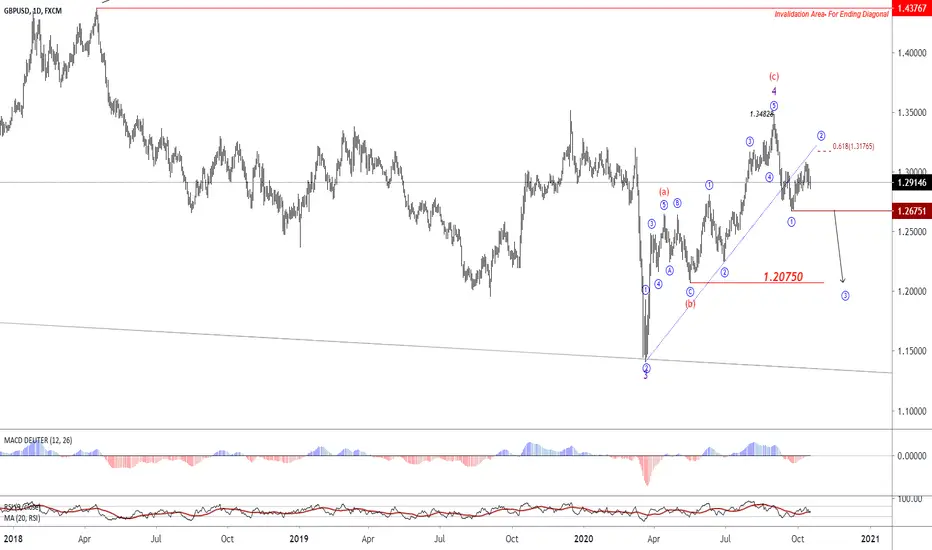
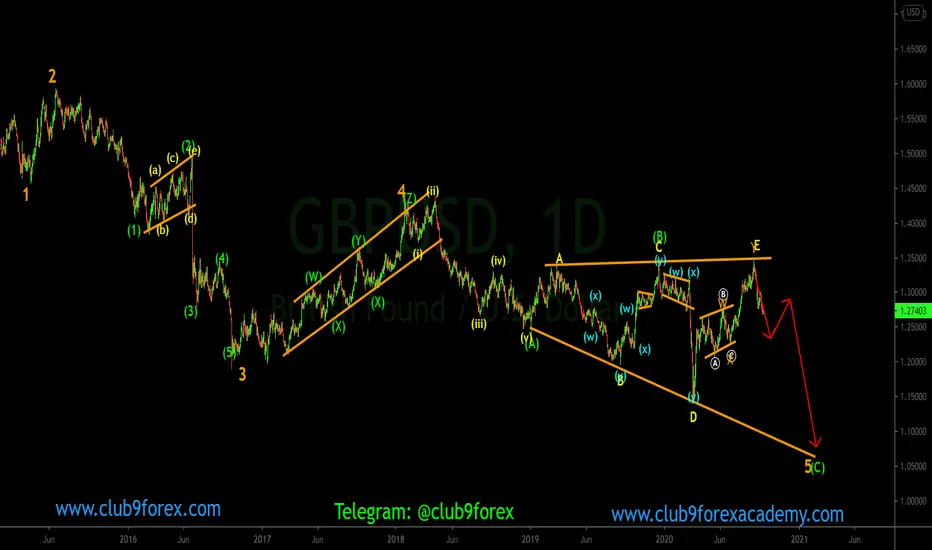
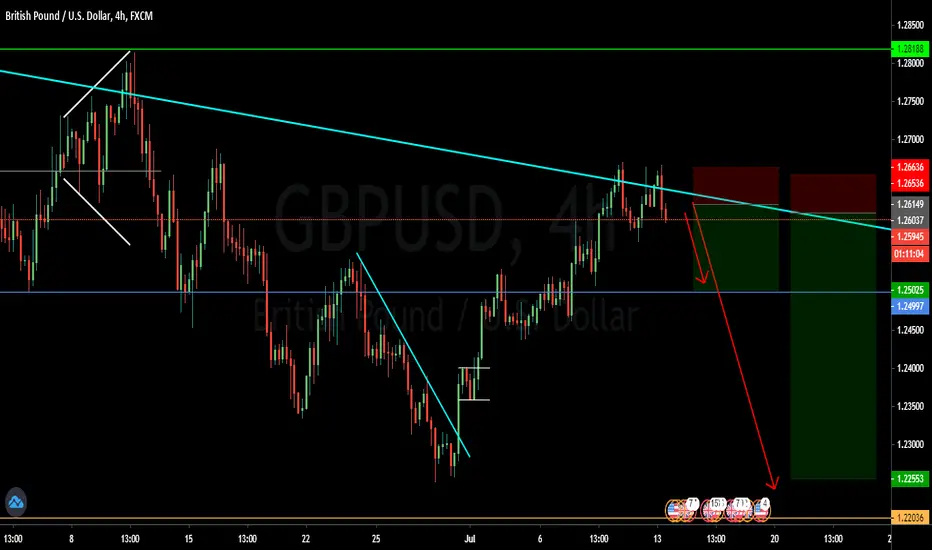
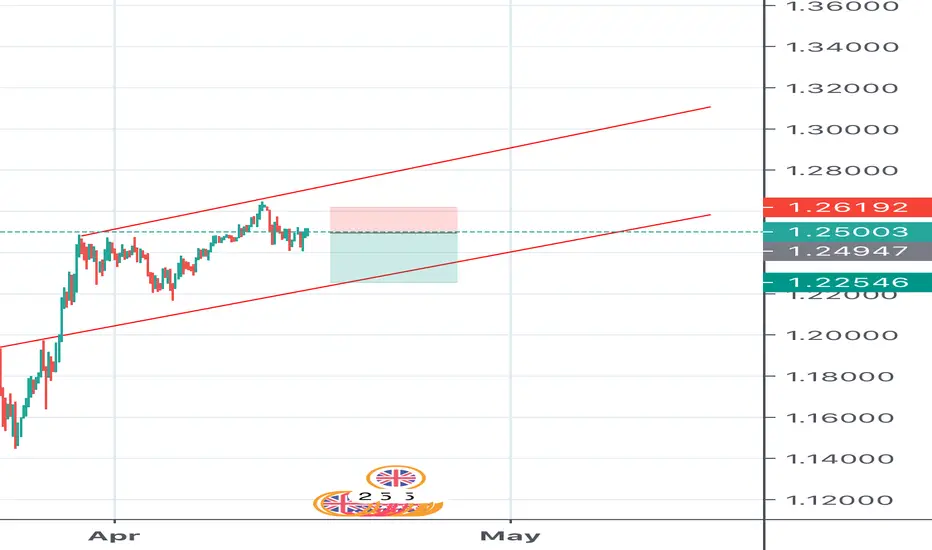
DownTrendThe first the downtrend has ended in the range of 1.2675 and the price has entered the corrective phase of this downtrend, which can be extended up to the targets of 1.3176. (Wave 2)
we must keep in mind that wave 2 can be ended in the range of 1.3082, in which the down the trend has started in 3rd wave, by crossing the price from the range of 1.2675, can continue to the range of 1.2075 as the first target.
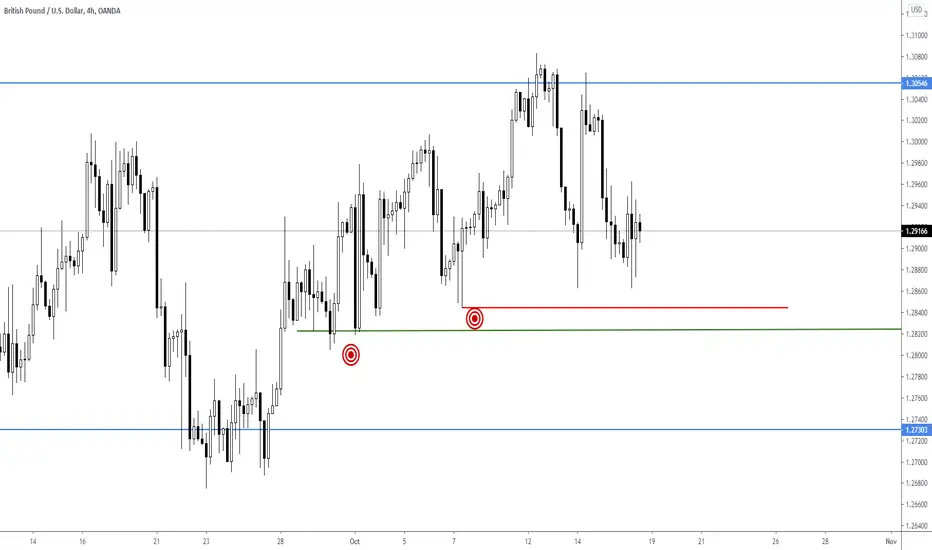
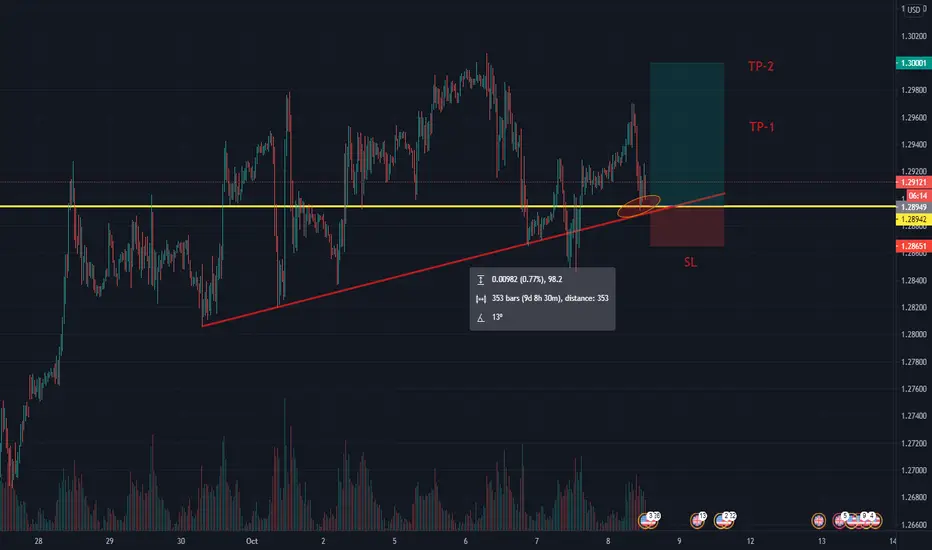
GBPUSD - Lower Prices Seem to be Coming. Hello and welcome back. If you found this idea helpful, please leave a like. GBPUSD looks like it wants to go lower. I see lower prices at least in the beginning of the week. My first objective would be 1.2845 and if we were to go lower, then the green and blue lines would be the next targets. Come the middle of the week, I will post an update. Depending on how prices reacts at the lower levels will determine my future bias. For now in the short-term, lower prices.
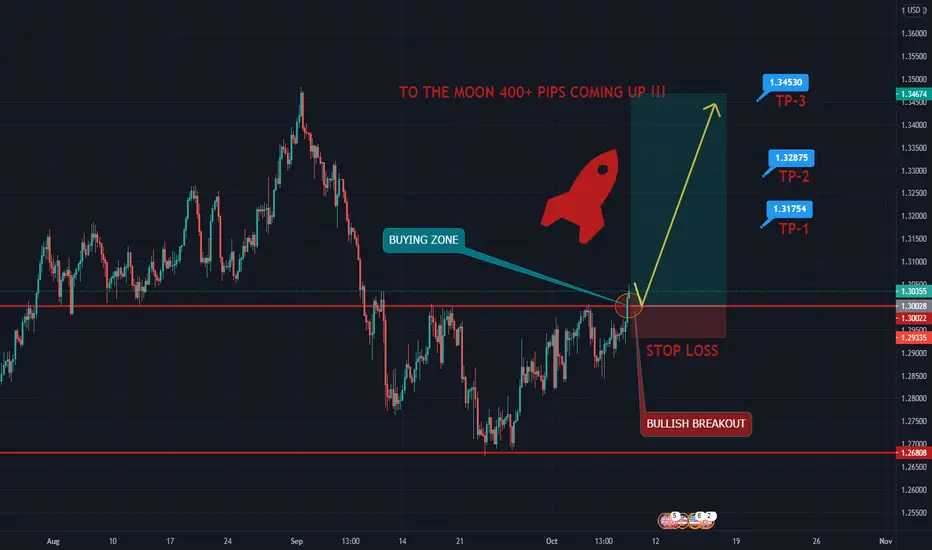
GBPUSD BUYING ON DIPS 400+ PIPS IN 4H TF !!!GBUUSD fundamentally + technically looks bullish for more 400+ pips
It take time but now if it continue closing Daily above this broken zone it will be give us a huge gain on this pair
as we see $ shows more bearish trend again all major pairs and Brexit talk still not fully done we expect Pound will
move accordingly to design levels
push like it will be a great thanks & follow for more updates
GBPUSD BUYING ON DIPS !!!GBPUSD buying from trend line as we saw jobless claims also show bad data
so on smaller TF we enter to buying this pair foe minim 70- 80 pips
join the train and push like for keep supporting us
follow us for more updated trades notification
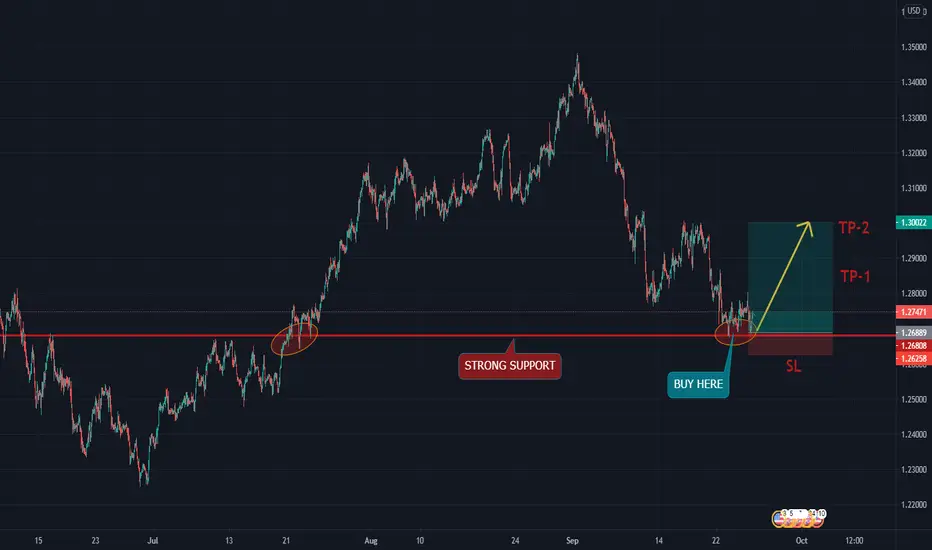
GBPUSD READY FOR BUY IN DIPS !!!! As we see it has reached at strong horizontal support area so we buying this pair with a small risk and higher rewards
GBP/USD sell on H31.1370 is a resistance area. multiple rejections. over bought in RSI. on weekly respecting 200 EMA.
GBPUSD Strong Buy To 1.25215| 28th April 2020|From the last week, I jotted down in my trading diary.
Expecting the bullish on GBPUSD is about to happen starting last week itself. I am spamming long on GBPUSD last week and profitable.
GBPUSD losing the grip on bear trader after the power has been change clearly by last week move. Bear trader already exhausted to spam shorting.
This week, the gain will about to set and I will open the long position and hold it for once whole week.
Expecting the price with hit my expectation key on 1.25215 level.
Good luck,
Cheers~
Regards,
Zezu Zaza
2048
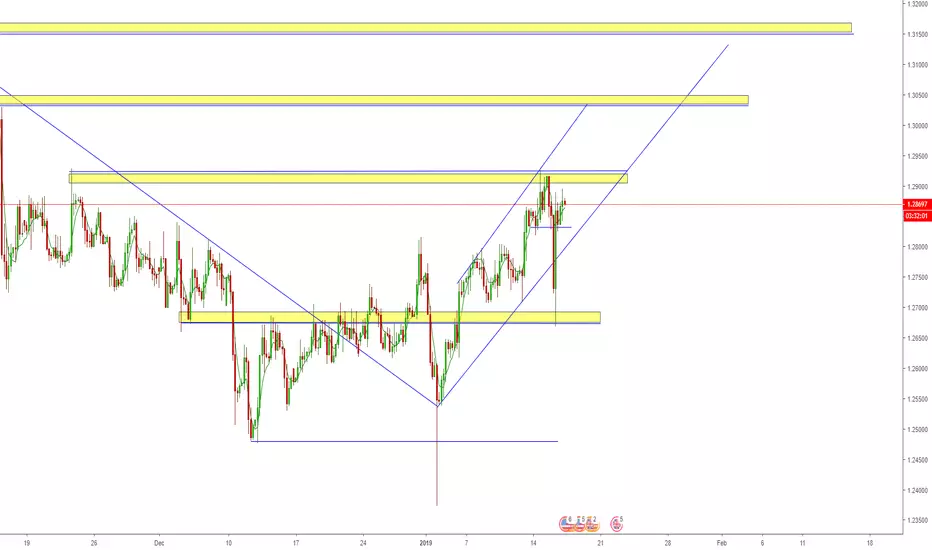
GbpUsd predictionWe can see a channel in my previous post i told to take a short position which is now playing on our side now the flow up of previous analysis we can close your sell position and wait for long position as the market reaches the support of the ascending triangle and tp and sl are shown in the chart.
If you like my analysis do like and comment below whether you agree or disagree from my analysis and do follow me. As I regularly post the prediction on all major forex currency pairs,gold,bitcoin,and stocks like Tesla
Note this is not a trading advice and I am wrong 100%
Gbp/Usd predictionAccording to my analysis the market can go down to the support and then bounce back to test the resistance.
Do like and comment whether you agree you disagree with my idea
Note this is not the trading advice and I am 100% wrong
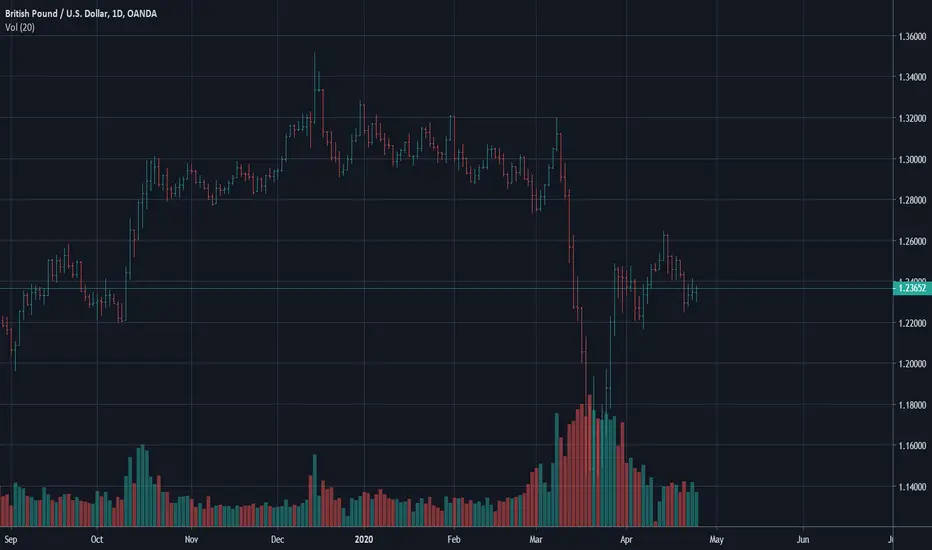
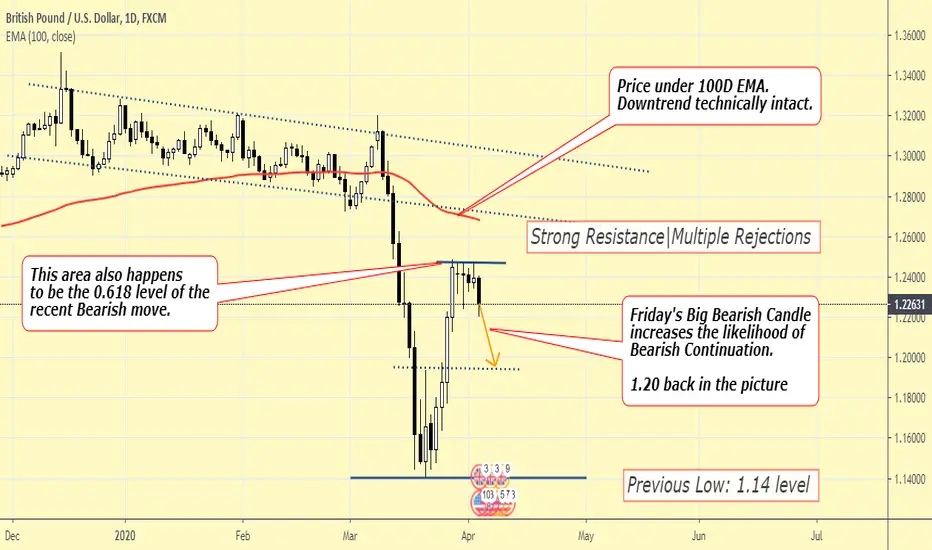
Friday's Bearish Daily candle shows GBPUSD might drop below 1.20GBPUSD seems to have reversed from the 1.2470 area. There were multiple rejections at this level on the daily chart and the bulls couldn't breach this level.
Currently, the price has dropped below the all-important 100 hour EMA, which is a short-term indicator of the trend.
So, we are back to the Bearish Territory.
As per my analysis, GBPUSD might continue to drop till 1.1950 and even more.
So, my trading plan is to sell GBPUSD@1.2280-1.2350 with SL above 1.2470 and TP at 1.1950.
Disclaimer: This is just my personal trading plan and not a signal of any kind.
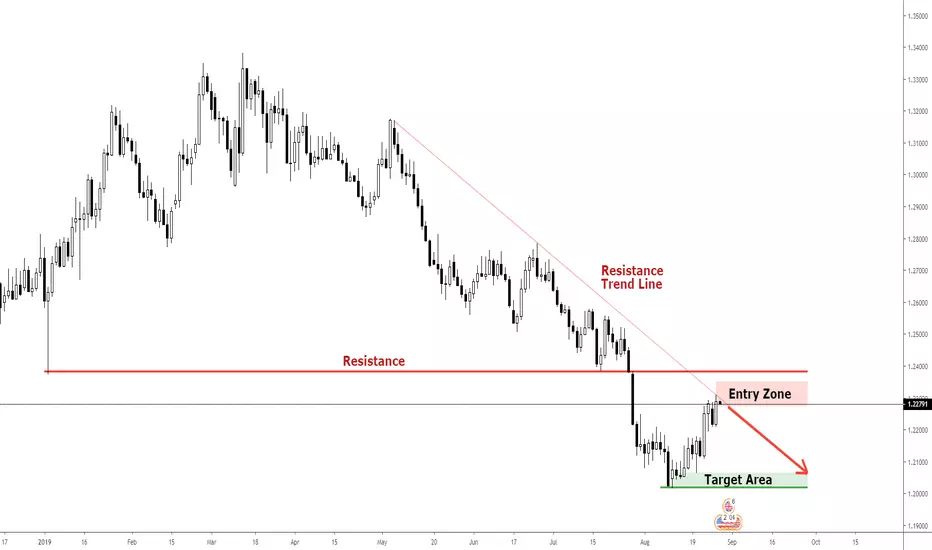
Short the GBPUSD RallyBrexit is still causing uncertainty, and this first test of the resistance trend line on the daily chart provides a good opportunity to sell the GBPUSD.
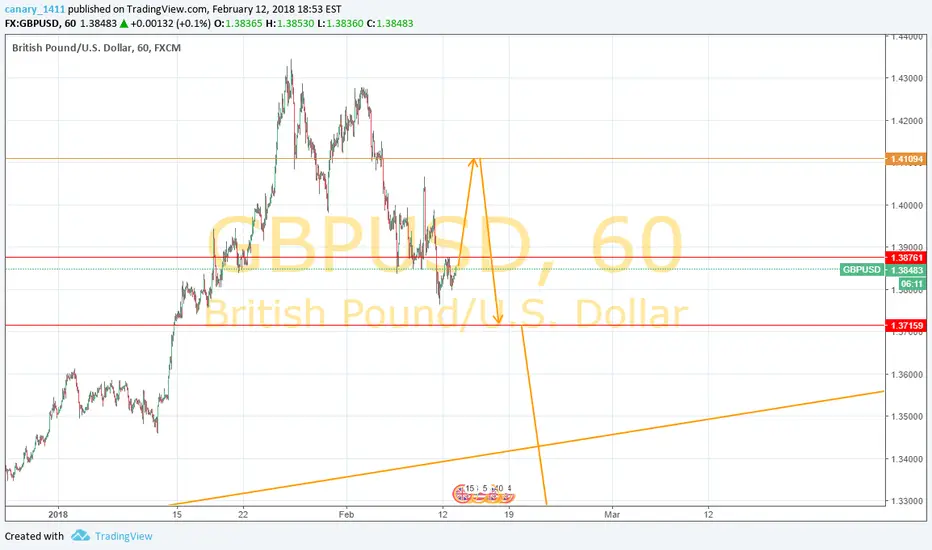
GBPUSD Possible LongSo, as many of you are aware that yesterday didn't go to plan for Theresa May, and many did assume that the GBPUSD was going to sink to the ground - which it did but didn't.
I have done some analysis on the GBPUSD going long with a Target @ 1.32000.
Let me know your thoughts, happy trading! :) GL
GBP/USD is so close to key place where we can open....GBP/USD is moving to key place for open Short
If take a look on chart, you could see that price have powerful downtrend. As you know most of the times trend is continue, it is safer to look for deals for Short near key levels. On chart, I see that price bounced several times from 1.3460, that mean, that level is interesting for big players.
For US is the best to Look for Short position near 1.3460
S/L: 1.3510
1T/P: 1.3210
2T/P: 1.3060

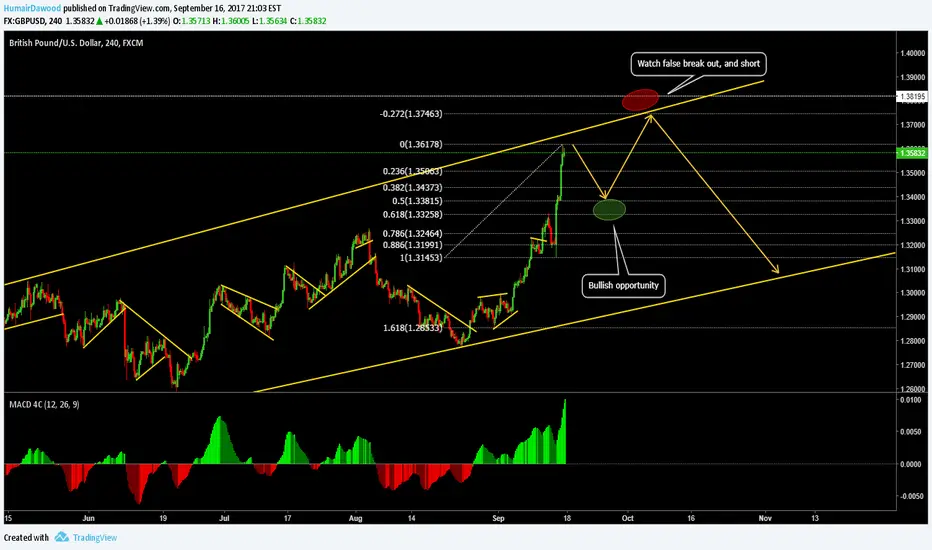
GBPUSD - Possible short and long Opp.- BoE expected to hike rates, and bullish trend may continue till next week or so.
- 2 Possible trades
- Buy at .50 or .618
- Sell from top, however watch out for false break out and let's see if price shows a lot of bearish evidence.
Trade with care
Good luck!
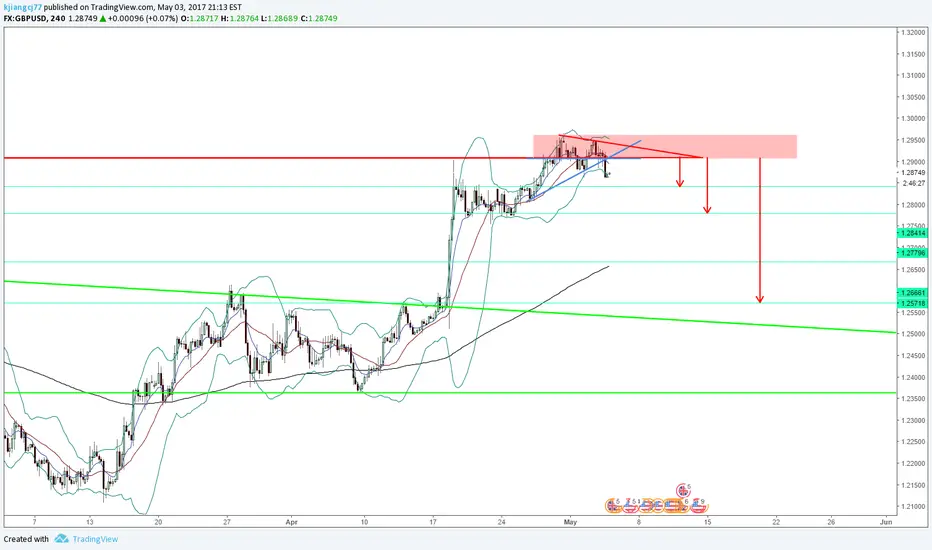
GBPUSD ForecastEnter short ONLY if test of minor trend line and reversal candlestick formation.
1HR targets: 1.28414 1.27796
Daily target: 1.25718
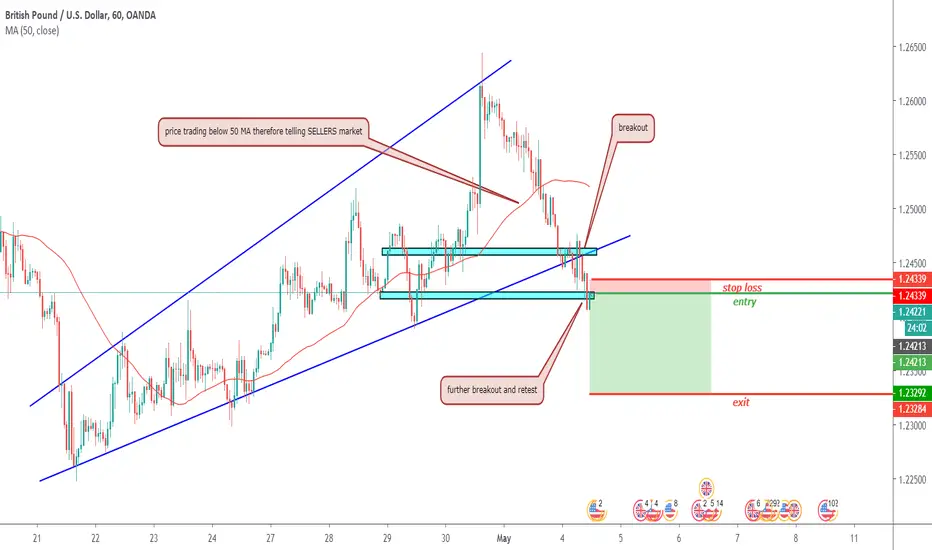
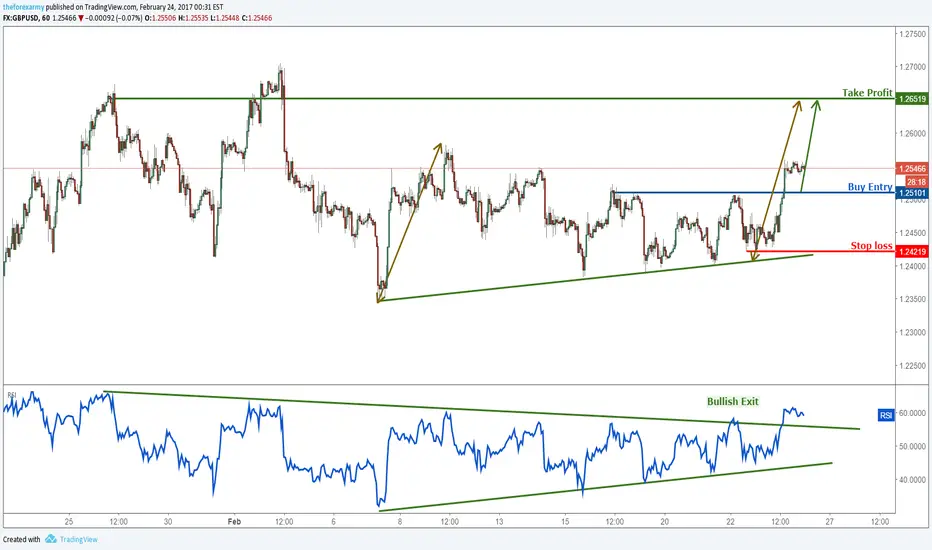
GBPUSD profit target reached once again, remain bullishBuy above 1.2510. Stop loss at 1.2421. Take profit at 1.2651.
Reason for the trading strategy (technically):
Price has shot up and reached our profit target perfectly as expected. We now remain bullish above 1.2510 support (Fibonacci retracement, horizontal pullback support) for a further push up to 1.2651 resistance (major Fibonacci extension).
RSI (34) has made a nice bullish exit signalling that a further rise in price is expected.
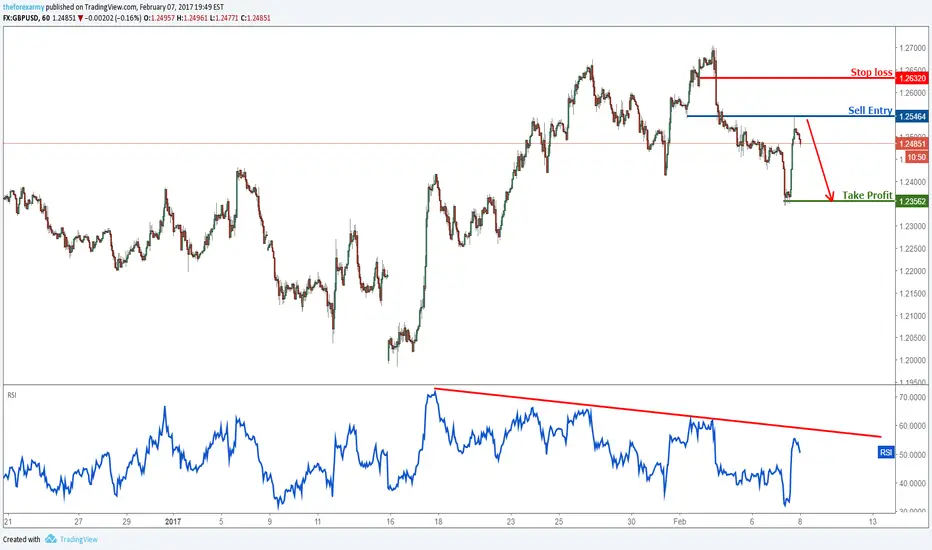
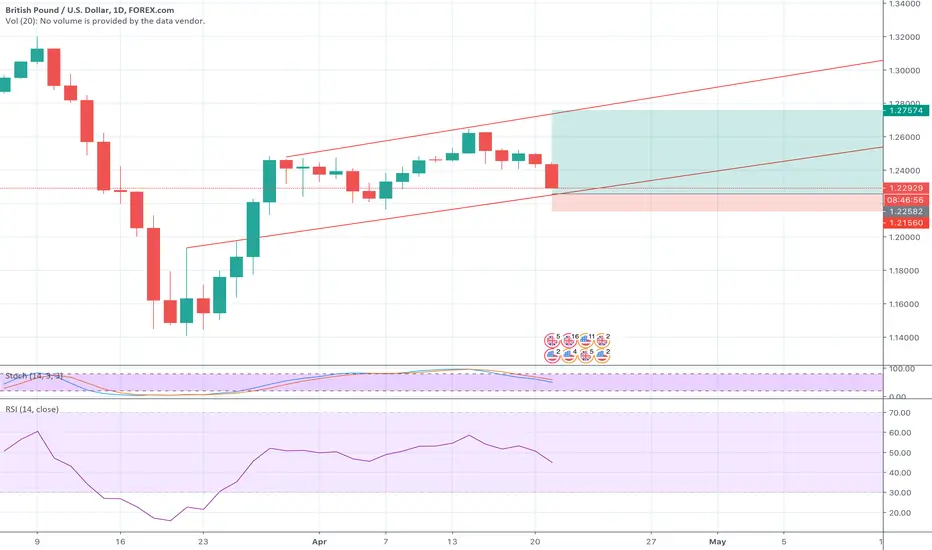
GBPUSD right on resistance again, remain bearishSell below 1.2546. Stop loss at 1.2632. Take profit at 1.2356.
Reason for the trading strategy (technically):
We remain bearish below 1.2546 resistance (Fibonacci retracement, horizontal overlap resistance) for a further push down to 1.2356 support (Fibonacci retracement, Fibonacci projection, swing low support) especially with price making a bearish exit.
RSI (34) sees a descending resistance line holding price down really well.
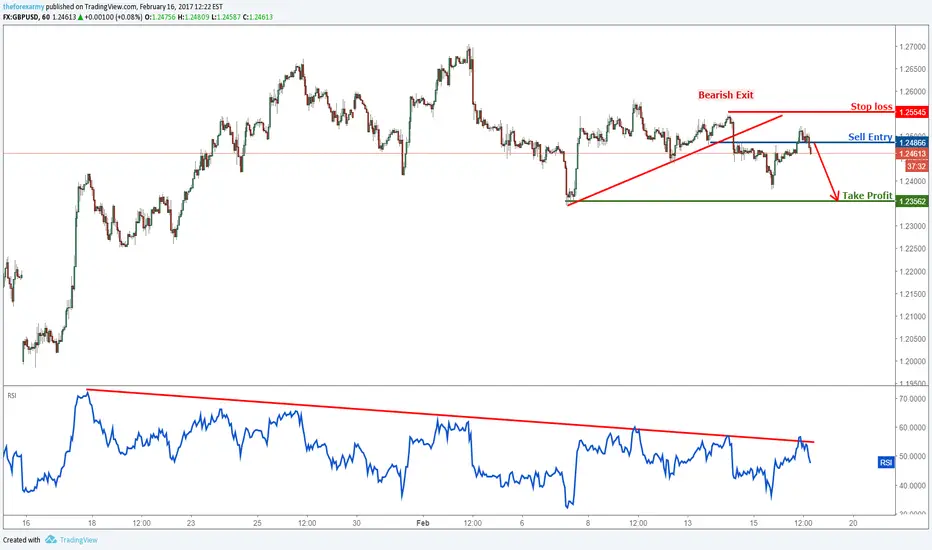
GBPUSD reached profit target, turn bearishSell below 1.2546. Stop loss at 1.2632. Take profit at 1.2356.
Reason for the trading strategy (technically):
Price has bounced and reached our profit target from yesterday. We turn bearish below 1.2546 resistance (Fibonacci retracement horizontal overlap resistance) for a push down to 1.2356 support (Fibonacci retracement, Fibonacci projection, swing low support).
RSI (34) is seeing strong descending resistance holding price down.