Market Trap Alert! GBP/USD Bearish Robbery Plan🔥💸 "The Cable Heist" – GBP/USD Robbery Plan Using Thief Trading Style 💸🔥
— Unfiltered Forex Forecast with Risky Intentions —
🌍 Hey Money-Makers, Market Hustlers & Chart Bandits! 🤑✈️
Hola! Bonjour! Marhaba! Hallo! Ciao! Welcome to the Forex streets where the smart rob the charts, not banks.
Ready for the GBP/USD Heist? Let’s break it down with our infamous Thief Trading Style – raw, unapologetic, and built for profits.
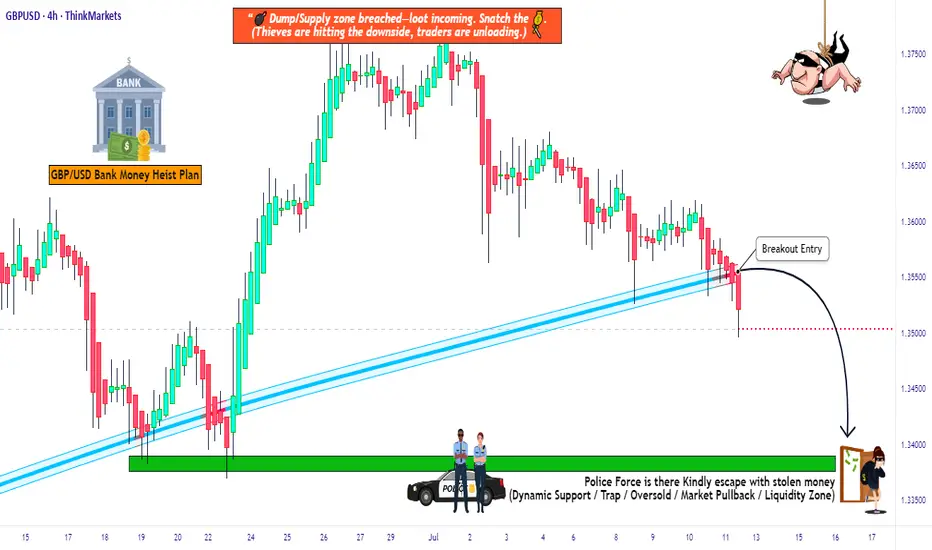
💼 Operation Name: “The Cable Forex Bank Robbery”
🎯 Pair: GBP/USD – aka “The Cable”
⚔️ Style: Scalp / Day Trade / Swing Heist
📊 Bias: Short (Bearish Setup)
🛠 STRATEGY SETUP: "Follow the Shadows"
🔍 Analysis Basis:
Smart-Money Traps at Key Levels
Oversold ≠ Reversal (Read between the candles)
Liquidity Hunting Zones
Retail Stop Clusters Exposed
Thief-style DCA Entries (Staggered Entry Levels)
Multi-timeframe Confirmation
COT, Sentiment & News-Driven Volatility
🎯 ENTRY ZONE:
Enter short (sell) using 15M or 30M chart.
Sell Limits near recent highs (pullback zone).
DCA (Layered Entry) recommended – Thief loves catching price slipping.
Let the liquidity work for us.
🛑 STOP LOSS (SL):
Base SL around 1.34000 on 4H Chart – above swing high.
Adjust SL per position size and total entries.
Manage risk, but remember: thieves don’t panic, they plan!
🎯 TARGET ZONE:
TP near 1.31000 or adjust using price action.
Escape before target if market mood flips – no need to be greedy.
Trail SLs if market momentum dies down.
👀 Scalpers' Special Note:
Only SHORT — don’t mess with long side unless you’re a liquidity donor.
Quick ins & outs. If you're loaded with capital, jump in big – else follow the swing team.
Use trailing SLs for safety — protect the loot.
📢 FUNDAMENTALS TO WATCH:
News Impacting GBP/USD
COT Reports
Sentiment Indicators
Macro Trends / Yield Spreads
US Dollar Strength Index (DXY)
UK Economic Reports (CPI, GDP, Rate Decisions)
⚠️ RISK MANAGEMENT TIPS:
🚨 Avoid new entries during news releases
🚨 Use trailing stops during volatility spikes
🚨 Secure running trades before major announcements
🚀 Boost the Robbery – Support the Strategy
💖 Smash that BOOST BUTTON if you're vibing with this setup. Help the Thief crew grow stronger!
Let’s keep milking the market 💸 – one “heist” at a time. Stay dangerous, stay smart.
🔓 NOTE: This isn't investment advice. Just a wild trading idea from a chart outlaw.
Always DYOR – Do Your Own Robbery (Research).
Market conditions shift fast. Stay alert, adapt, and respect your capital.
#ForexThiefStyle #CableHeist #GBPUSDShort #SmartMoneyMoves #LiquidityHunters #ChartOutlaws #TradingRebels #DayTradeLife #ScalpersParadise #ForexGang #FXHeistPlans
Gbpusdsetup
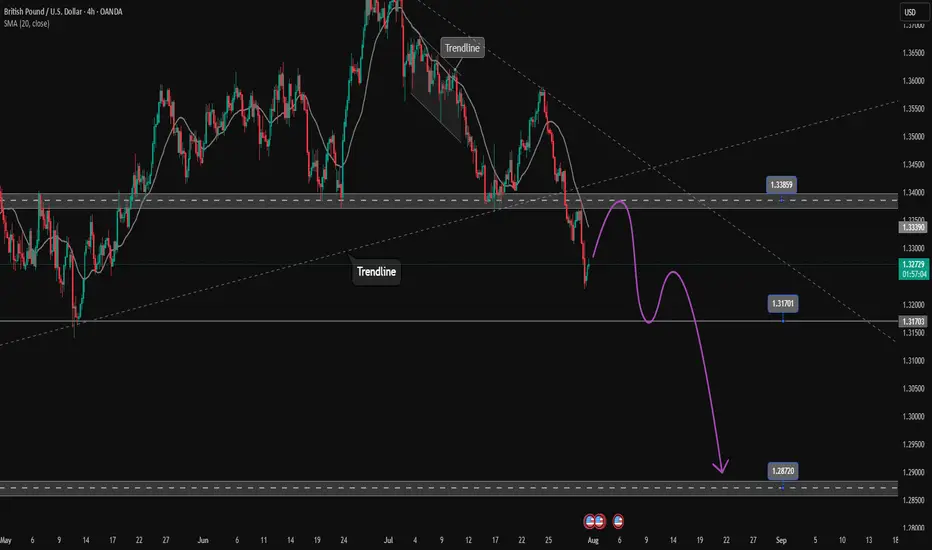
GBPUSD extends to the downside. Wait for retest to sell✏️ OANDA:GBPUSD confirms the downtrend by breaking the trendline. The downtrend is still extending to lower areas because the GBPUSD bearish wave structure is very beautiful. Some selling momentum appears around the breakout zone of 1.339, which will form a bearish structure towards the support of 1.287 in the near future. Putting faith in the trendline at the moment is reliable.
📉 Key Levels
SELL zone 1.339-1.341
SELL DCA trigger: Break and trading bellow 1.317
Target 1.287
Leave your comments on the idea. I am happy to read your views.
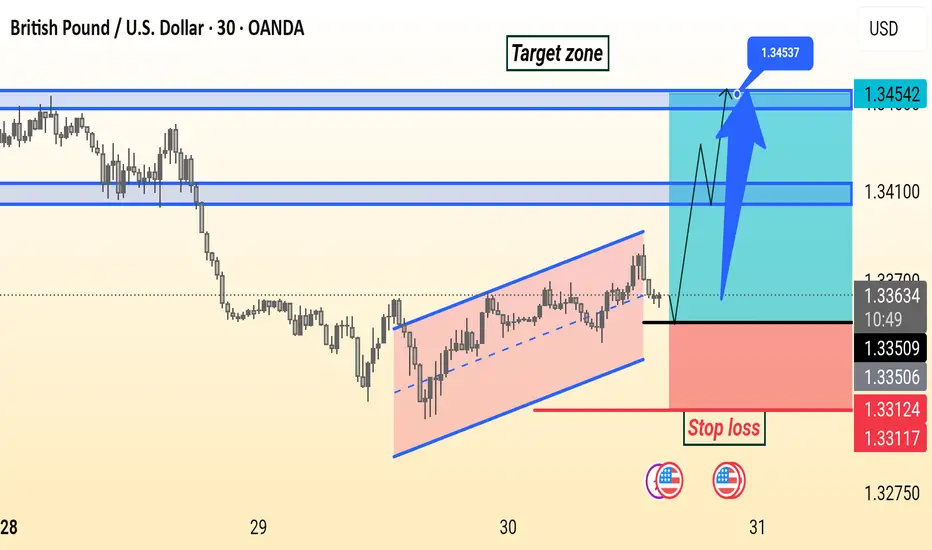
GBPUSD Setup GBP/USD is forming a bullish channel on the 30-minute chart. Price is expected to break above resistance near 1.3365, targeting the 1.3455 zone. Stop loss is set below the channel at 1.3312.
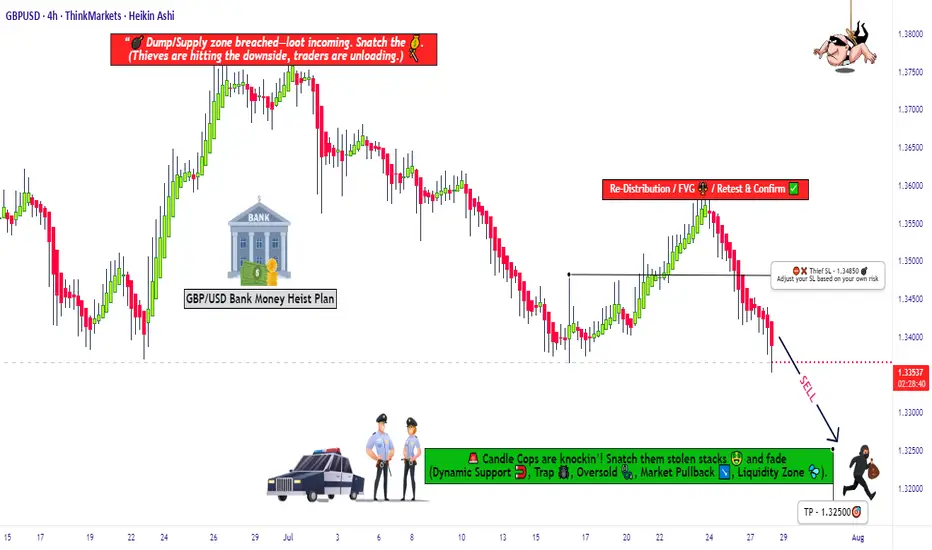
Market Trap Alert! GBP/USD Bearish Robbery Plan🔥💸 "The Cable Heist" – GBP/USD Robbery Plan Using Thief Trading Style 💸🔥
— Unfiltered Forex Forecast with Risky Intentions —
🌍 Hey Money-Makers, Market Hustlers & Chart Bandits! 🤑✈️
Hola! Bonjour! Marhaba! Hallo! Ciao! Welcome to the Forex streets where the smart rob the charts, not banks.
Ready for the GBP/USD Heist? Let’s break it down with our infamous Thief Trading Style – raw, unapologetic, and built for profits.
💼 Operation Name: “The Cable Forex Bank Robbery”
🎯 Pair: GBP/USD – aka “The Cable”
⚔️ Style: Scalp / Day Trade / Swing Heist
📊 Bias: Short (Bearish Setup)
🛠 STRATEGY SETUP: "Follow the Shadows"
🔍 Analysis Basis:
Smart-Money Traps at Key Levels
Oversold ≠ Reversal (Read between the candles)
Liquidity Hunting Zones
Retail Stop Clusters Exposed
Thief-style DCA Entries (Staggered Entry Levels)
Multi-timeframe Confirmation
COT, Sentiment & News-Driven Volatility
🎯 ENTRY ZONE:
Enter short (sell) using 15M or 30M chart.
Sell Limits near recent highs (pullback zone).
DCA (Layered Entry) recommended – Thief loves catching price slipping.
Let the liquidity work for us.
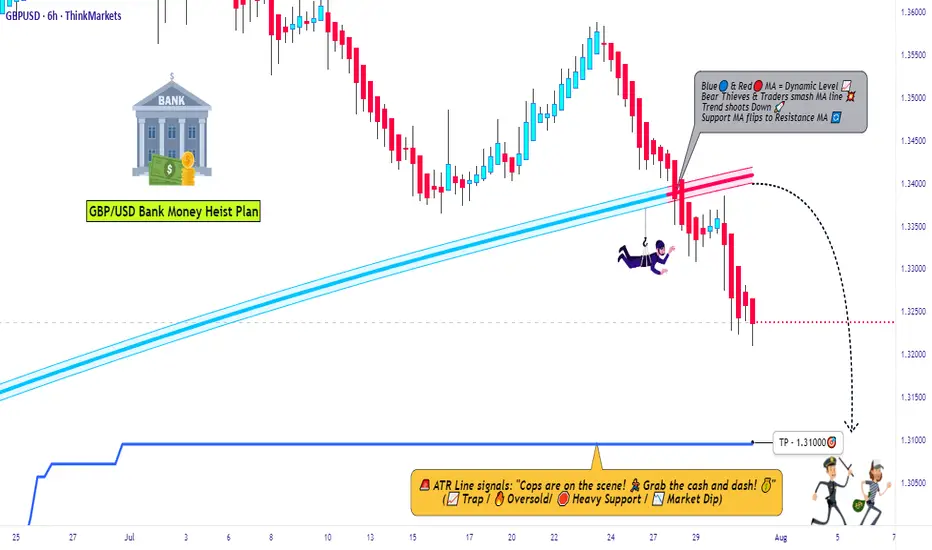
🛑 STOP LOSS (SL):
Base SL around 1.34850 on 4H Chart – above swing high.
Adjust SL per position size and total entries.
Manage risk, but remember: thieves don’t panic, they plan!
🎯 TARGET ZONE:
TP near 1.32500 or adjust using price action.
Escape before target if market mood flips – no need to be greedy.
Trail SLs if market momentum dies down.
👀 Scalpers' Special Note:
Only SHORT — don’t mess with long side unless you’re a liquidity donor.
Quick ins & outs. If you're loaded with capital, jump in big – else follow the swing team.
Use trailing SLs for safety — protect the loot.
📢 FUNDAMENTALS TO WATCH:
News Impacting GBP/USD
COT Reports
Sentiment Indicators
Macro Trends / Yield Spreads
US Dollar Strength Index (DXY)
UK Economic Reports (CPI, GDP, Rate Decisions)
⚠️ RISK MANAGEMENT TIPS:
🚨 Avoid new entries during news releases
🚨 Use trailing stops during volatility spikes
🚨 Secure running trades before major announcements
🚀 Boost the Robbery – Support the Strategy
💖 Smash that BOOST BUTTON if you're vibing with this setup. Help the Thief crew grow stronger!
Let’s keep milking the market 💸 – one “heist” at a time. Stay dangerous, stay smart.
🔓 NOTE: This isn't investment advice. Just a wild trading idea from a chart outlaw.
Always DYOR – Do Your Own Robbery (Research).
Market conditions shift fast. Stay alert, adapt, and respect your capital.
#ForexThiefStyle #CableHeist #GBPUSDShort #SmartMoneyMoves #LiquidityHunters #ChartOutlaws #TradingRebels #DayTradeLife #ScalpersParadise #ForexGang #FXHeistPlans
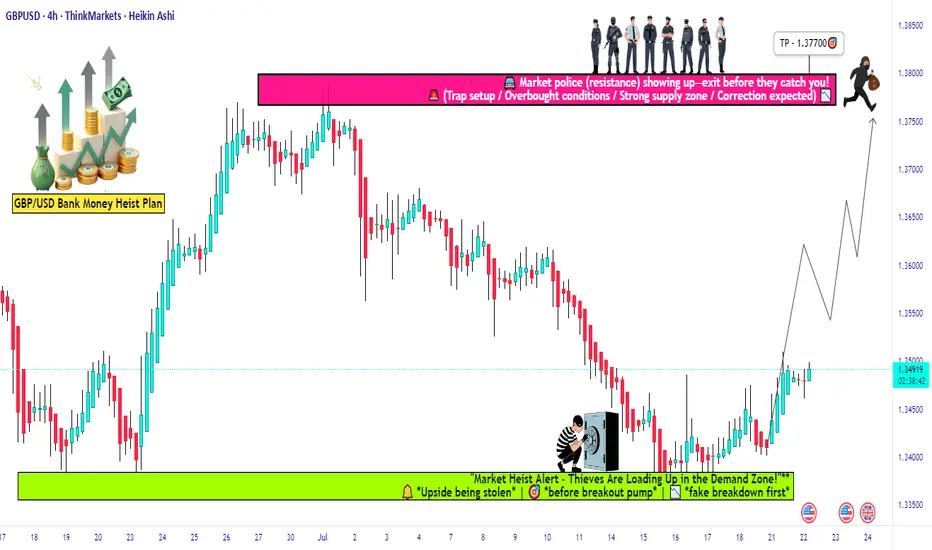
GBP/USD Long Setup: Loot & Escape Before Bears Attack!🏴☠️ GBP/USD HEIST ALERT: "The Cable" Bank Robbery Plan! 💰🚨
Thief Trading Strategy | Swing/Day Trade | High-Risk, High-Reward Loot!
🤑 DEAR MARKET PIRATES & MONEY SNATCHERS!
Based on our 🔥Thief Trading Masterplan🔥, we’re targeting the GBP/USD ("The Cable") for a bullish heist! Police barricades (resistance) are risky, but overbought markets = consolidation = TREND REVERSAL TRAP! Bears are strong here, but smart robbers take profits early!
🎯 Mission: LONG ENTRY + ESCAPE BEFORE THE POLICE (SELLERS) ARRIVE!
🔓 ENTRY: "VAULT IS OPEN!"
📍 Bullish Loot Zone: Swipe longs at any price—but smart thieves use Buy Limits near 15M/30M swing lows for pullback entries!
📍 Pro Thief Move: DCA/Layering strategy (multiple limit orders for max loot).
🛑 STOP LOSS: "DON’T GET CAUGHT!"
📍 SL @ Recent Swing Low (4H): 1.33700 (Adjust based on your risk, lot size, & entry layers!).
📍 Day/Swing Trade? Tighten SL if scalping!
🎯 TARGETS: "LOOT & BOUNCE!"
✅ 1.37700 (Main Heist Target)
✅ Scalpers: Trail SL & escape early!
✅ Swing Bandits: Hold for bigger payout!
📢 THIEF’S FUNDAMENTAL INTEL
Why GBP/USD? Bullish momentum from:
Macro Trends (COT Report, Sentiment, Liquidity Zones)
Intermarket Signals (Stocks, Bonds, Commodities)
News Trap Alerts (Avoid high-impact news chaos!)
🚨 THIEF’S GOLDEN RULES
✔ AVOID NEWS VOLATILITY! (No new trades during releases)
✔ TRAILING SL = SAFE ESCAPE ROUTE! (Lock profits like a pro)
✔ BOOST THIS IDEA! 💥 More boosts = stronger heist crew!
💎 FINAL WARNING
This is a HIGH-RISK heist! Only risk what you can lose.
Market conditions change FAST! Adapt or get caught.
Not advice—just a pirate’s plan! Do your own analysis.
🚀 NEXT HEIST COMING SOON… STAY TUNED, ROBBERS! 🏴☠️💸
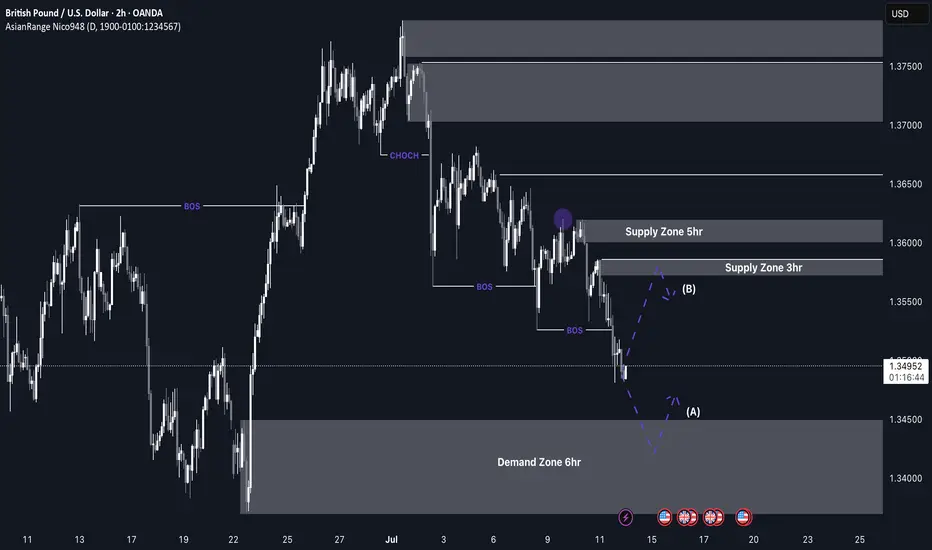
GBP/USD Longs to Shorts GU has been very bearish recently and is currently reacting from a clean demand zone with multiple confluences. While we may see a short-term push to the upside, I’ll be watching to see if price reaches the 3hr supply zone sitting at a premium level.
If price does reach that zone, I’ll be on the lookout for signs of Wyckoff distribution and a slowdown in momentum, which could signal the start of another bearish leg.
Confluences for GU Shorts:
Overall bearish trend remains intact — this is a pro-trend setup
Price may retrace to mitigate a 3hr supply zone
Liquidity to the downside still needs to be taken
Current demand zone may simply serve as a trigger for a retracement up to supply
P.S. If price fails to reach the supply zone and continues dropping, we’ll likely see a new break of structure and the formation of a fresh nearby supply zone, which we can then trade from.
Let’s stay sharp and have a profitable trading week ahead! 🔥📊💰
GBPUSD BUY IDEAWe will be looking into taking the buys as per the chart. I hope this is an idea that resonates with you. Happy trading days

GBPUSD(20250725)Today's AnalysisMarket news:
The European Central Bank announced that it would maintain the three key interest rates unchanged, reiterated data dependence, warned that the external environment is highly uncertain, and President Lagarde did not rule out the possibility of future rate hikes. Traders reduced their bets on ECB rate cuts.
Technical analysis:
Today's buying and selling boundaries:
1.3532
Support and resistance levels:
1.3618
1.3586
1.3565
1.3499
1.3479
1.3447
Trading strategy:
If the price breaks through 1.3532, consider buying, with the first target price at 1.3565
If the price breaks through 1.3499, consider selling, with the first target price at 1.3479
Short Opportunity on GBPUSD – Technical & Fundamentals AlignToday I want to look at the Short position opportunity in GBPUSD ( FX:GBPUSD ). So let's take a look at the GBPUSD pair from a fundamental and technical perspective.
Fundamental Analysis:
The British Pound remains under pressure due to growing expectations of a 25–50 bps rate cut by the Bank of England in early August. Markets are increasingly leaning toward easing as UK inflation hit 3.6% in June, the highest in over a year, while economic growth weakened and consumer confidence dropped to its lowest since early 2024
Ongoing fiscal concerns, including potential tax hikes and budget instability, continue to weigh on the pound. In contrast, the US Dollar( TVC:DXY ) remains relatively robust—supported by strong economic data and a safe-haven preference amid global uncertainty
Summary:
BoE easing becomes more likely due to weak UK data and inflation.
Fiscal risks and low consumer sentiment add downward pressure on GBP.
USD strength from solid data and safe-haven demand supports further GBPUSD downside.
-------------------------
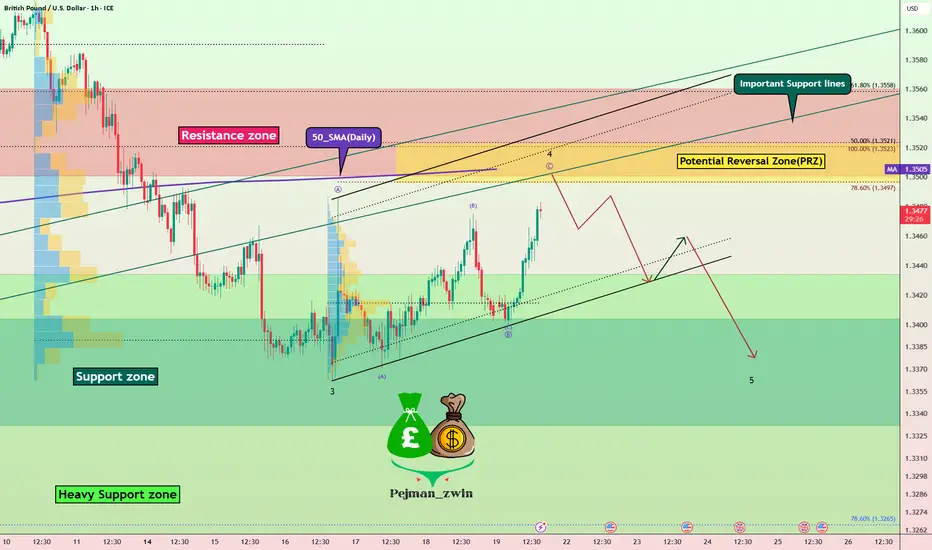
In terms of technical analysis , in the 1-hour timeframe , GBPUSD is approaching the Resistance zone($1.356-$1.350) , the Potential Reversal Zone(PRZ) , and the 50_SMA(Daily) . Meanwhile, this return to Important Support lines could act as a pullback to these lines. Important support lines and 50_SMA(Daily) were broken last week.
In terms of Elliott Wave theory , GBPUSD appears to be completing a main wave 4 . Main wave 4 is likely to have a Zigzag Correction(ABC/5-3-5) .
I expect GBPUSD to start declining from the Potential Reversal Zone(PRZ) and reach the targets I have marked on the chart.
Note: Stop Loss(SL): 1.3575USD = Worst Stop Loss(SL)
Please respect each other's ideas and express them politely if you agree or disagree.
British Pound / U.S Dollar Analysis (GBPUSD), 1-hour time frame.
Be sure to follow the updated ideas.
Do not forget to put a Stop loss for your positions (For every position you want to open).
Please follow your strategy and updates; this is just my Idea, and I will gladly see your ideas in this post.
Please do not forget the ✅' like '✅ button 🙏😊 & Share it with your friends; thanks, and Trade safe.
GBPUSD - Looking To Sell Pullbacks In The Short TermH4 - Strong bearish move.
No opposite signs.
Currently it looks like a pullback is happening.
Expecting bearish continuation until the two Fibonacci resistance zones hold.
If you enjoy this idea, don’t forget to LIKE 👍, FOLLOW ✅, SHARE 🙌, and COMMENT ✍! Drop your thoughts and charts below to keep the discussion going. Your support helps keep this content free and reach more people! 🚀
--------------------------------------------------------------------------------------------------------------------

Market Analysis: GBP/USD Dips FurtherMarket Analysis: GBP/USD Dips Further
GBP/USD started a downside correction from the 1.3620 zone.
Important Takeaways for GBP/USD Analysis Today
- The British Pound started a fresh decline and settled below the 1.3500 zone.
- There is a connecting bullish trend line forming with support at 1.3415 on the hourly chart of GBP/USD at FXOpen.
GBP/USD Technical Analysis
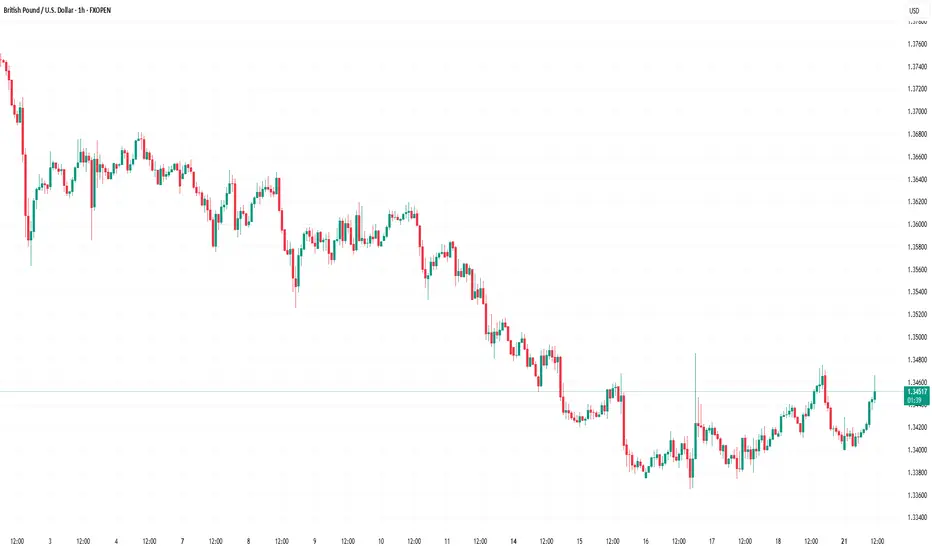
On the hourly chart of GBP/USD at FXOpen, the pair struggled above the 1.3600 zone. The British Pound started a fresh decline below the 1.3550 pivot level against the US Dollar, as discussed in the previous analysis.
The pair dipped below the 1.3500 and 1.3450 levels. A low was formed at 1.3364 and the pair is now consolidating losses. On the upside, it is facing resistance near the 1.3475 level. The next key resistance is near 1.3490 and the 50% Fib retracement level of the downward move from the 1.3619 swing high to the 1.3364 low.
An upside break above the 1.3490 zone could send the pair toward 1.3520 and the 61.8% Fib retracement level.
More gains might open the doors for a test of 1.3620. If there is another decline, the pair could find support near the 1.3415 level and a connecting bullish trend line. The first major support sits near the 1.3365 zone.
The next major support is 1.3350. If there is a break below 1.3350, the pair could extend the decline. The next key support is near the 1.3320 level. Any more losses might call for a test of 1.3250.
This article represents the opinion of the Companies operating under the FXOpen brand only. It is not to be construed as an offer, solicitation, or recommendation with respect to products and services provided by the Companies operating under the FXOpen brand, nor is it to be considered financial advice.
GBPUSD – Levels, Adjustments, and Scenario PlanningAs mentioned in our pinned analysis, we had two levels on GBPUSD —
✅ Both of them were broken.
📉 After the break of the first level, we shorted the pullback and took a great profit.
📍 Now after the second level has also broken, I’ve adjusted the level slightly —
There’s a chance price retraces to 1.35774 before continuing its drop.
🟢 Below, there’s a solid buy zone.
🔁 My Updated Scenarios:
✅ If price pulls back to the short level before hitting the buy zone → I’ll take the short.
⚠️ But if price touches the buy zone first, then any short afterward will just be partial or used for pyramiding — not a major trade.
Let’s stay patient and let the market tell us what to do.
📌 All previous scenarios are still valid.

GBP/USD Rate Falls to Key Support LevelGBP/USD Rate Falls to Key Support Level
As of today, the GBP/USD chart indicates that the British pound has declined by more than 2% against the US dollar since the beginning of July. Notably, the pace of the decline accelerated on Friday and continued into Monday.
According to Reuters, the pound is under pressure due to market concerns over a potential economic slowdown amid an escalating trade war. Last week’s data confirmed a contraction in UK GDP, which could have far-reaching implications. In this context, criticism of the UK government’s failure to reduce public spending is becoming more pronounced.
What’s next for GBP/USD?
Technical Analysis of the GBP/USD Chart
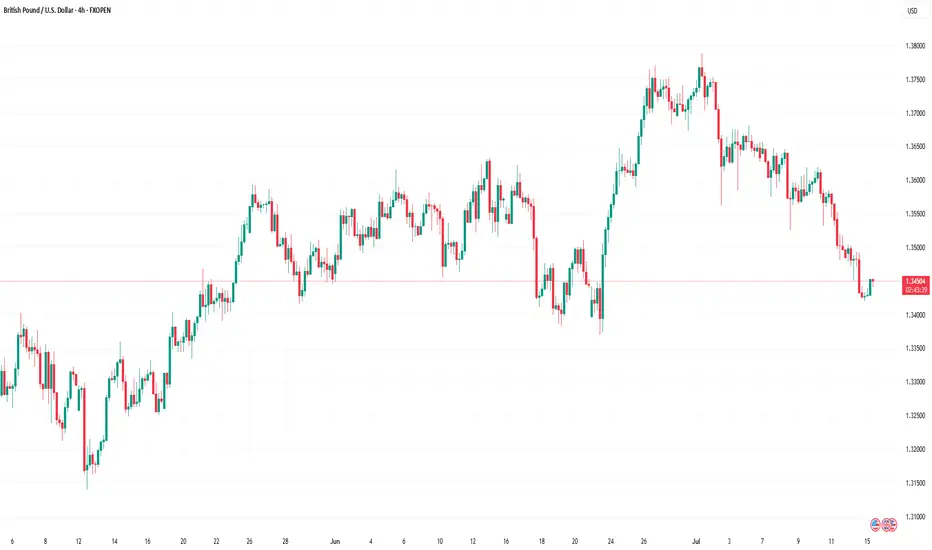
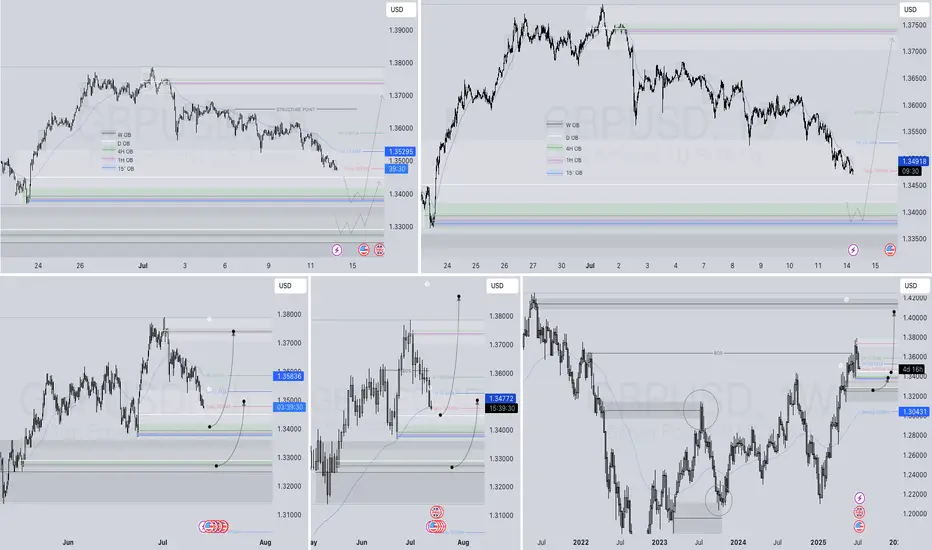
From a bullish perspective, it is worth noting that the pair has fallen to a significant support level around 1.3425. This level previously acted as resistance in the spring, but after a breakout, it has now turned into support (as indicated by arrows on the chart). Additionally, the RSI indicator shows strong oversold conditions, which suggests a potential short-term rebound.
From a bearish standpoint, it is concerning that the sharp rally from point A to point B has been entirely erased by the July decline. This indicates that despite significant gains by the bulls, they failed to hold them—casting doubt on GBP/USD's ability to sustain growth in the medium term.
Ongoing pressure may lead to an attempt by bears to push GBP/USD below the June low at point A. However, it is also possible that bearish momentum will weaken thereafter, potentially leading to a recovery within the developing downward channel (marked in red).
This article represents the opinion of the Companies operating under the FXOpen brand only. It is not to be construed as an offer, solicitation, or recommendation with respect to products and services provided by the Companies operating under the FXOpen brand, nor is it to be considered financial advice.
GBPUSD: Two Strong Bullish Area To Buy From ?GU is currently in a bullish trend when examined on a daily time frame. There are two potential areas for purchase. The first area is currently active, as we anticipate a price reversal from this point. There is a significant possibility that price could decline to the second area and subsequently reverse from there directly. The sole reason we believe price could drop to the second area is if the US Dollar experiences corrections, which could cause GU to drop to our second area and subsequently rebound.
If you appreciate our analysis, we kindly request that you consider the following actions:
-Liking the Ideas
-Commenting on the Ideas
-Sharing the Ideas
We extend our sincere gratitude for your continuous support. We trust that our insights have provided even a modicum of assistance.
Team Setupsfx_
❤️🚀
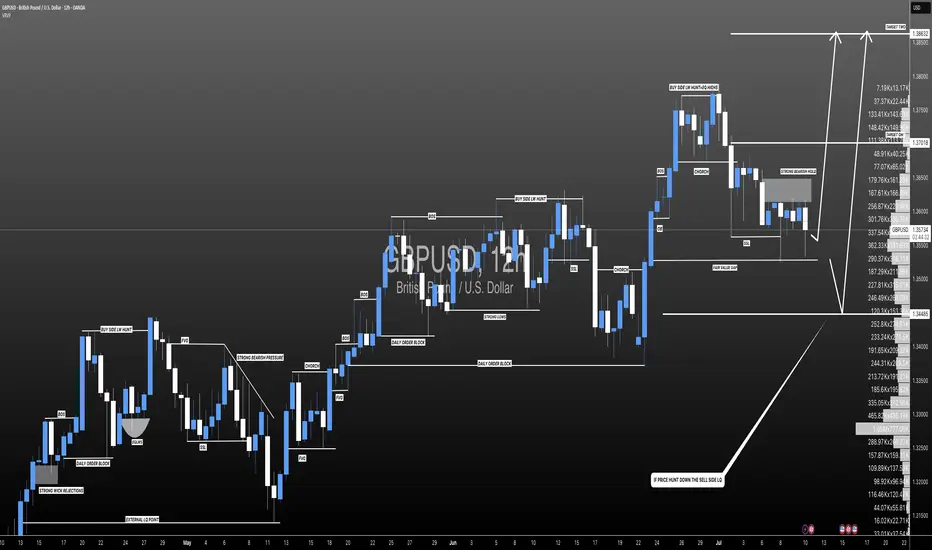
GBPUSD LONG FORECAST Q3 D14 W29 Y25GBPUSD LONG FORECAST Q3 D14 W29 Y25
Welcome back to the watchlist GBPUSD ! Let's go long ! Alignment across all time frames.
Professional Risk Managers👋
Welcome back to another FRGNT chart update📈
Diving into some Forex setups using predominantly higher time frame order blocks alongside confirmation breaks of structure.
Let’s see what price action is telling us today!
💡Here are some trade confluences📝
✅Daily order block
✅1H Order block
✅Intraday breaks of structure
✅4H Order block
📈 Risk Management Principles
🔑 Core Execution Rules
Max 1% risk per trade
Set alerts — let price come to your levels
Minimum 1:2 RR
Focus on process, not outcomes
🧠 Remember, the strategy works — you just need to let it play out.
🧠 FRGNT Insight of the Day
"The market rewards structure and patience — not emotion or urgency."
Execute like a robot. Manage risk like a pro. Let the chart do the talking.
🏁 Final Words from FRGNT
📌 GBPUSD is offering textbook alignment — structure, order flow, and confirmation all check out.
Let’s approach the trade with clarity, conviction, and risk-managed execution.
🔑 Remember, to participate in trading comes always with a degree of risk, therefore as professional risk managers it remains vital that we stick to our risk management plan as well as our trading strategies.
📈The rest, we leave to the balance of probabilities.
💡Fail to plan. Plan to fail.
🏆It has always been that simple.
❤️Good luck with your trading journey, I shall see you at the very top.
🎯Trade consistent, FRGNT X
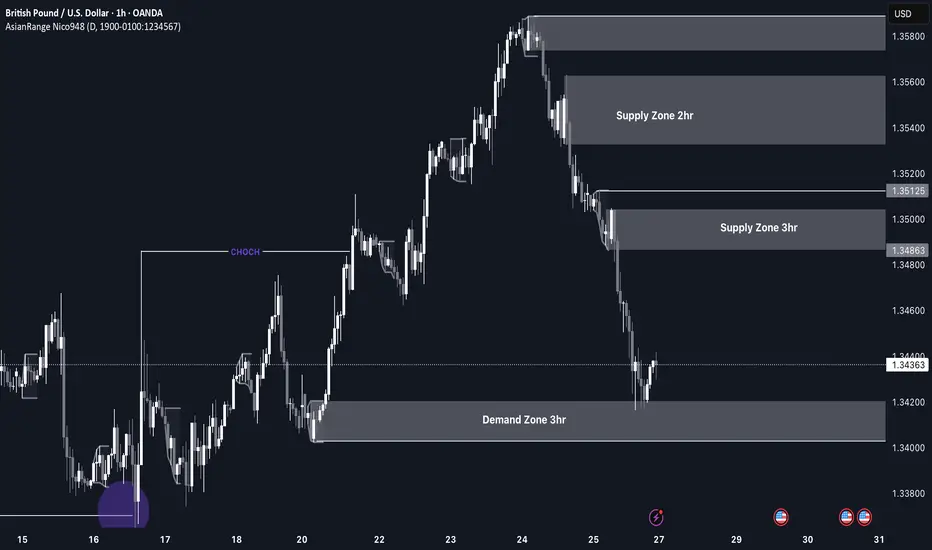
GBP/USD Shorts from 3hr/5hr supply zoneMy analysis this week centers around the continuation of the bearish trend we've been observing. Recently, there was a break of structure, and a new supply zone has formed—indicating a potential continuation of the downtrend.
I’ll be waiting for price to retrace back into these Points of Interest (POIs), where I’ll look for lower time frame confirmations to catch potential sell entries and ride the move down.
I believe there’s still some bearish pressure left, and I expect price to continue falling until it reaches the 6-hour demand zone. Once we approach that area, I’ll begin looking for Wyckoff accumulation patterns as a signal for a potential reversal or rally to the upside.
Confluences for GBP/USD Sells:
✅ GBP/USD has been bearish over the past few weeks, and this trend may continue.
✅ Breaks of structure have occurred, forming fresh supply zones ideal for entries.
✅ Liquidity exists below current price, which may get swept before a reversal.
✅ The lower demand zone still needs to be mitigated, suggesting more downside movement first.
📌 If price fails to react properly at the 3-hour supply, I’ll be watching for a move into the 5-hour supply zone, which sits in a more premium area and may offer a cleaner reaction.
Let’s stay patient and focused — wishing everyone a profitable trading week ahead! 📉💼
GBPUSD LONG TERM GBPUSD Live Trading Session/ GBPUSD analysis #forex #forextraining #forexHello Traders
In This Video GBPUSD HOURLY Forecast By World of Forex
today GBPUSD Analysis
This Video includes_ (GBPUSD market update)
GBPUSD Analysis today | Technical and Order Flow
#usdjpy #usdchftechnicalanalysis #usdjpytoday #gold
What is The Next Opportunity on GBPUSD Market
how to Enter to the Valid Entry With Assurance Profit?
This Video is For Trader's that Want to Improve Their Technical Analysis Skills and Their Trading By Understanding How To Analyze The Market Using Multiple Timeframes and Understanding The Bigger Picture on the Charts.
Disclaimer: Financial Trading Has Large Potential Rewards, But Also Large Potential Risk. You must be aware of the Risk and Be Welling to Accept Them in order to Trade the Financial Market . Please be Carefully With Your Money.
We are talking about future market, anything can Happen,Markets are Always like that.dnt Risky more Than 2% of your account
Now you can join with our "vip premium" service
Join us and let's make trading together

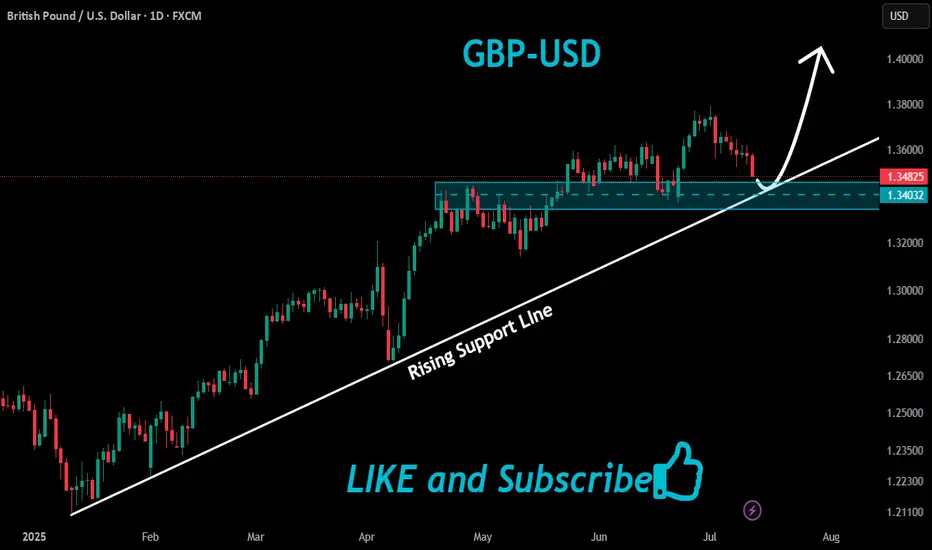
GBPUSD Long From Rising Support !
HI,Traders !
#GBPUSD is trading along
The rising support line
And the pair will soon hit
A trend-line from where we
Will be expecting a local
Bullish rebound and a
Further bullish move up !
Comment and subscribe to help us grow !
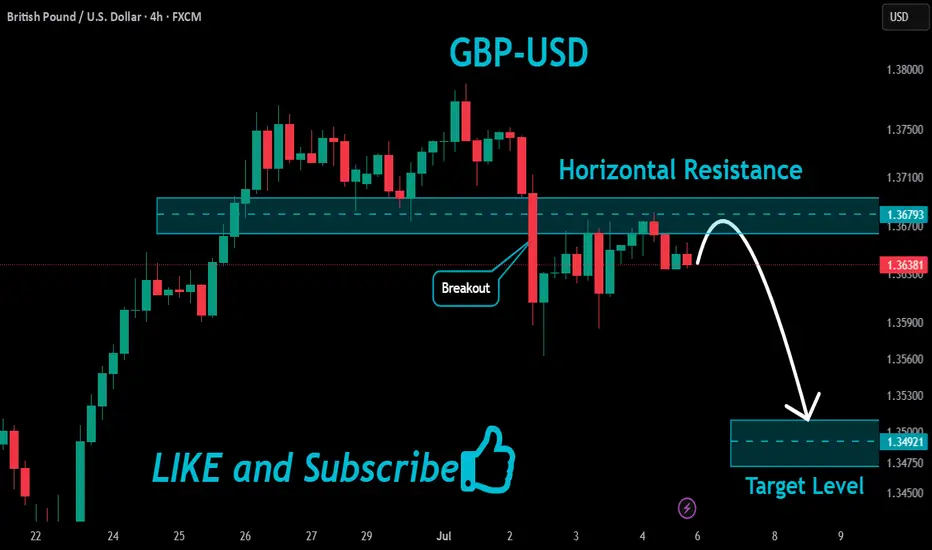
GBPUSD Resistance Ahead!
HI,Traders !
#GBPUSD made a rebound
From the support and went
Up but will now retest a
Local horizontal level
Of 1.36793 from where
We will be expecting
A local bearish reaction !
Comment and subscribe to help us grow !
Market Trap Alert! GBP/USD Bearish Robbery Plan🔥💸 "The Cable Heist" – GBP/USD Robbery Plan Using Thief Trading Style 💸🔥
— Unfiltered Forex Forecast with Risky Intentions —
🌍 Hey Money-Makers, Market Hustlers & Chart Bandits! 🤑✈️
Hola! Bonjour! Marhaba! Hallo! Ciao! Welcome to the Forex streets where the smart rob the charts, not banks.
Ready for the GBP/USD Heist? Let’s break it down with our infamous Thief Trading Style – raw, unapologetic, and built for profits.
💼 Operation Name: “The Cable Forex Bank Robbery”
🎯 Pair: GBP/USD – aka “The Cable”
⚔️ Style: Scalp / Day Trade / Swing Heist
📊 Bias: Short (Bearish Setup)
🛠 STRATEGY SETUP: "Follow the Shadows"
🔍 Analysis Basis:
Smart-Money Traps at Key Levels
Oversold ≠ Reversal (Read between the candles)
Liquidity Hunting Zones
Retail Stop Clusters Exposed
Thief-style DCA Entries (Staggered Entry Levels)
Multi-timeframe Confirmation
COT, Sentiment & News-Driven Volatility
🎯 ENTRY ZONE:
Enter short (sell) using 15M or 30M chart.
Sell Limits near recent highs (pullback zone).
DCA (Layered Entry) recommended – Thief loves catching price slipping.
Let the liquidity work for us.
🛑 STOP LOSS (SL):
Base SL around 1.36200 on 2H Chart – above swing high.
Adjust SL per position size and total entries.
Manage risk, but remember: thieves don’t panic, they plan!
🎯 TARGET ZONE:
TP near 1.33800 or adjust using price action.
Escape before target if market mood flips – no need to be greedy.
Trail SLs if market momentum dies down.
👀 Scalpers' Special Note:
Only SHORT — don’t mess with long side unless you’re a liquidity donor.
Quick ins & outs. If you're loaded with capital, jump in big – else follow the swing team.
Use trailing SLs for safety — protect the loot.
📢 FUNDAMENTALS TO WATCH:
News Impacting GBP/USD
COT Reports
Sentiment Indicators
Macro Trends / Yield Spreads
US Dollar Strength Index (DXY)
UK Economic Reports (CPI, GDP, Rate Decisions)
⚠️ RISK MANAGEMENT TIPS:
🚨 Avoid new entries during news releases
🚨 Use trailing stops during volatility spikes
🚨 Secure running trades before major announcements
🚀 Boost the Robbery – Support the Strategy
💖 Smash that BOOST BUTTON if you're vibing with this setup. Help the Thief crew grow stronger!
Let’s keep milking the market 💸 – one “heist” at a time. Stay dangerous, stay smart.
🔓 NOTE: This isn't investment advice. Just a wild trading idea from a chart outlaw.
Always DYOR – Do Your Own Robbery (Research).
Market conditions shift fast. Stay alert, adapt, and respect your capital.
#ForexThiefStyle #CableHeist #GBPUSDShort #SmartMoneyMoves #LiquidityHunters #ChartOutlaws #TradingRebels #DayTradeLife #ScalpersParadise #ForexGang #FXHeistPlans
GBPUSD📌 GBPUSD – Scenario-Based Plan
The first level I’ve marked is a short-term zone.
If we get a strong buy signal there with good R/R, I’ll enter and trail aggressively.
The second level is a stronger demand zone and a better area for potential long setups.
❗️Remember: These are just scenarios — not predictions.
We stay ready for whatever the market delivers.

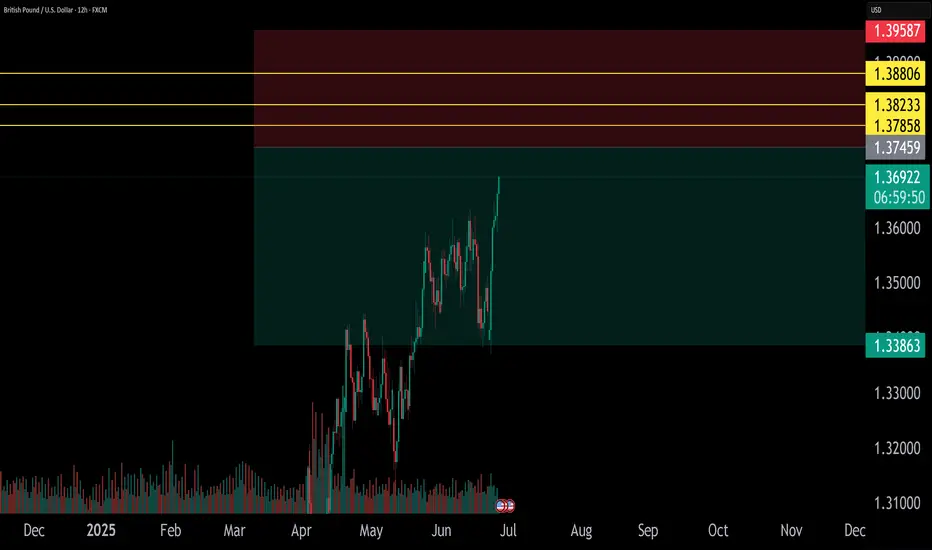
GBP/USD Short Idea Analysis : GBP/USD is approaching a critical resistance zone between 1.37850 and 1.38800 on the daily timeframe, presenting a potential short opportunity based on technical and fundamental factors.
Technical Analysis:
Price Action: The 1.37850–1.38800 zone aligns with prior highs and a strong resistance area, likely to trigger rejection or a bearish reversal pattern (e.g., double top or bearish engulfing).
Support/Target: Initial support at 1.3700, with a deeper target at 1.3600 if bearish momentum builds.
Indicators: RSI is approaching overbought territory (near 70), signaling potential exhaustion. MACD shows slowing bullish momentum, supporting a short bias.
Fibonacci: The 1.37850–1.38800 zone coincides with the 76.4%–88.6% Fibonacci retracement of the prior downmove, reinforcing resistance.
Fundamental Context:
UK economic data (e.g., weaker retail sales or PMI) suggests GBP vulnerability. Meanwhile, USD strength is bolstered by hawkish Fed expectations and resilient US economic indicators.
Risks: A breakout above 1.3900 could invalidate the setup. Monitor BoE rhetoric and US data releases for sudden shifts.
Conclusion: The 1.37850–1.38800 resistance zone offers a high-probability short setup for GBP/USD, supported by technical resistance and USD-favorable fundamentals. Use strict risk management due to potential volatility.
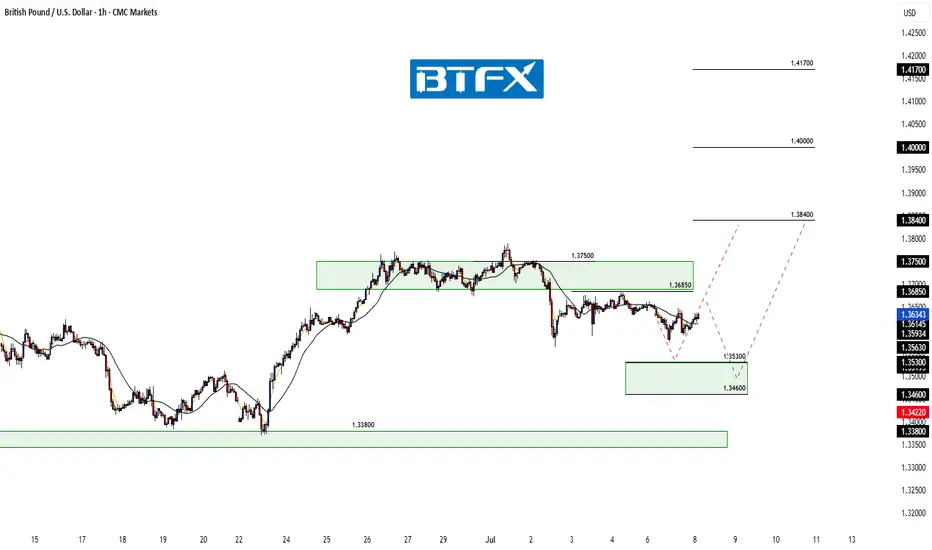
GBP/USD: Short‑Term Pullback Likely Before Fresh Upside AttemptHi everyone,
GBP/USD continues to consolidate below the 1.36850 level. We expect a retest of this level today; should price fail to break above, we anticipate a move lower to find buying interest between the 1.35300 and 1.34600 zones. A drop into this area appears to be the more probable short‑term path and could set the stage for another push higher.
As previously noted, a decisive break above 1.37500 would renew our expectation for further upside, with the next key target around 1.38400. We'll be monitoring price action closely to see how it unfolds.
We’ll continue to provide updates on the projected path for GBP/USD as price approaches this target.
The longer-term outlook remains bullish, and we expect the rally to continue extending further from the 1.20991 January low towards 1.40000 and 1.417000.
We’ll be keeping you updated throughout the week with how we’re managing our active ideas. Thanks again for all the likes/boosts, comments and follows — we appreciate the support!
All the best for the week ahead. Trade safe.
BluetonaFX