GBPUSD Sell and Buy Trading PlanH4 - We have a clean bullish trend with the price creating a series of higher highs, higher lows structure
This strong bullish move ended with a bearish divergence
While measuring this strong bullish move using the Fibonacci retracement tool we have two key support zones that has formed (marked in green)
So based on this I expect short term bearish moves now towards the Fibonacci support zones and then continuation higher.
If you enjoy this idea, don’t forget to LIKE 👍, FOLLOW ✅, SHARE 🙌, and COMMENT ✍! Drop your thoughts and charts below to keep the discussion going. Your support helps keep this content free and reach more people! 🚀
--------------------------------------------------------------------------------------------------------------------
Disclosure: I am part of Trade Nation's Influencer program and receive a monthly fee for using their TradingView charts in my analysis.
Gbpusdsetup

GBPUSD: Eyeing a Bullish Structure Shift - A Wyckoffian ApproachGBPUSD 🚦 Technical Analysis & Trade Plan
📊 Current Market Structure
The GBPUSD 4-hour chart is currently consolidating just below a set of equal highs, indicating a potential liquidity pool above. Price action has shown a series of higher lows, suggesting underlying bullish pressure. The market is in a range, with buyers and sellers in equilibrium, but the clustering of highs signals a likely stop-hunt or breakout scenario.
🧠 Wyckoff Perspective
From a Wyckoff standpoint, the market appears to be in the late stages of accumulation. The equal highs represent a classic “creek” or resistance, where smart money may engineer a breakout to trigger stops and induce breakout traders. A successful breakout, followed by a retrace to retest the broken highs (now support), and a subsequent bullish structure break, would confirm the presence of strong demand and the start of a mark-up phase.
🌍 Fundamental Backdrop
Fundamentally, GBP has been supported by resilient UK economic data and a slightly hawkish tone from the Bank of England, while the USD faces headwinds from softer inflation prints and dovish Fed rhetoric. However, geopolitical risks and global risk sentiment remain key drivers, so any sudden shifts could impact the pair.
📰 Current Sentiment
Market sentiment is cautiously optimistic for GBPUSD. CFTC positioning shows a reduction in net GBP shorts, and recent price action reflects a willingness to buy dips. However, the presence of equal highs suggests that many traders are watching for a breakout, increasing the likelihood of a stop-run before a genuine move higher.
🏦 Trade Idea
Entry: Buy on a confirmed break above the current equal highs (around 1.3340), wait for a retrace to retest the broken highs, and enter long on a bullish structure break (e.g., a higher low and bullish engulfing candle).
Stop Loss: Place stops below the retracement low (e.g., below 1.3300).
Take Profit: Target the next significant resistance zone (e.g., 1.3400–1.3450), scaling out as price approaches these levels.
Risk Management: Risk no more than 1–2% of your trading capital on this setup.
⚠️ Disclaimer
Trading forex involves significant risk and may not be suitable for all investors. The analysis and trade idea provided are for educational purposes only and do not constitute financial advice. Always conduct your own research and consult with a licensed financial advisor before making trading decisions.

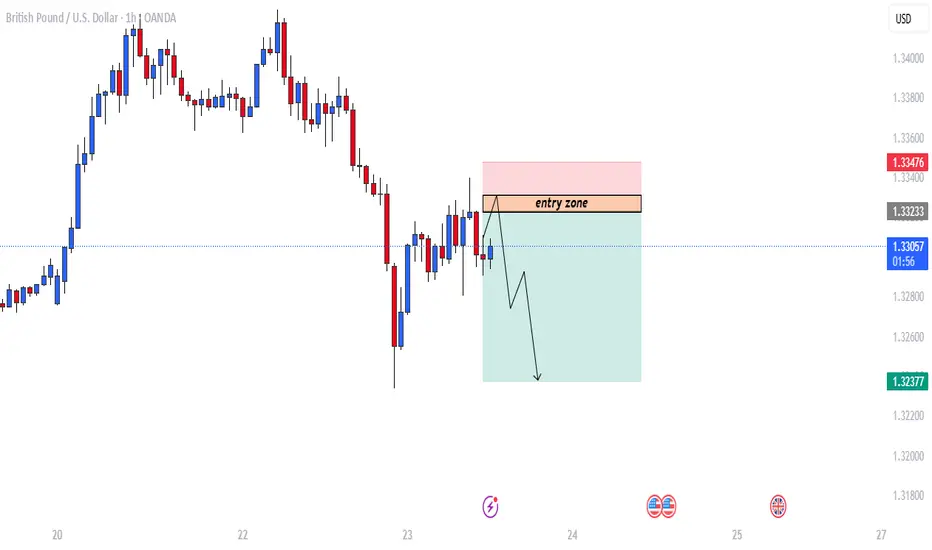
GBPUSD trade setup.This chart shows a GBP/USD (British Pound / U.S. Dollar) trading setup on the 1-hour timeframe, with a bearish outlook.
📊 Chart Analysis
Trend: Recently bearish after a previous uptrend.
Entry Zone: Area between approximately 1.33233 and 1.33317.
Setup Type: Sell/Short Trade Setup
🔍 Key Zones
Entry Zone (Supply/Resistance Area):
Marked as "entry zone".
This is the expected area where price might retrace to before dropping again.
Target Zone:
Arrow points down towards 1.32377, suggesting this is the Take Profit (TP) level.
Stop Loss (SL):
Slightly above the entry zone, near 1.33476, indicating risk management in case price continues upward.
🧠 Trade Idea Summary
Type: Short/Sell
Entry: Wait for price to re-enter the marked "entry zone" (~1.33233 - 1.33317).
Stop Loss: Above 1.33476.
Take Profit: Around 1.32377.
Risk/Reward Ratio: Favorable, as the potential profit zone (green area) is larger than the risk (red area).
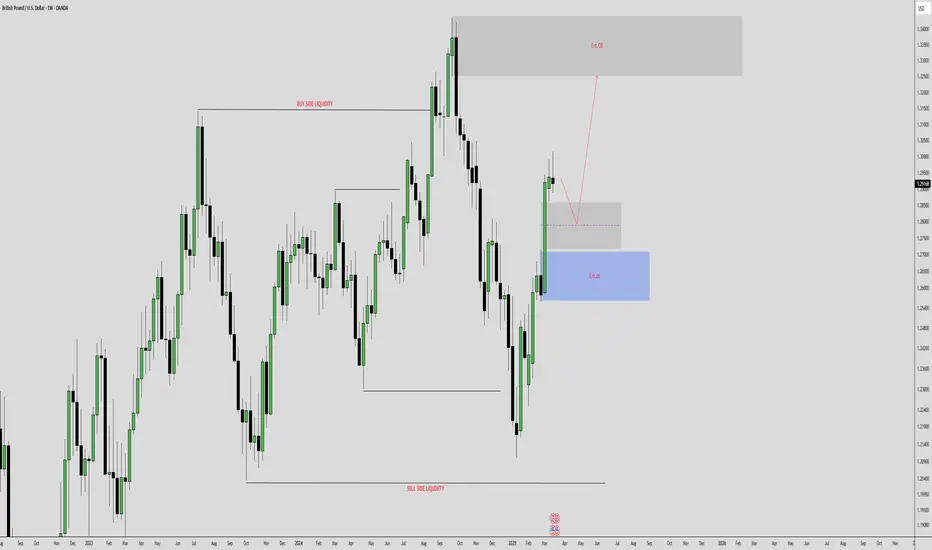
#GBPUSD: Major Swing Sell Coming On GU, What's your views? OANDA:GBPUSD , as discussed in our previous analysis, where we predicted price would reach our target area and then reject it. The price has almost reached this area, and we are now waiting for it to fully complete the move so that we can take a swing sell on the GBP. Currently, the British pound is stronger and bullish due to the UK’s strong economic growth. However, this is not the case for the US dollar. The dollar is struggling to keep up with other currencies and is currently the worst-performing currency of the month of April.
While focusing on GBPUSD as a pair, it has been extremely bullish since the start of April. However, we are now at a point where there are no strong reasons for the pair to remain bullish and continue its uptrend. There are fundamental signs that will eventually reverse the bearish trend.
Our advice to all is to wait for the price to do its thing. Once it reaches our target area, it may show strong bearish dominance. However, this is not a guarantee that it will behave as we expect. There are two targets that you can focus on once you trade is activated.
Good luck and trade safely!
Thank you for your unwavering support! 😊
If you’d like to contribute, here are a few ways you can help us:
- Like our ideas
- Comment on our ideas
- Share our ideas
Team Setupsfx_
❤️🚀
GBPUSD SHORT FORECAST Q2 W18 D28 Y25GBPUSD SHORT FORECAST Q2 W18 D28 Y25
Professional Risk Managers👋
Welcome back to another FRGNT chart update📈
Diving into some Forex setups using predominantly higher time frame order blocks alongside confirmation breaks of structure.
Let’s see what price action is telling us today!
💡Here are some trade confluences📝
✅Weekly order block rejection
✅Daily order block rejection
✅Weekly imbalance to fill short
✅15’ order block
🔑 Remember, to participate in trading comes always with a degree of risk, therefore as professional risk managers it remains vital that we stick to our risk management plan as well as our trading strategies.
📈The rest, we leave to the balance of probabilities.
💡Fail to plan. Plan to fail.
🏆It has always been that simple.
❤️Good luck with your trading journey, I shall see you at the very top.
🎯Trade consistent, FRGNT X
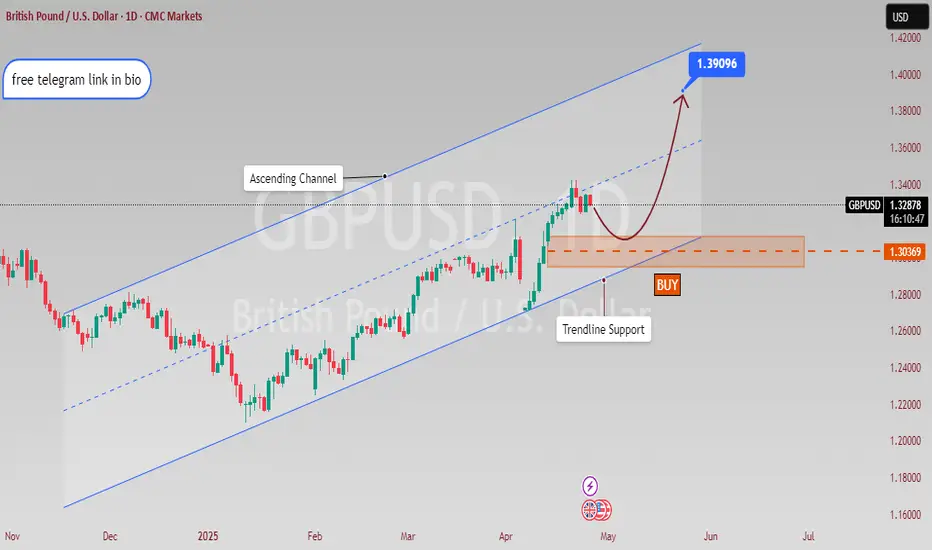
GBPUSD Trade SetupA buy position has been placed on the GBP/USD pair at 1.30369, targeting an ambitious level of 1.39096.
This setup reflects a bullish sentiment, anticipating a strong recovery in the British Pound against the US Dollar.
Recent macroeconomic indicators suggest improving conditions in the UK economy, which could support further upward movement.
Technical analysis shows that the pair is holding above key support levels, indicating sustained buying interest.
If momentum continues, the price may gradually ascend toward the 1.39096 target in the coming weeks.
A potential breakout above intermediate resistance zones could further confirm the bullish trend.
Market sentiment also favors the Pound, especially amid speculation about a more cautious approach by the Federal Reserve.
Volatility remains a factor, so proper risk management and stop-loss placement are essential.
Traders should closely monitor upcoming data releases, such as GDP figures and central bank announcements.
Overall, this trade setup offers a promising risk-to-reward ratio, backed by both technical strength and a supportive macroeconomic backdrop.
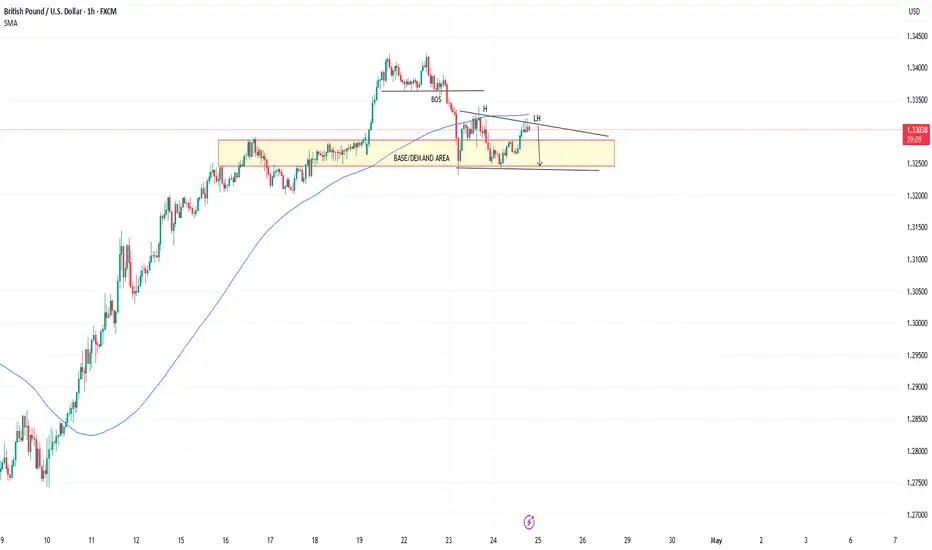
GBPUSD TRADE PLAN H1GBPUSD TF H1
SELL/SHORT PLAN
cancel if price break ma100(blue),or price break structure
take profit max 1.32000
GBPUSD – Rejected at Multi-Month Resistance Amid Weak UK DataGBPUSD has clearly rejected the 1.3413–1.3443 resistance zone—a key area that previously acted as strong supply in September 2024. The pair has formed a bearish rejection candle and is now showing signs of downward momentum.
Key Levels:
Resistance: 1.3413 – 1.3443 (major rejection zone)
TP1: 1.3176 (minor structure)
TP2: 1.3014 (key demand zone)
TP3: 1.2890 (deeper support target)
Bearish Confluences:
Price rejected from major resistance
Bearish candle formation
Previous similar reaction from the same level
Momentum indicators favor downside
📰 Fundamental Analysis:
🔻 UK Data Weakens Further:
According to the latest S&P Global Flash UK PMI (Apr 23):
Composite Output Index: 48.2 (vs 51.5 in March) – 29-month low
Services PMI: 48.9 – 27-month low
Manufacturing PMI: 44.0 – 20-month low
This shows UK private sector activity contracting, led by a steep fall in new export orders, the worst since May 2020.
🔺 Inflation Still High:
Despite falling activity, input and output prices surged, driven by National Insurance hikes and wage growth. This makes it harder for the BoE to justify a cut, despite recession signs.
📌 Conclusion:
The bearish rejection at 1.3413 resistance, combined with deteriorating UK fundamentals, suggests a strong downside setup for GBPUSD. A break below 1.3176 would confirm the bearish move, targeting 1.3014 and potentially 1.2890.

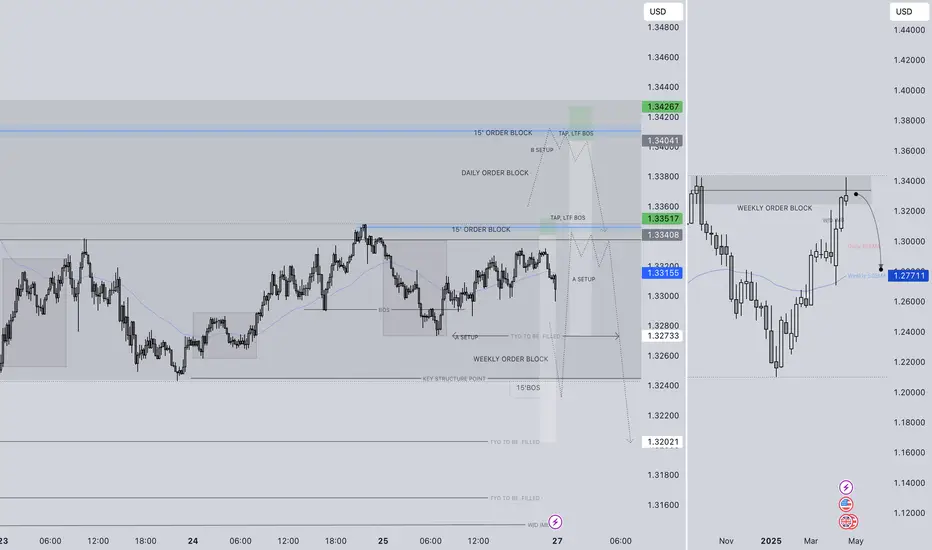
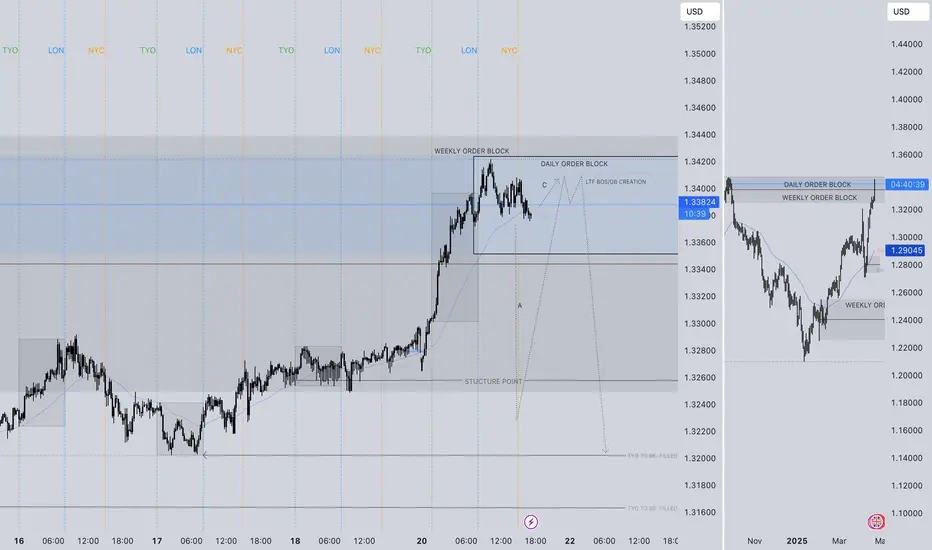
GBPUSD SHORT FORECAST Q2 W17 D22 Y25GBPUSD SHORT FORECAST Q2 W17 D22 Y25
SUMMARY
- Weekly order block
- Daily order block
- Price action bullish in current point of interest.
REQUIREMNTS
- Setup A) Substantial 15' break of structure, creating 15' order block to short from on the pull back.
- Setup C) Lower time frame break of structure without initial 15' break of structure.
- Candle stick formation confluences.
FRGNT X
IG - JCFRGNT
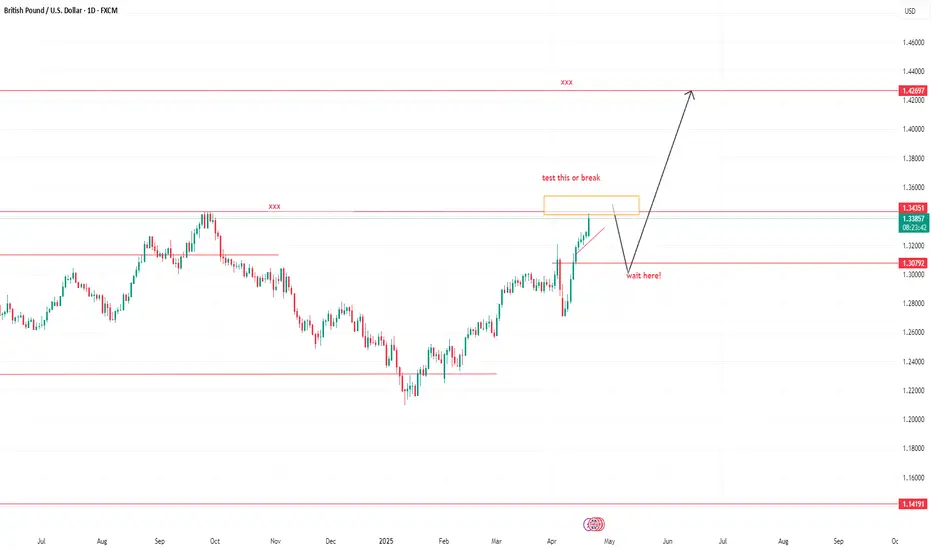
GBPUSD LONG/SWING UPDATESHello folks, its been a long time no post.
Here is my Long/swing trades for Swing traders. This idea base on weekly and monthly.
Buyside liquidity over 1.42600 this is my highest Swing. wait for a retracements we might test this high or break. wait always below.
This is only my view. this is not a financial advice.
lets swing it.
Follow for more.
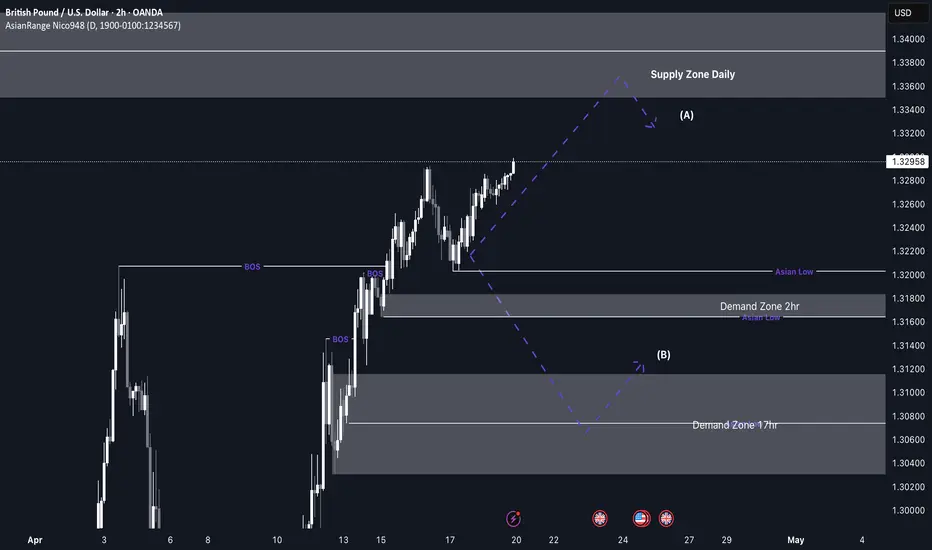
GBP/USD upcoming shorts from 1.33600 back down to demandMy focus this week for GU is around a key daily supply zone that price is currently approaching. As we near this level, I expect price to slow down and begin distributing, potentially leading to a deeper retracement. I anticipate the short setup to form around Tuesday, depending on how price reacts.
If price does retrace, I’ll be watching the 2-hour and 17-hour demand zones, where we could see a bullish reaction and a potential rally from those levels. Since GU has been overall bullish, this would be a counter-trend short, followed by a possible continuation to the upside.
Confluences for GBP/USD Shorts:
- Price is overbought, indicating a potential correction to clear liquidity and fill imbalances.
- Plenty of downside liquidity and imbalances that price could target.
- Approaching a strong daily supply zone, which could act as a key reversal point.
- Unmitigated demand zones below, which may need to be tapped before price continues higher.
P.S. If price doesn’t reach the daily supply zone, I’ll remain patient and look for a buy opportunity to ride price up toward that supply level.
Wishing everyone a great trading week ahead!
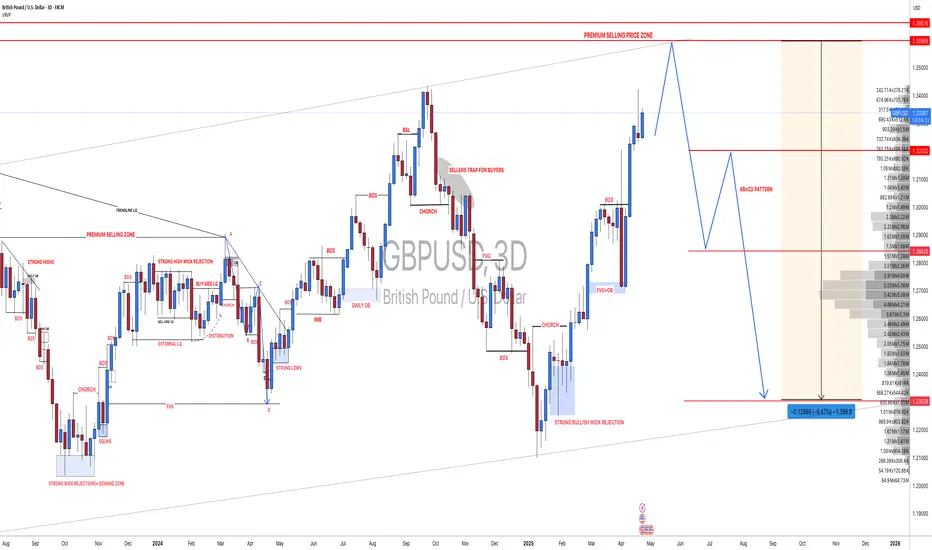
#GBPUSD: Massive Swing Sell Is In Making 1200+ Pips Worth? **FX:GBPUSD Price Analysis**
GBPUSD price has recently experienced an overbought condition, primarily due to the significant decline of the DXY index. This decline can be attributed to the ongoing trade dispute between China and the United States, which has resulted in a drop in the DXY index to its lowest point in the past eighteen months.
Conversely, the GBP has gained strength due to positive economic indicators indicating robust growth in the United Kingdom. This has made the GBP more attractive to investors.
The FX:GBPUSD price is expected to continue its upward trend and potentially reach the 1.35 level. However, it is also possible for the price to reverse its direction from this point.
**Targets:**
If the trade is activated, three targets have been set for the FX:GBPUSD price. These targets can be adjusted based on your own analysis and trading strategy.
We extend our sincere gratitude for your unwavering support and well wishes.
Best regards,
Team Setupsfx_

GBPUSD I Short Opportunity Coming Soon Welcome back! Let me know your thoughts in the comments!
** GBPUSD Analysis - Listen to video!
We recommend that you keep this pair on your watchlist and enter when the entry criteria of your strategy is met.
Please support this idea with a LIKE and COMMENT if you find it useful and Click "Follow" on our profile if you'd like these trade ideas delivered straight to your email in the future.
Thanks for your continued support!Welcome back! Let me know your thoughts in the comments!

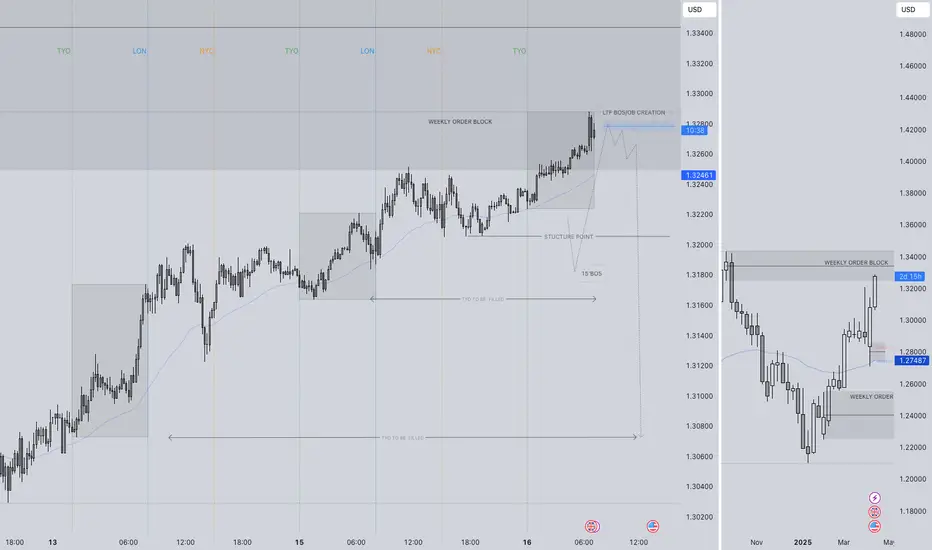
GBPUSD SHORT FORECAST Q2 W16 D16 Y25GBPUSD SHORT FORECAST Q2 W16 D16 Y25
Thoughts- It's not if, it's WHEN !
All longs are null until the weekly order block has been breached or price drops considerably. In the here and now the short seems to be closing in.
It is as always important to stack confluences in favour of the short prior risking capital.
15' break of structure is an absolute requirement as this point of price action.
Within the higher time frame order block- looking for a lower time frame order block is not enough to short from therefore scrolling back months to find is pointless in our opinion.
We will let price show us, we will reaction with price.
What are your thoughts...
Are we dropping today?
FRGNT X
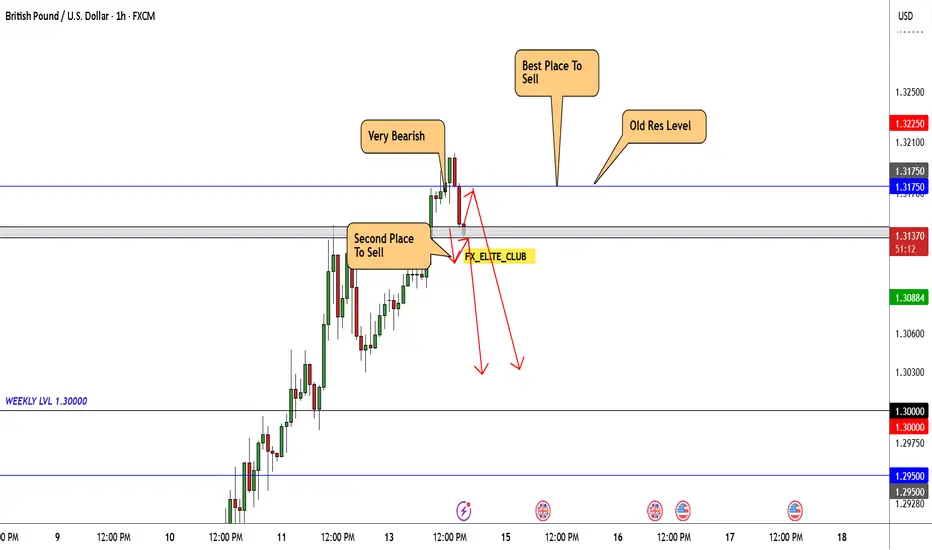
GBP/USD At Interesting Area To Sell , Should We Sell Now ?Here is my Opinion About GBP/USD , I Have an old res and the price respect it 100% and gave us a very good bearish P.A , So i think we have 2 places to sell it , first one if the price back to retest my res level 1.31750 and if the price give us a good bearish price action we can enter and targeting 200 pips . if the price didn`t back to retest the res level we can wait he price to close below support with 4h candle and then we can enter a sell trade with the same target .
GBPUSD and EURUSD Analysis todayHello traders, this is a complete multiple timeframe analysis of this pair. We see could find significant trading opportunities as per analysis upon price action confirmation we may take this trade. Smash the like button if you find value in this analysis and drop a comment if you have any questions or let me know which pair to cover in my next analysis.

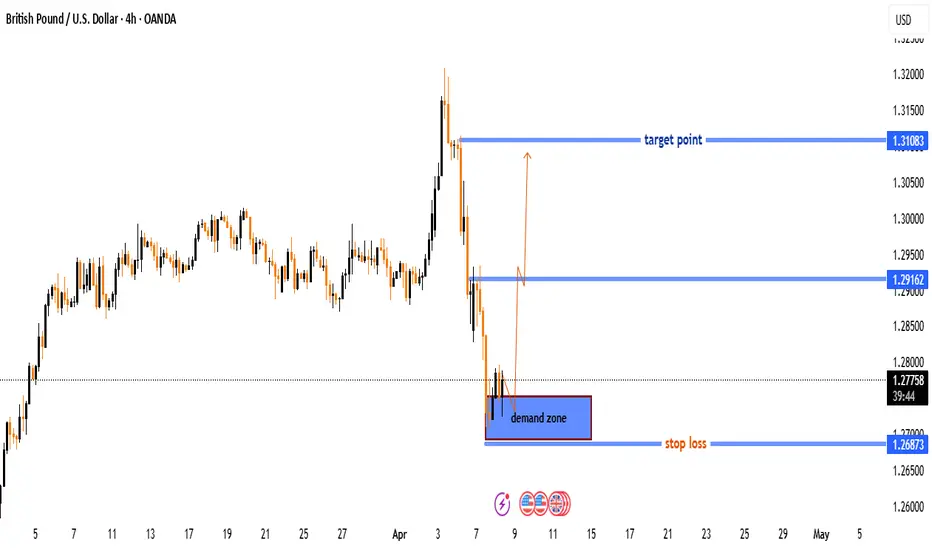
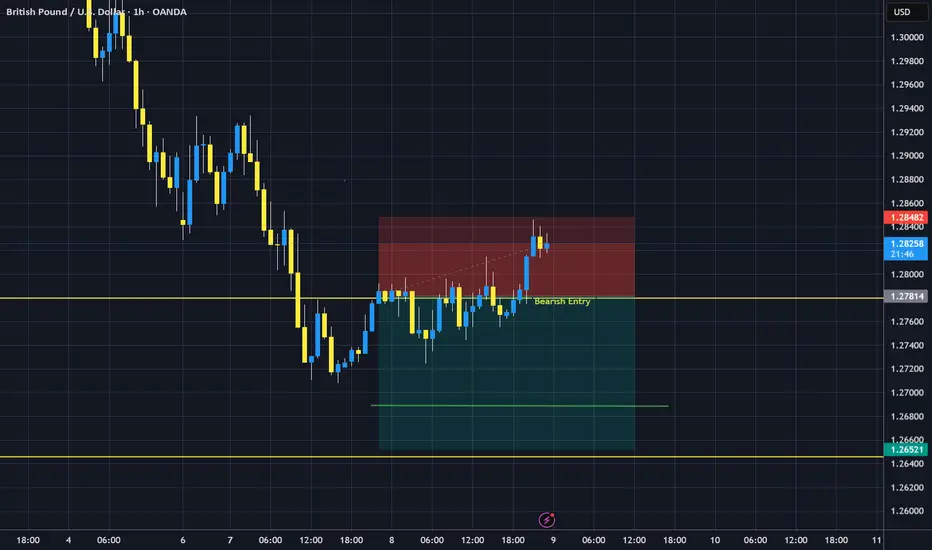
GBP/USD 4H Chart Analysis – Bullish Reversal from Demand ZoneGBP/USD 4H Chart Analysis
Current Price: 1.27883
Timeframe: 4H (OANDA)
Key Zones:
🟦 Demand Zone (Support Area):
📍 Between 1.26873 (🔻 Stop Loss) and current price
This is where buyers are expected to step in and push the price higher.
🚀 Expected Move: The price is consolidating in the demand zone and might breakout upward.
➡️ Possible path:
1. Small pullback within demand zone
2. 📈 Breakout up to 1.29162 (🔵 First Resistance)
3. 📈 Continuation up to 1.31083 (🎯 Target Point)
Important Levels:
🔻 Stop Loss: 1.26873
(If price drops below this, setup is invalid)
🛑 Mid-Resistance Level: 1.29162
(Might face temporary selling pressure here)
🎯 Target Point: 1.31083
(Take-profit zone)
Conclusion:
📉 If price breaks below 1.26873 → trade invalid ❌
📈 If price holds and breaks above resistance → bullish potential ✅
Risk/Reward setup looks favorable from demand zone to target
GBP/USD Ready to Fly! 📢 GBP/USD Ready to Fly! 🚀
📈 Looking bullish from Weekly Bullish FVG 50% Level 🎯
✅ Waiting for confirmation before entry!
🎯 Target: Bearish Extreme Order Block
🔥 Don't miss the move! Stay updated – Follow our TradingView page! 📊
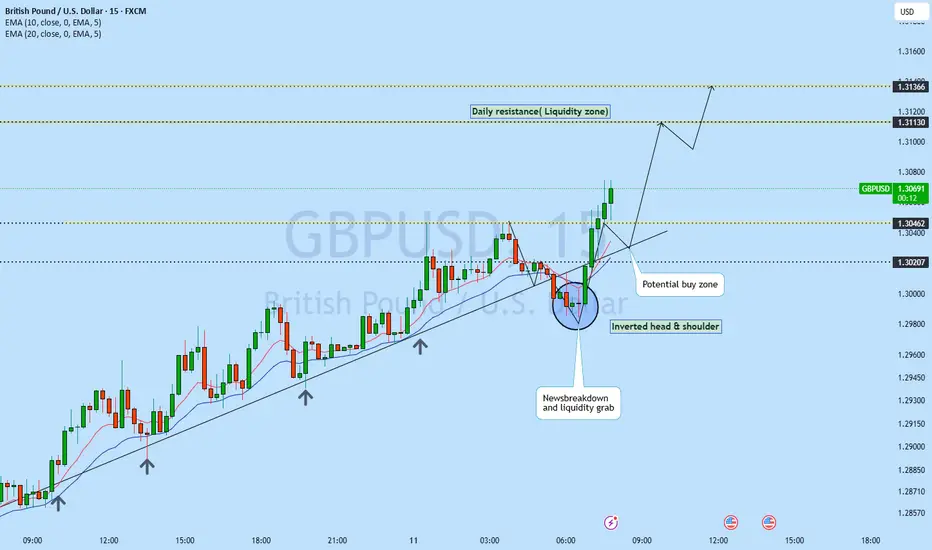
GBPUSD potential buy zone in inverted head & shoulder!GDP in GBPUSD had spike in actual value with the forecast has boost in this pair. Prior to data release this instrument had a break of structure has given strong liquidity grab as it has broken from long term trend line. As the market structure remain intact we may see the price to bounce back to the daily resistance line. 15m timeframe already has formed an inverted head & shoulder which signaling potential breakout. Any liquidity grab may give us potential entry in this lower timeframe.
GBP/USD Bullish Breakout Setup – Entry, Target & Stop Loss AnalyEMA 200 (blue line): 1.28423 – typically used to define long-term trend direction.
EMA 30 (red line): 1.28253 – shorter-term trend indication.
Currently, the price is above the 30 EMA and slightly above the 200 EMA, suggesting short-term bullish momentum with potential for trend reversal or continuation.
🟪 Key Zones and Levels:
Entry Point Zone: Around 1.28242–1.28423 (highlighted in purple).
Stop Loss: Set slightly below the purple demand zone at 1.27931.
Target (EA TARGET POINT): Marked around 1.29809.
🧠 Trade Setup Summary:
Risk/Reward: Good – aiming for a ~1.19% gain (~152.5 pips), with a relatively tight stop loss.
Structure:
The price has broken above a consolidation range (demand zone) and retested the zone (potential bullish retest).
EMA crossover could soon occur if the 30 EMA crosses above the 200 EMA, confirming bullish sentiment.
✅ Bullish Confirmation Signs:
Higher lows forming.
Break and retest of previous resistance (now support).
EMA proximity breakout is occurring.
Strong bullish candles near the entry level.
⚠️ Things to Watch:
If price closes strongly above 1.2860–1.2870, that could signal momentum continuation.
Failing to hold 1.2824–1.2800 might invalidate the setup and trigger the stop loss.
Watch for fundamental events (economic news, especially from UK/US) that could cause sudden volatility.

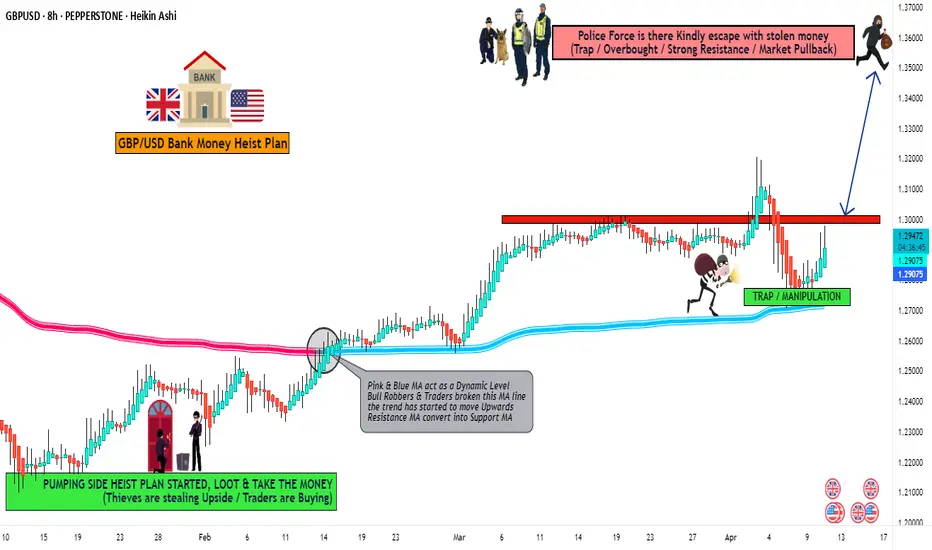
GBP/USD "The Cable" Forex Bank Heist Plan (Swing / Day Trade)🌟Hi! Hola! Ola! Bonjour! Hallo! Marhaba!🌟
Dear Money Makers & Robbers, 🤑 💰💸✈️
Based on 🔥Thief Trading style technical and fundamental analysis🔥, here is our master plan to heist the GBP/USD "The Cable" Forex Market. Please adhere to the strategy I've outlined in the chart, which emphasizes long entry. Our aim is the high-risk Red Zone. Risky level, overbought market, consolidation, trend reversal, trap at the level where traders and bearish robbers are stronger. 🏆💸"Take profit and treat yourself, traders. You deserve it!💪🏆🎉
Entry 📈 : "The heist is on! Wait for the MA breakout (1.30500) then make your move - Bullish profits await!"
however I advise to Place Buy stop orders above the Moving average (or) Place buy limit orders within a 15 or 30 minute timeframe most recent or swing, low or high level.
📌I strongly advise you to set an "alert (Alarm)" on your chart so you can see when the breakout entry occurs.
Stop Loss 🛑: "🔊 Yo, listen up! 🗣️ If you're lookin' to get in on a buy stop order, don't even think about settin' that stop loss till after the breakout 🚀. You feel me? Now, if you're smart, you'll place that stop loss where I told you to 📍, but if you're a rebel, you can put it wherever you like 🤪 - just don't say I didn't warn you ⚠️. You're playin' with fire 🔥, and it's your risk, not mine 👊."
📍 Thief SL placed at the recent/swing low level Using the 4H timeframe (1.27000) Swing/Day trade basis.
📍 SL is based on your risk of the trade, lot size and how many multiple orders you have to take.
🏴☠️Target 🎯: 1.35000 (or) Escape Before the Target
🧲Scalpers, take note 👀 : only scalp on the Long side. If you have a lot of money, you can go straight away; if not, you can join swing traders and carry out the robbery plan. Use trailing SL to safeguard your money 💰.
💰💵💸GBP/USD "The Cable" Forex Market Heist Plan (Swing/Day) is currently experiencing a bullishness,., driven by several key factors. 👇👇👇
📰🗞️Get & Read the Fundamental, Macro, COT Report, Quantitative Analysis, Sentimental Outlook, Intermarket Analysis, Future trend targets... go ahead to check 👉👉👉🔗🔗
⚠️Trading Alert : News Releases and Position Management 📰 🗞️ 🚫🚏
As a reminder, news releases can have a significant impact on market prices and volatility. To minimize potential losses and protect your running positions,
we recommend the following:
Avoid taking new trades during news releases
Use trailing stop-loss orders to protect your running positions and lock in profits
💖Supporting our robbery plan 💥Hit the Boost Button💥 will enable us to effortlessly make and steal money 💰💵. Boost the strength of our robbery team. Every day in this market make money with ease by using the Thief Trading Style.🏆💪🤝❤️🎉🚀
I'll see you soon with another heist plan, so stay tuned 🤑🐱👤🤗🤩
GBPUSD I may have entered too early.. But im not backing out yet!
Observations from the Data
Trend Confirmation via Moving Averages: Several key moving averages and trend indicators (EMA at 1.30829, DEMA, HT Trendline at 1.31043, KAMA, Linear Regression) are positioned well above the current market level of 1.28234. This indicates that, on an hourly basis, the longer-term trend remains bearish.
Directional Indicators: The directional movement figures are very telling. With PLUS_DI at about 4.97 and MINUS_DI at around 31.38, sellers clearly dominate the market. A low DI(+) against a high DI(–) reinforces that the overall bias is to the downside.
Momentum & Oscillators:
The RSI is extremely low at ~15, indicating an oversold condition. In isolation, this might hint at a potential short-term bounce.
However, other momentum indicators, such as the Chande Momentum Oscillator (-70.09) and a slightly negative MACD (-0.00185), suggest that the underlying bearish momentum has been strong.
Oscillators like Williams %R (at -89.21) further underscore that the market is deep into oversold territory.
Volatility Metrics: An ATR of 0.0043 and relatively low standard deviation indicate modest volatility, meaning your stop-loss and target levels can be measured with reasonable precision.
Context and Rationale
Overall Trend: The majority of your trend-following indicators (e.g., EMA, DEMA, HT Trendline, KAMA) are positioned higher, confirming a prevailing bearish bias. Even though the RSI shows an extreme oversold reading (around 15), in a strong downtrend like this, oversold conditions can simply trigger a temporary bounce rather than a reversal. My sell entry at 1.27752 aligns with staying in the trend.
Directional Pressure: With the MINUS_DI (31.38) greatly outweighing the PLUS_DI (4.97), the directional movement clearly favors sellers. My entry at 1.27752 positions me within this selling pressure, assuming the bounce to fail and the downtrend to resume.
Entry Timing: Instead of waiting for a higher bounce ideal for a pullback short, my entry at 1.27752 suggests that I chose to capture a move early in the downswing or perhaps because price action broke a key support level. This could be advantageous if momentum continues as anticipated.
Why This Trade Setup Works
Alignment with Trend: Maintaining a sell position aligns with the overall bearish structure indicated by your moving averages and directional indicators.
Captchaing a Bounce Rejection: Even if a short-term bounce occurs from oversold conditions, your entry near 1.27752 could capture the early phase of a bearish continuation provided that the rally fails to sustain.
Confluence of Technical Signals: The combination of oversold conditions (which in a downtrend often predict a short-lived bounce) and the strong directional indication from MINUS_DI and related momentum oscillators creates a setup where a rejection of a minor recovery can lead to further downside moves.
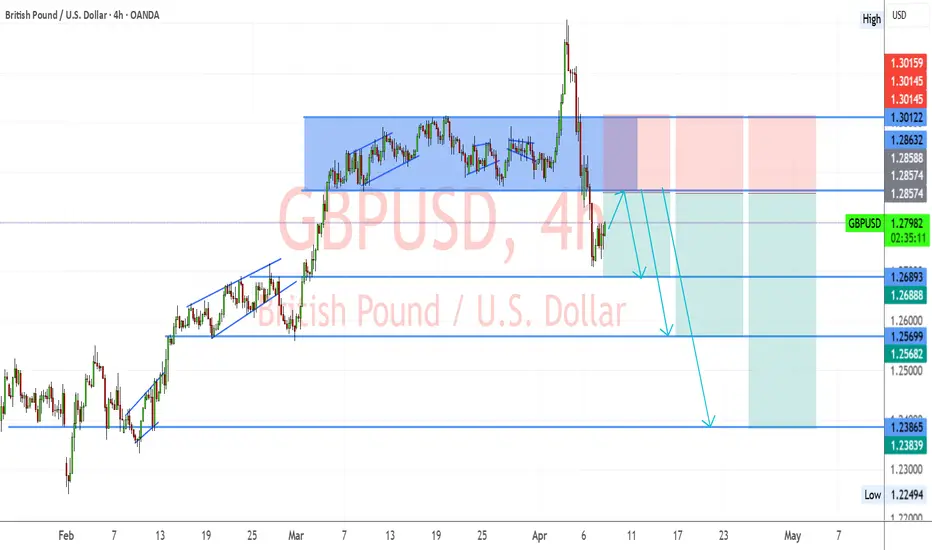
GBPUSD Watch – Bearish Momentum Building Below Supply ZoneGBPUSD pair has broken sharply below the long-standing accumulation range between 1.2857 – 1.3012, signaling a shift in market sentiment. The recent bearish engulfing structure has pushed price into a corrective pullback phase, with sellers likely to re-enter on rallies.
Key Technical Levels:
Current Price: 1.2795
Resistance (Supply Zone): 1.2857 – 1.2863
First Support Target: 1.2688 – 1.2690
Mid-Level Target: 1.2568 – 1.2570
Final Bearish Target: 1.2383 – 1.2390 (demand zone & key support)
Trade Scenario:
📉 Bearish Bias:
Price is expected to retrace into the supply zone (1.2857–1.2863) and then reject.
If resistance holds and structure remains intact, expect continuation toward:
TP1: 1.2689
TP2: 1.2568
TP3: 1.2385
🔁 Invalidation Zone:
A sustained break and close above 1.2863 would invalidate the bearish setup and could trigger a move toward 1.3012.
Technical Confluence:
✅ Previous consolidation turned into a strong resistance zone
✅ Bearish breakout from range
✅ Clean lower highs and lower lows structure
✅ Volume drop on the pullback (likely a corrective move)