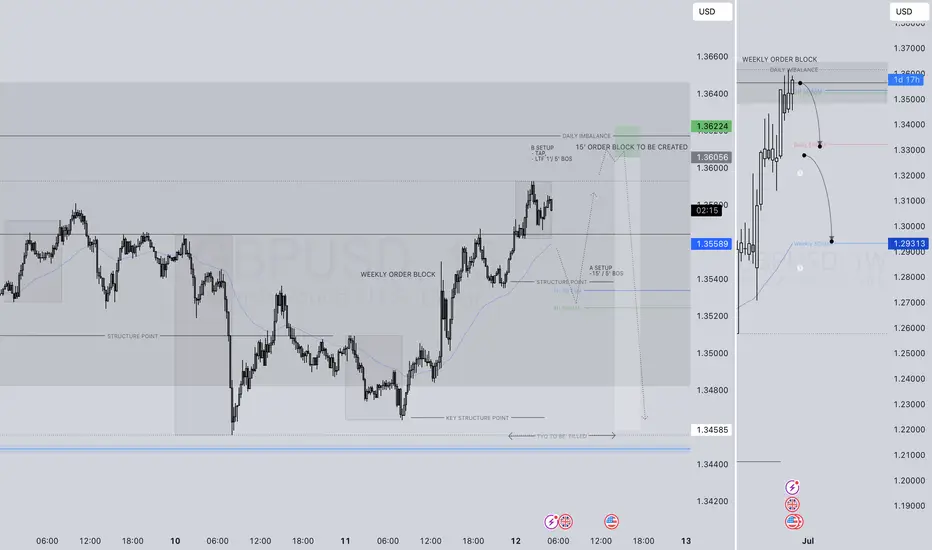
GBPUSD SHORT FORECAST Q2 W24 D12 Y25GBPUSD SHORT FORECAST Q2 W24 D12 Y25
Professional Risk Managers👋
Welcome back to another FRGNT chart update📈
Diving into some Forex setups using predominantly higher time frame order blocks alongside confirmation breaks of structure.
Let’s see what price action is telling us today!
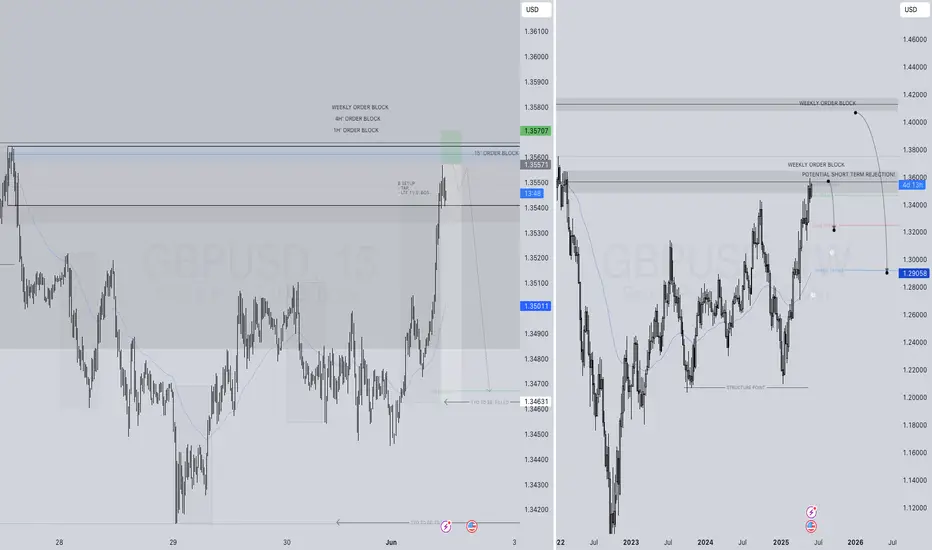
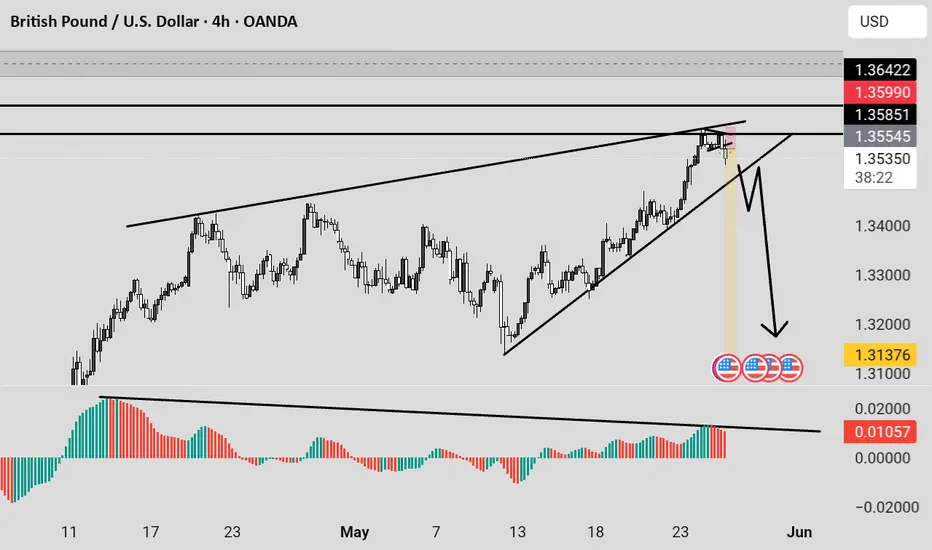
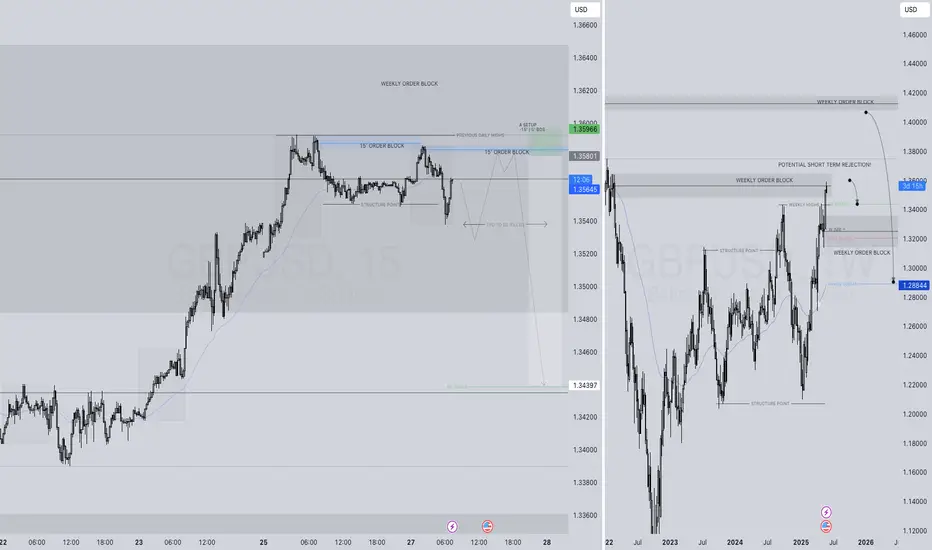
💡Here are some trade confluences📝
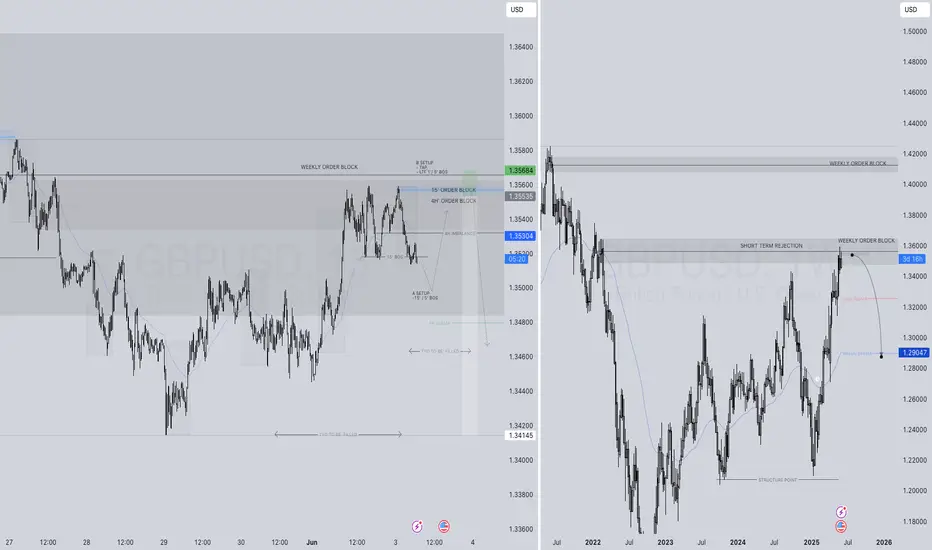
✅Weekly order block
✅15' order block
✅Intraday 15' break of structure
✅Tokyo ranges to be filled
🔑 Remember, to participate in trading comes always with a degree of risk, therefore as professional risk managers it remains vital that we stick to our risk management plan as well as our trading strategies.
📈The rest, we leave to the balance of probabilities.
💡Fail to plan. Plan to fail.
🏆It has always been that simple.
❤️Good luck with your trading journey, I shall see you at the very top.
🎯Trade consistent, FRGNT X
Gbpusdshort
The British pound's rebound was blockedThe British pound staged a technical rebound after a sharp decline on Tuesday, trading near 1.35 during the North American session. A day earlier, the exchange rate had retreated amid expectations that the Bank of England (BoE) would continue to cut rates twice within the year, triggered by weak UK labor market data. However, on Wednesday, against the backdrop of the US CPI data falling short of expectations, the US Dollar Index weakened, allowing the pound to rebound. Although the exchange rate has regained the 1.35 threshold currently, if UK economic data continues to be weak, the pound may test support levels at 1.34 or lower again.
Humans need to breathe, and perfect trading is like breathing—maintaining flexibility without needing to trade every market swing. The secret to profitable trading lies in implementing simple rules: repeating simple tasks consistently and enforcing them strictly over the long term.
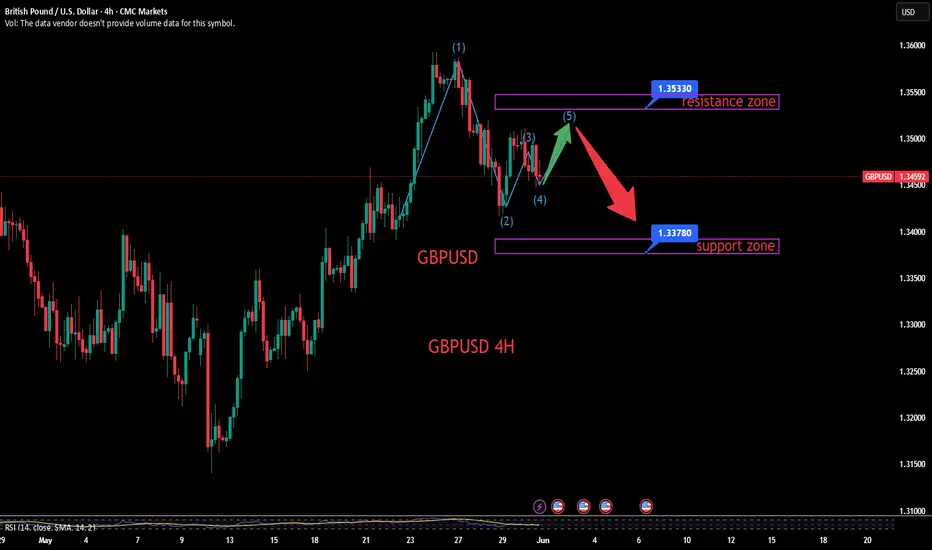
GBPUSD Downward pressure, an usual setup in line with trend
GBPUSD Downward pressure, an usual setup in line with trend
GBPUSD trade ideaFX:GBPUSD
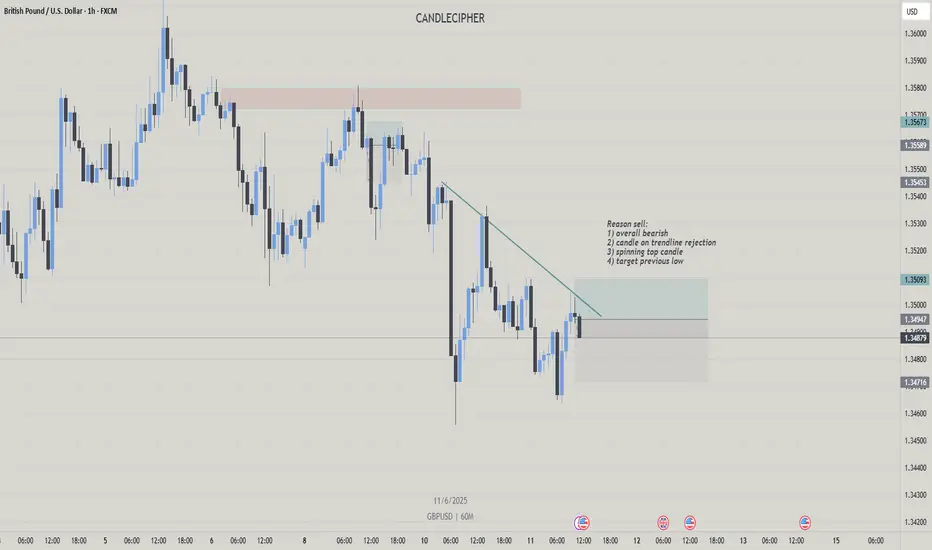
Reason sell:
1) overall bearish
2) candle on trendline rejection
3) spinning top candle signals nearby reversal
4) target previous low
GBPUSD ANALYSISAfter seeing the previous daily candle close bearish and below support, we could expect the move to continue since the 4hr also has structural type move pushing to the downside

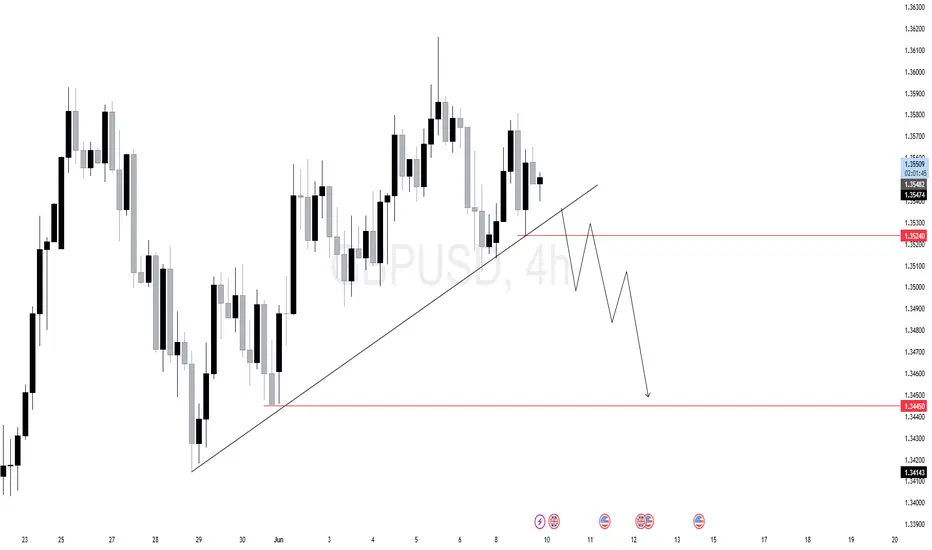
$GU (GBPUSD) 4H AnalysisExpectation: Break of trendline → retest → drop toward 1.34450 liquidity.
Momentum is exhausting near resistance, and price is now testing a key ascending trendline...We’ve swept short-term buy stops and failed to sustain bullish continuation.
Buy-side liquidity above recent highs has been swept.
Now, sell-side liquidity rests below 1.35240 (marked in red), a key equal low / internal liquidity pool...Below that, there’s a clean draw to the 1.34450–1.34143 imbalance zone, where liquidity and inefficiency align.
Price could pull back after the trendline break, then resume bearish continuation.
GBPUSD:Sharing of the Trading Strategy for Next WeekAll the trading signals this week have resulted in profits!!! Check it!!!👉👉👉
Fundamental Analysis:
US May Nonfarm Payroll data influences Fed policy expectations: slowing job growth but strong wage growth raises odds of a September rate cut, exerting pressure on the USD. Meanwhile, the UK manufacturing sector faces headwinds from US tariff policies, while domestic policy adjustments (e.g., tightened stamp duty relief) impact the economy. Diverging expectations on BoE rate policy and unimplemented parts of the US-UK trade agreement add uncertainty.
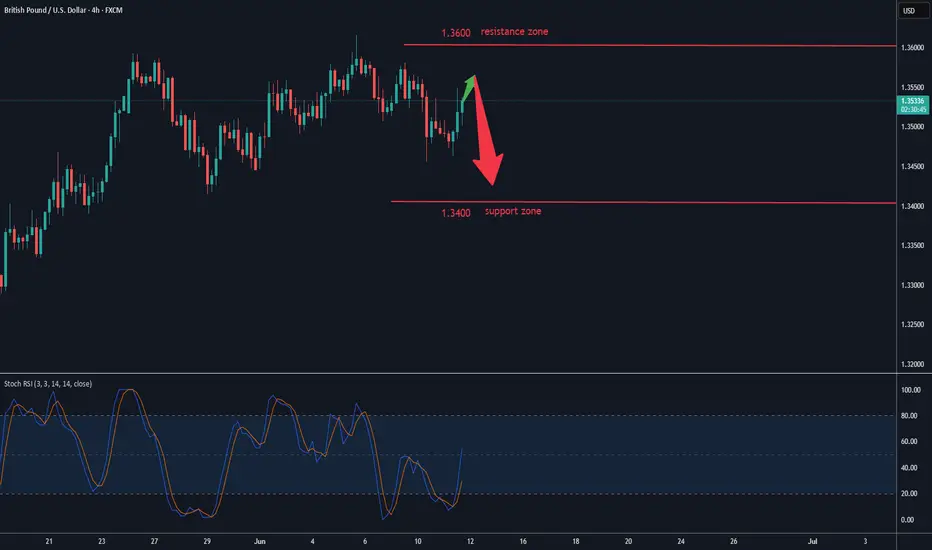
Technical Analysis (4-hour chart):
MACD histogram remains negative but is shrinking, indicating marginal bullish momentum recovery amid an unclear overall trend.
Rising prices with declining volumes signal weakening upward momentum.
Key resistance: ~1.3600; support: ~1.3400.
Trading Recommendation:
Aggressive traders may initiate light long positions near 1.3450 on price retracement.
Trading Strategy:
buy@1.3450-1.3480
TP:1.3550-1.3600
Share accurate trading signals daily—transform your life starting now!
👇 👇 👇 Obtain signals👉👉👉

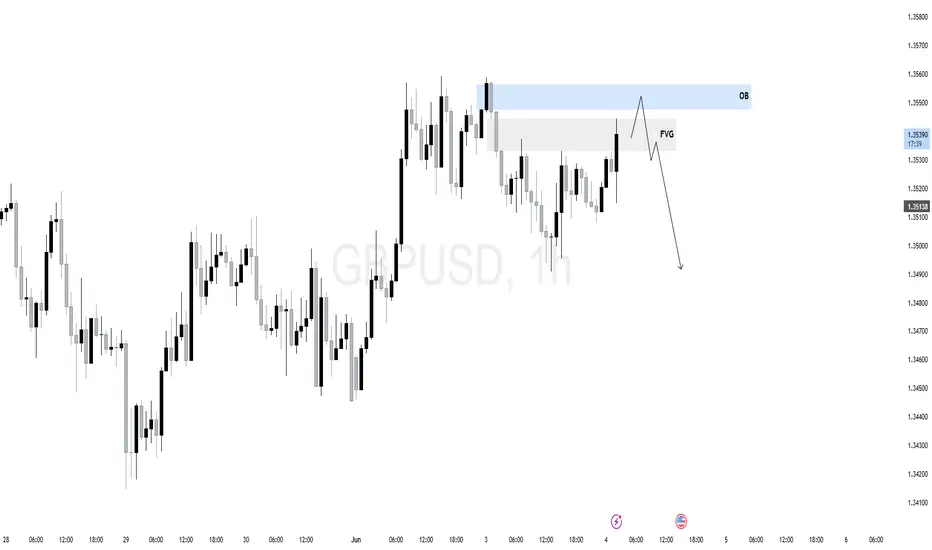
GBPUSD 1H chart✅ What I Like:
Clean Fair Value Gap (FVG):
The FVG is clearly defined and price is actively returning to it.
This offers a textbook point of interest (POI) for a potential short.
Price Delivered into Premium:
This FVG is sitting in a premium zone (above the equilibrium of the recent swing), making it a good area for potential shorts if internal liquidity has been swept.
Aggressive Displacement Candle:
The bullish candle that tapped into the FVG is impulsive — might be a liquidity run, grabbing buy-side liquidity before a reversal.
⚠️ Concerns:
No Clear Liquidity Sweep Yet:
There’s no obvious run on recent highs before price hits the FVG.
Without a liquidity grab, the setup might lack that “smart money” confirmation.
No Market Structure Shift Confirmed:
We’re still in bullish short-term structure unless we break a recent low.
A reversal from the FVG needs confirmation via lower-timeframe BOS.
Dollar News Event Approaching?
The FVG reaction could fake out if major USD data is near.
Fundamentals can disrupt clean technical setups.
🧠 Final Thoughts:
If this setup is to be shorted:
Wait for 15m or 5m structure shift.
Look for signs of exhaustion or rejection in the FVG zone (e.g., bearish engulfing, liquidity sweep of intraday highs).
If price pushes above the FVG without rejection, it may invalidate the short and continue toward higher liquidity.
High-probability zone, but needs confirmation + narrative.
GBPUSD SHORT FORECAST Q2 W23 D3 Y25GBPUSD SHORT FORECAST Q2 W23 D3 Y25
🔥👀TECHNICAL HOT PICK
Professional Risk Managers👋
Welcome back to another FRGNT chart update📈
Diving into some Forex setups using predominantly higher time frame order blocks alongside confirmation breaks of structure.
Let’s see what price action is telling us today!
💡Here are some trade confluences📝
✅Weekly order block
✅15' order block
✅4 hour order block
✅Tokyo ranges to be filled
🔑 Remember, to participate in trading comes always with a degree of risk, therefore as professional risk managers it remains vital that we stick to our risk management plan as well as our trading strategies.
📈The rest, we leave to the balance of probabilities.
💡Fail to plan. Plan to fail.
🏆It has always been that simple.
❤️Good luck with your trading journey, I shall see you at the very top.
🎯Trade consistent, FRGNT X
SHORT IT !! - GBPUSD SHORT FORECAST Q2 W23 D2 Y25GBPUSD SHORT FORECAST Q2 W23 D2 Y25
🔥👀QUICK SCOPE TECHNICAL REVERSAL HOT PICK
Professional Risk Managers👋
Welcome back to another FRGNT chart update📈
Diving into some Forex setups using predominantly higher time frame order blocks alongside confirmation breaks of structure.
Let’s see what price action is telling us today!
💡Here are some trade confluences📝
✅Weekly order block
✅15' order block
✅4 hour order block
✅Tokyo ranges to be filled
🔑 Remember, to participate in trading comes always with a degree of risk, therefore as professional risk managers it remains vital that we stick to our risk management plan as well as our trading strategies.
📈The rest, we leave to the balance of probabilities.
💡Fail to plan. Plan to fail.
🏆It has always been that simple.
❤️Good luck with your trading journey, I shall see you at the very top.
🎯Trade consistent, FRGNT X
GBPUSD - Trade Idea for Today ! Hurry Up !Details on chart. There some important levels here and we might see a downward move here.
CMCMARKETS:GBPUSD FX:GBPUSD OANDA:GBPUSD FX_IDC:GBPUSD

GBPUSD:Sharing of the Trading Strategy for Next WeekAll the trading signals this week have resulted in profits!!! Check it!!!👉👉👉
Fundamental Analysis:
While the Bank of England has rate-cut expectations, markets are divided on the magnitude of the cut, and the UK economy faces uncertainties such as trade risks.
Uncertainties persist regarding the impact of U.S. economic data on the U.S. dollar’s strength, and the effects of Trump’s policies on the economic and monetary policies of both countries remain to be seen.
Technical Analysis:
Short-term momentum is weak, with MACD histogram continuing to show negative values, indicating strong bearish pressure. A failure to break above overhead resistance may extend the downward trend.
Key support lies near 1.13378, while resistance is seen around 1.13533.
Trading Recommendations:
Aggressive traders may initiate light short positions near the resistance zone.
Trading Strategy:
Sell@1.14000-1.13500
TP:1.13300
Share accurate trading signals daily—transform your life starting now!
👇 👇 👇 Obtain signals👉👉👉
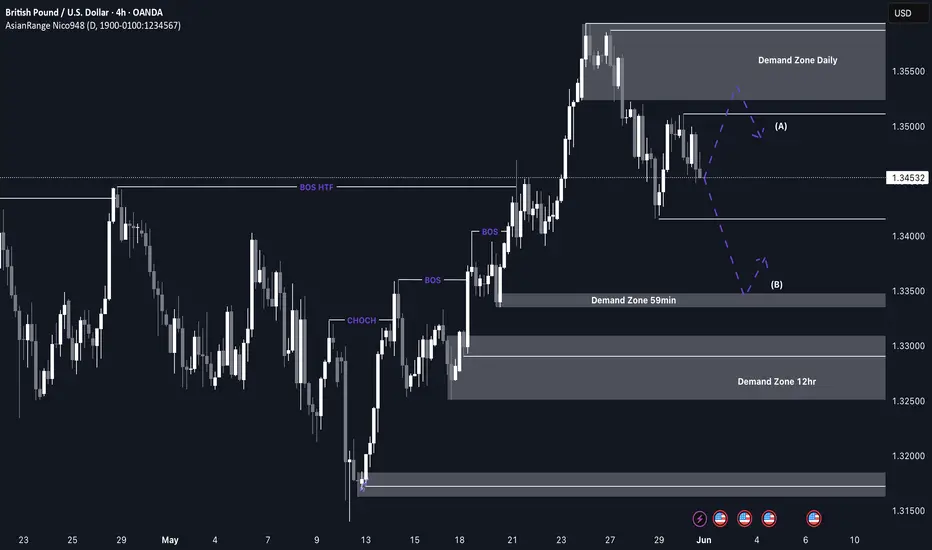
GBP/USD Shorts from the daily supplyI’m anticipating a potential retracement as price has been heavily bullish and is now beginning to show signs of being overbought. After recently breaking major structure to the upside, there’s room for a temporary sell-off as price corrects before continuing higher.
I’ll be watching for possible reactions from the 59-minute demand zone for a minor bounce, but the more ideal long opportunity would be at the 12H demand zone around 1.3300, where structure is cleaner and confluences align.
Confluences for Short-Term Sells:
- A recent change of character (CHOCH) to the downside signals a shift in momentum
- A clean daily supply zone has been left behind that could initiate a deeper pullback
- Significant liquidity below, including the Asia low, ready to be swept
- For price to maintain long-term bullish movement, it must first correct, fill imbalances, and mitigate valid demand levels
P.S. If price drops further and breaks structure, we’ll likely see a new supply zone form. This will provide a closer and more refined opportunity to participate in the move.
Stay sharp and trade safe! 📉📈
CONFLUENCE KEY GBPUSD SHORT FORECAST Q2 W22 D29 Y25GBPUSD SHORT FORECAST Q2 W22 D29 Y25
🔥👀QUICK SCOPE TECHNICAL REVERSAL HOT PICK
Professional Risk Managers👋
Welcome back to another FRGNT chart update📈
Diving into some Forex setups using predominantly higher time frame order blocks alongside confirmation breaks of structure.
Let’s see what price action is telling us today!
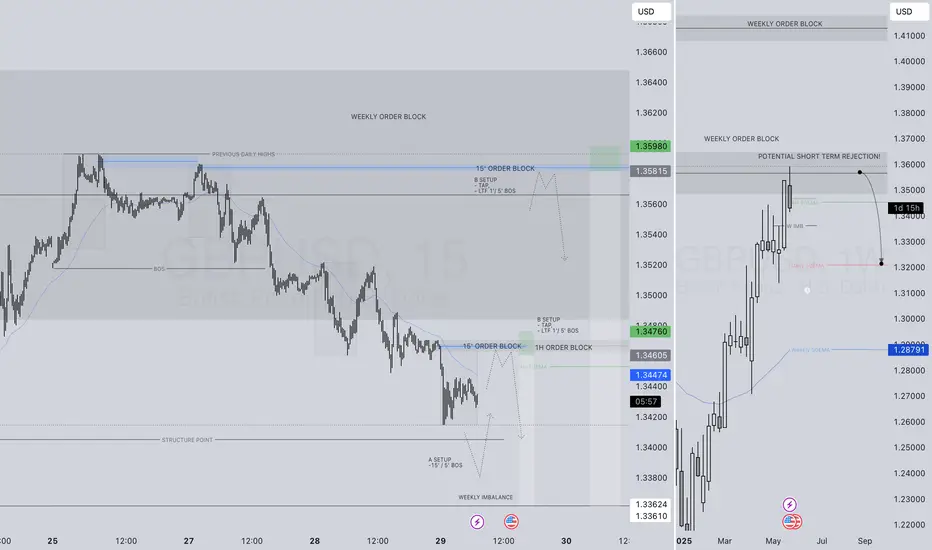
💡Here are some trade confluences📝
✅Weekly order block
✅15' order block
✅1 hour order block
✅Tokyo ranges to be filled
🔑 Remember, to participate in trading comes always with a degree of risk, therefore as professional risk managers it remains vital that we stick to our risk management plan as well as our trading strategies.
📈The rest, we leave to the balance of probabilities.
💡Fail to plan. Plan to fail.
🏆It has always been that simple.
❤️Good luck with your trading journey, I shall see you at the very top.
🎯Trade consistent, FRGNT X
GBP/USD Breakout (28.05.2025)The GBP/USD Pair on the M30 timeframe presents a Potential Selling Opportunity due to a recent Formation of a Breakout Pattern. This suggests a shift in momentum towards the downside in the coming hours.
Possible Short Trade:
Entry: Consider Entering A Short Position around Trendline Of The Pattern.
Target Levels:
1st Support – 1.3424
2nd Support – 1.3380
🎁 Please hit the like button and
🎁 Leave a comment to support for My Post !
Your likes and comments are incredibly motivating and will encourage me to share more analysis with you.
Best Regards, KABHI_TA_TRADING
Thank you.
Disclosure: I am part of Trade Nation's Influencer program and receive a monthly fee for using their TradingView charts in my analysis.

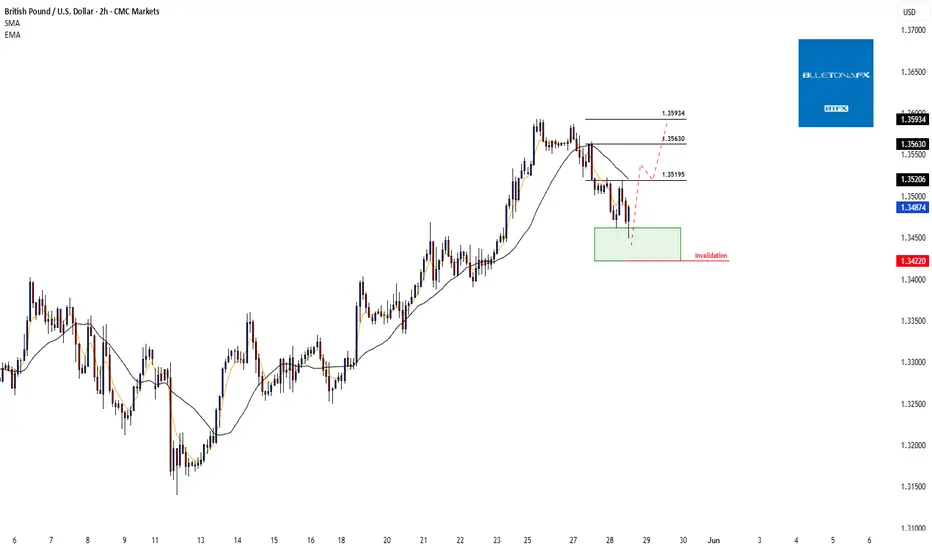
GBP/USD Correction Potentially Complete – Key Breakout LevelsHi everyone,
GBP/USD has been undergoing a short-term correction since the start of the week. Our view is that this correction may now be complete, with the bullish trend potentially resuming.
For confirmation, we’re watching for a break above the 1.35195 level, followed by a move through 1.35934.
If these levels are cleared, we anticipate further upside. We’ll continue to share updates on the projected path for GBP/USD should price action reach our key zone.
The longer-term outlook remains bullish, and we expect the rally to extend further from the 1.20991 January low.
We’ll be keeping you updated throughout the week with how we’re managing our active ideas. Thanks again for all the likes/boosts, comments and follows — we appreciate the support!
All the best for the week ahead. Trade safe.
BluetonaFX
GBP/USD Bearish Signal | Technical + Custom AlgoSmart Sell Signal | GBP/USD – Powered by Custom Algorithm & Technical Precision
This sell signal is generated by a proprietary trading system I’ve developed, combining pure technical trend logic with automated decision-making.
The algorithm:
Confirms reversal signals through layered filter logic
Defines clean entry, stop-loss, and target zones — all fully automated
No human judgment, no discretionary trades — just objective data turned into actionable analysis.
🧠 Built on precision. Backed by testing.
📉 Current outlook: Bearish sentiment confirmed on multi-timeframe structure.
📌 Disclaimer: This is not financial advice. For educational and analytical purposes only.

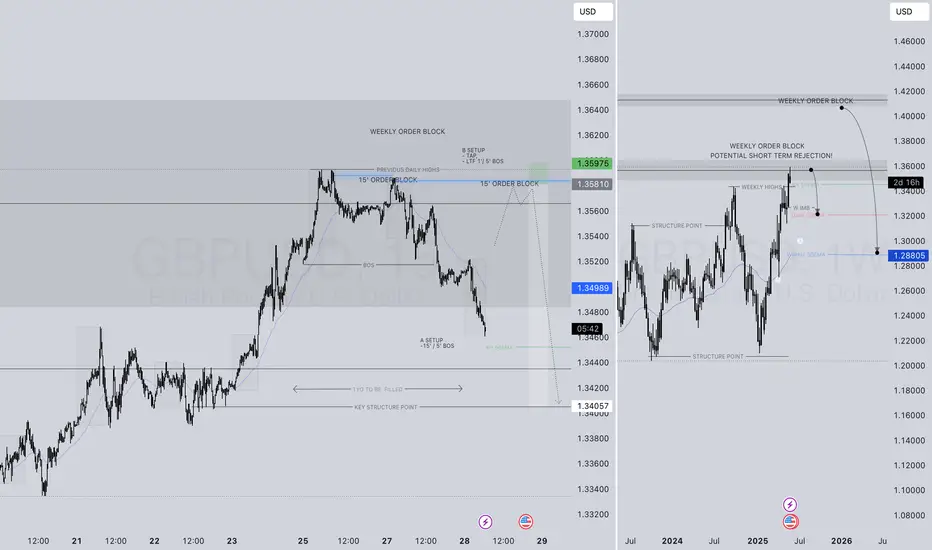
GBPUSD SHORT FORECAST Q2 W22 D28 Y25GBPUSD SHORT FORECAST Q2 W22 D28 Y25
🔥👀QUICK SCOPE TECHNICAL REVERSAL HOT PICK
Professional Risk Managers👋
Welcome back to another FRGNT chart update📈
Diving into some Forex setups using predominantly higher time frame order blocks alongside confirmation breaks of structure.
Let’s see what price action is telling us today!
💡Here are some trade confluences📝
✅Weekly order block
✅15' order block
✅Intraday bearish breaks of structure
✅Tokyo ranges to be filled
🔑 Remember, to participate in trading comes always with a degree of risk, therefore as professional risk managers it remains vital that we stick to our risk management plan as well as our trading strategies.
📈The rest, we leave to the balance of probabilities.
💡Fail to plan. Plan to fail.
🏆It has always been that simple.
❤️Good luck with your trading journey, I shall see you at the very top.
🎯Trade consistent, FRGNT X
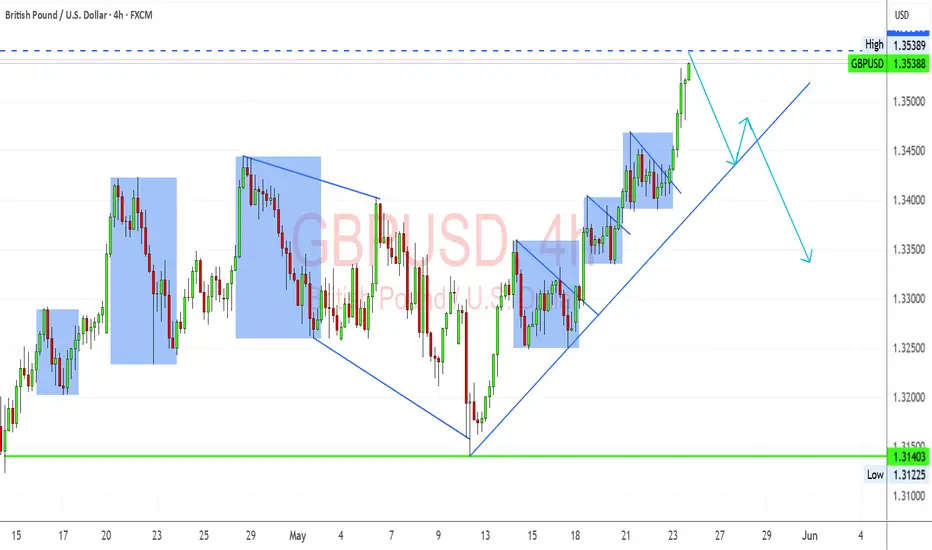
GBPUSD Near Key Resistance – Watching for PullbackGBPUSD has surged to test the 1.3538 resistance, forming a strong impulsive rally supported by higher lows and tight bullish consolidation patterns. However, price is now pressing into a major horizontal resistance and rising trendline, setting up for either continuation or correction.
Key Levels:
Major Resistance: 1.35389 (previous high, potential double top)
Trendline Support: ~1.3440 (ascending structure)
Downside Target (if break occurs): 1.3140 (range floor)
Scenarios to Watch:
🔹 Bearish Scenario (Primary Watch)
Price reacts to 1.3538 and forms a rejection candle
Break of the ascending trendline may trigger a retracement
Downside target zones:
1.3440 (initial structure)
1.3140 (major support zone)
🔹 Bullish Breakout (Alternate Scenario)
Clean break and close above 1.3538
Would invalidate short-term correction and open path to new highs
Momentum continuation possible toward 1.3600–1.3700
Pattern Notes:
Bullish structure with minor flags and wedges in the uptrend
But rally is extended and hitting overbought territory near resistance
RSI divergence or reversal patterns around this level would strengthen short case
Conclusion:
📌 GBPUSD is at a major resistance. Watch for rejection or breakout.
📌 If it holds below 1.3538 and breaks trendline, short setup is favored.
📌 If it breaks out above 1.3538 with volume, stay out of shorts and wait for retest.
GBPUSD: Bearish Trend Double Top/ M Formation has appeared on the peak of this uptrend. Maybe this could be used to start the downtrend for the next several days.
GBPUSD SHORT IDEAGBPUSD has been rally up for a while. Currently, there's a divergence signal from the awesome oscillator on the daily timeframe. Switching to 4 hours timeframe, there's a clearer view of what's going on. Based on the 4 hours chart, rising wedge has been formed and there's also a bearish divergence signal from the awesome oscillator. In addition to these, price has mitigated a daily supply zone after taking out a significant high as a liquidity. Then, a bearish engulfing candlestick was formed, signifying potential reversal. On 1 hour timeframe, price has broken out of a rising wedge and retested it.
As a retail trader, one can enter a short position after the bearish engulfing candlestick confirmation. This aligns with the 1 hour breakout and retest. While one can wait for price to break out of the 4 hours rising wedge.
As a smart money trader, one can wait for a change of character and break of structure on the 4 hours timeframe to confirm that price has really changed its trend ready for a reversal.
Either way, one can take advantage of the potential short opportunity on GBPUSD.
Confluences for the short signal:
1. Bearish divergence signal from awesome oscillator on daily and 4 hours timeframe.
2. Rising wedge on 4 hours timeframe.
3. Price mitigating daily supply zone.
4. Price has taken out a significant high as a liquidity.
5. Bearish engulfing candlestick formation on 4 hours timeframe.
Disclaimer: This is not a financial advice. The outcome maybe different from the projection. If you can't accept the risk, don't take the signal.
GBPUSD TECHNICAL REVERSAL SHORT FORECAST Q2 W22 D27 Y25GBPUSD TECHNICAL REVERSAL SHORT FORECAST Q2 W22 D27 Y25
🔥👀TECHNICAL REVERSAL HOT PICK
Professional Risk Managers👋
Welcome back to another FRGNT chart update📈
Diving into some Forex setups using predominantly higher time frame order blocks alongside confirmation breaks of structure.
Let’s see what price action is telling us today!
💡Here are some trade confluences📝
✅Weekly order block
✅15' order block
✅Intraday bearish breaks of structure
✅Tokyo ranges to be filled
🔑 Remember, to participate in trading comes always with a degree of risk, therefore as professional risk managers it remains vital that we stick to our risk management plan as well as our trading strategies.
📈The rest, we leave to the balance of probabilities.
💡Fail to plan. Plan to fail.
🏆It has always been that simple.
❤️Good luck with your trading journey, I shall see you at the very top.
🎯Trade consistent, FRGNT X
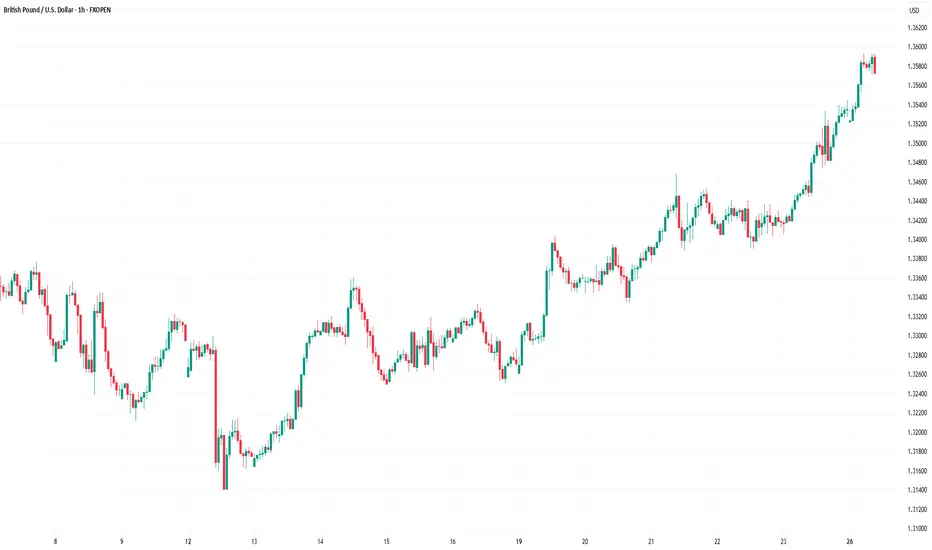
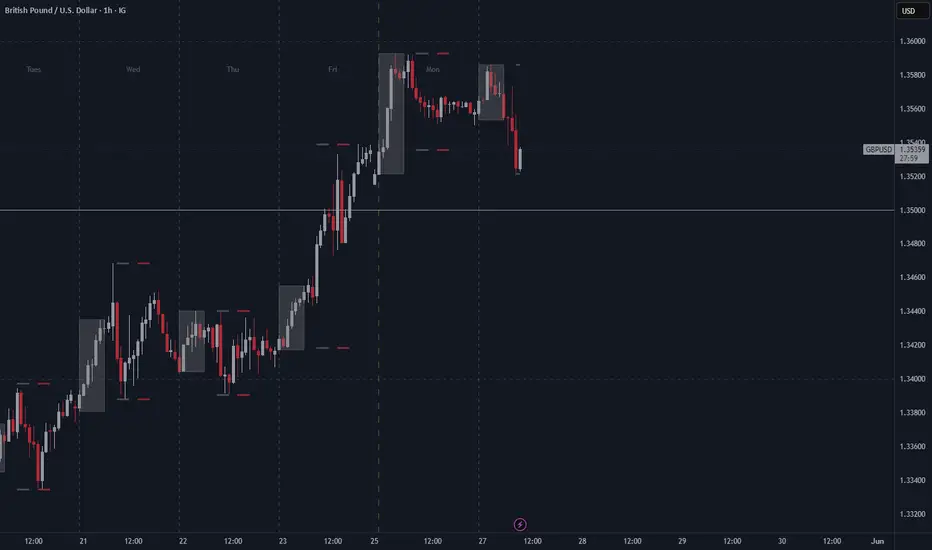
Market Analysis: GBP/USD RalliesMarket Analysis: GBP/USD Rallies
GBP/USD started a fresh increase above the 1.3520 zone.
Important Takeaways for GBP/USD Analysis Today
- The British Pound is eyeing more gains above the 1.3600 resistance.
- There is a key bullish trend line forming with support at 1.3540 on the hourly chart of GBP/USD at FXOpen.
GBP/USD Technical Analysis
On the hourly chart of GBP/USD at FXOpen, the pair formed a base above the 1.3350 level. The British Pound started a steady increase above the 1.3450 resistance zone against the US Dollar, as discussed in the previous analysis.
The pair gained strength above the 1.3500 level. The bulls even pushed the pair above the 1.3550 level and the 50-hour simple moving average. The pair tested the 1.3585 zone and is currently consolidating gains.
GBP/USD is stable above the 23.6% Fib retracement level of the upward move from the 1.3390 swing low to the 1.3586 high. There is also a key bullish trend line forming with support at 1.3540.
It seems like the bulls might aim for more gains. The RSI moved above the 60 level on the GBP/USD chart and the pair is now approaching a major hurdle at 1.3600.
An upside break above the 1.3600 zone could send the pair toward 1.3650. Any more gains might open the doors for a test of 1.3720. If there is a downside correction, immediate support is near the 1.3540 level and the trend line.
The first major support sits near the 50% Fib retracement level of the upward move from the 1.3390 swing low to the 1.3586 high at 1.3485. The next major support is 1.3450. If there is a break below 1.3450, the pair could extend the decline. The next key support is near the 1.3390 level. Any more losses might call for a test of the 1.3345 support.
This article represents the opinion of the Companies operating under the FXOpen brand only. It is not to be construed as an offer, solicitation, or recommendation with respect to products and services provided by the Companies operating under the FXOpen brand, nor is it to be considered financial advice.