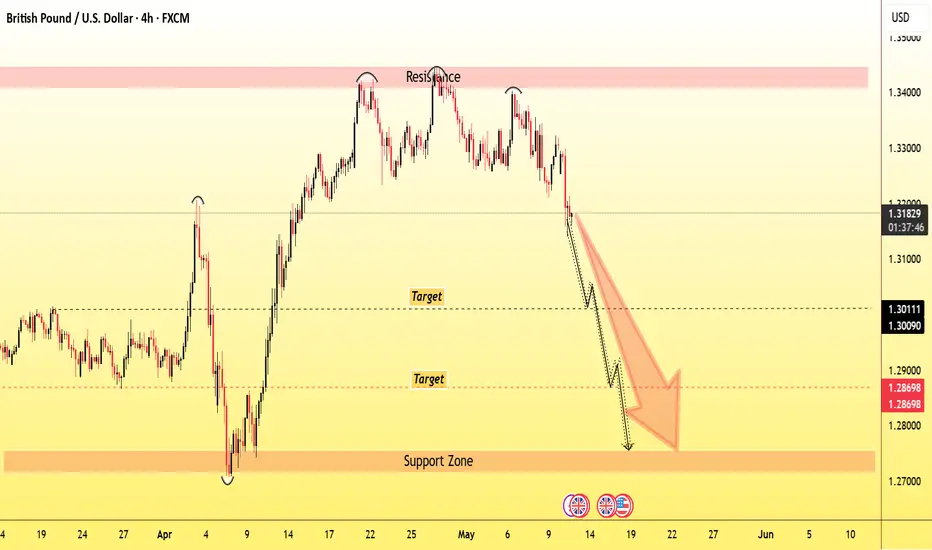
GBPUSD INVERSE CUP AND HANDLE PATTERNTechnical Overview
Resistance Level: 1.34400
Support Level: 1.27500
Bearish Targets: 1.30200 and 1.28800
The resistance at 1.34400 represents the peak before the formation of the inverted cup, serving as a critical level where selling pressure may intensify. The support at 1.27500 aligns with the neckline of the pattern; a decisive break below this level would confirm the bearish breakout, potentially leading to the projected targets.
📉 Trading Strategy
Consider entering a short position upon a confirmed break below the 1.27500 support level, accompanied by increased trading volume to validate the breakout.
Place a stop-loss order above the handle's peak, near 1.34400, to protect against false breakouts and limit potential losses.
Gbpusdshort
GBPUSDToday's other trade opportunity comes from the GBPUSD pair.
The first days of the week usually don’t behave exactly as expected — there's often volatility, fake moves, and false breakouts.
That's why I prefer to approach Mondays with a lower risk appetite.
🔍 Criteria:
✔️ Timeframe: 15M
✔️ Risk-to-Reward Ratio: 1:2
✔️ Trade Direction: Sell
✔️ Entry Price: 1.32940
✔️ Take Profit: 1.32690
✔️ Stop Loss: 1.33066
🔔 Disclaimer: This is not financial advice. It's a trade I’m taking based on my own system, shared purely for educational purposes.
📌 If you're also interested in systematic and data-driven trading strategies:
💡 Don’t forget to follow the page and subscribe to stay updated on future analyses.

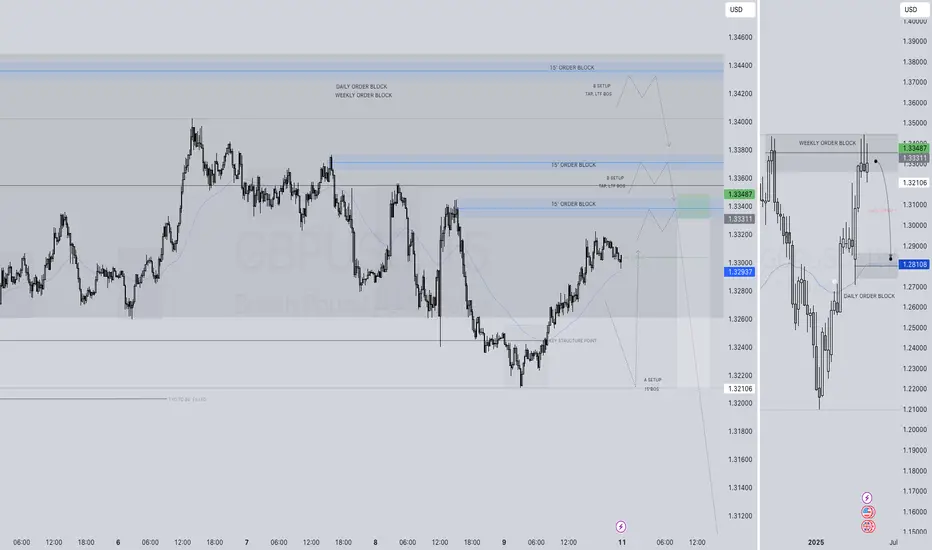
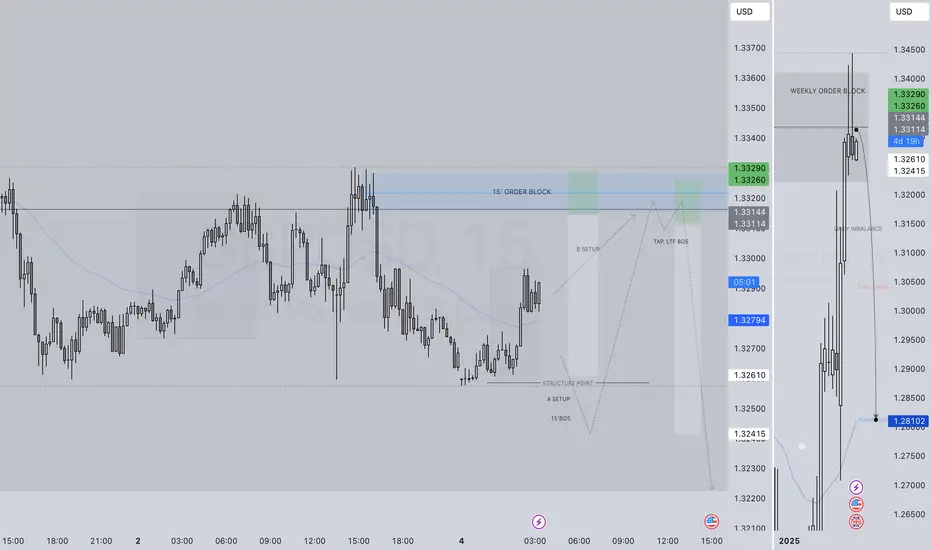
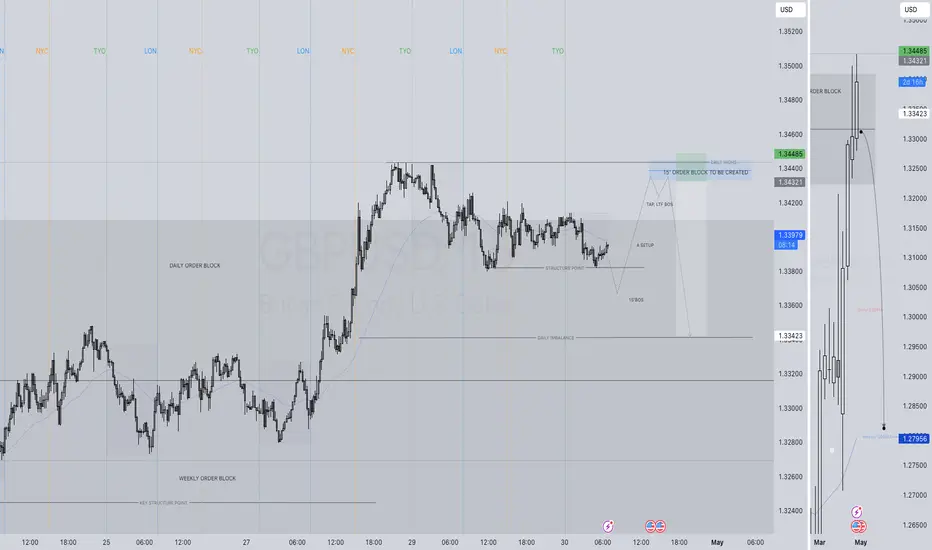
GBPUSD SHORT FORECAST Q2 W20 D12 Y25GBPUSD SHORT FORECAST Q2 W20 D12 Y25
Professional Risk Managers👋
Welcome back to another FRGNT chart update📈
Diving into some Forex setups using predominantly higher time frame order blocks alongside confirmation breaks of structure.
Let’s see what price action is telling us today!
💡Here are some trade confluences📝
✅Weekly order block rejection
✅Daily order block rejection
✅Intraday 15' order blocks
✅Tokyo ranges to be filled
🔑 Remember, to participate in trading comes always with a degree of risk, therefore as professional risk managers it remains vital that we stick to our risk management plan as well as our trading strategies.
📈The rest, we leave to the balance of probabilities.
💡Fail to plan. Plan to fail.
🏆It has always been that simple.
❤️Good luck with your trading journey, I shall see you at the very top.
🎯Trade consistent, FRGNT X
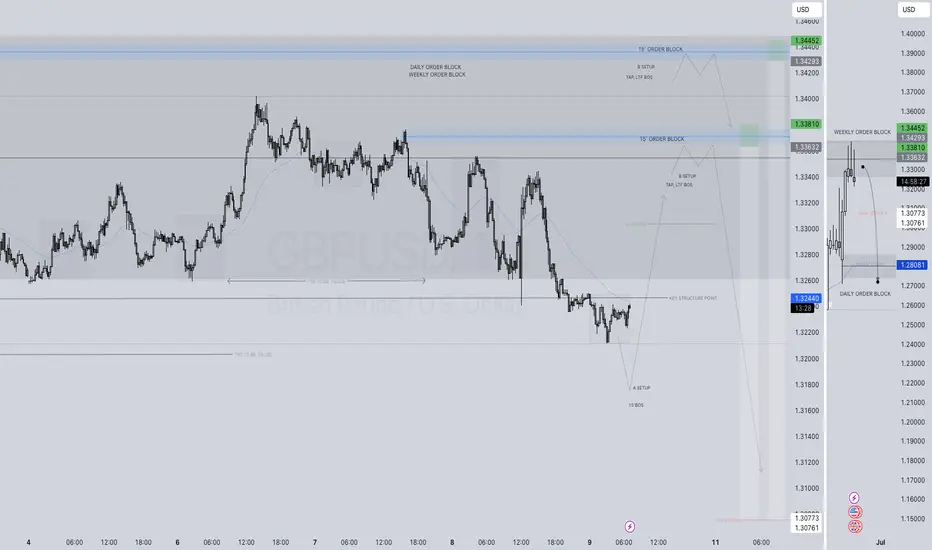
GBPUSD SHORT FORECAST Q2 W19 D9 Y25GBPUSD SHORT FORECAST Q2 W19 D9 Y25
Professional Risk Managers👋
Welcome back to another FRGNT chart update📈
Diving into some Forex setups using predominantly higher time frame order blocks alongside confirmation breaks of structure.
Let’s see what price action is telling us today!
💡Here are some trade confluences📝
✅Weekly order block rejection
✅Daily order block rejection
✅Intraday 15' order blocks
✅Tokyo ranges to be filled
🔑 Remember, to participate in trading comes always with a degree of risk, therefore as professional risk managers it remains vital that we stick to our risk management plan as well as our trading strategies.
📈The rest, we leave to the balance of probabilities.
💡Fail to plan. Plan to fail.
🏆It has always been that simple.
❤️Good luck with your trading journey, I shall see you at the very top.
🎯Trade consistent, FRGNT X
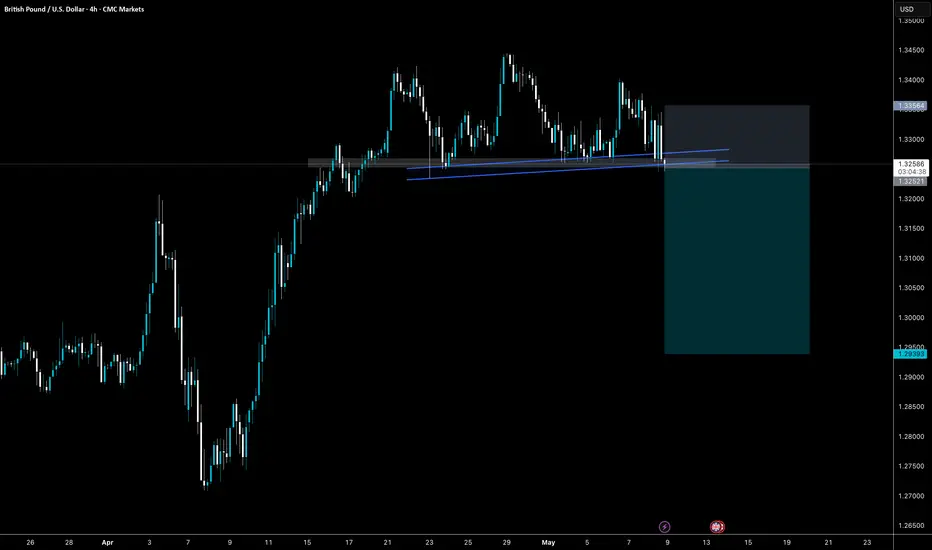
GBPUSD - Liquidity Grab & BoS Signals Bearish ReversalSmart Money Concepts (SMC) Analysis
1. Liquidity Sweep & Break of Structure (BOS):
Price consolidates above a trendline with multiple rejections (blue lines).
A liquidity grab occurs below this trendline – classic inducement setup.
After the grab, a bearish BOS (break of structure) is confirmed with a strong candle closing below the trendline and recent lows.
2. Order Block:
Price retested a 4H bearish order block (grey shaded zone) before rejection. This OB aligns with the last bullish candle before the drop.
Rejection from the OB confirms institutional interest (SMC).
3. Imbalance / Fair Value Gap (FVG):
The drop left a minor imbalance zone, suggesting possible continuation down to fill the inefficiency.
Price Action Analysis:
1. Trendline Break:
Ascending trendline has been broken with strong bearish momentum.
Indicates a shift from higher lows to lower lows → possible trend reversal.
2. Supply Zone Respect:
The price failed to make a new high and was firmly rejected at resistance.
Double top or lower high formation adds bearish confluence.
3. Target & Risk-Reward:
The trade setup indicates a short entry just below trendline break.
Target around 1.29393, likely based on previous demand zone or liquidity pocket.
Stop above 1.33664, likely above the OB or structural high.
Solid RRR (>3:1) visible.
Confluences Supporting Bearish Bias:
Break of internal structure (Price Action)
Liquidity sweep below trendline (SMC)
Bearish Order Block rejection (SMC)
Strong bearish engulfing candle
Favourable RR trade plan
Conclusion:
This is a high-probability bearish setup combining a trendline liquidity sweep (inducement), break of structure, order block rejection, and efficient risk-reward positioning. The price is expected to target 1.29393, aligning with a previous demand or liquidity zone.
Thanks for your time..
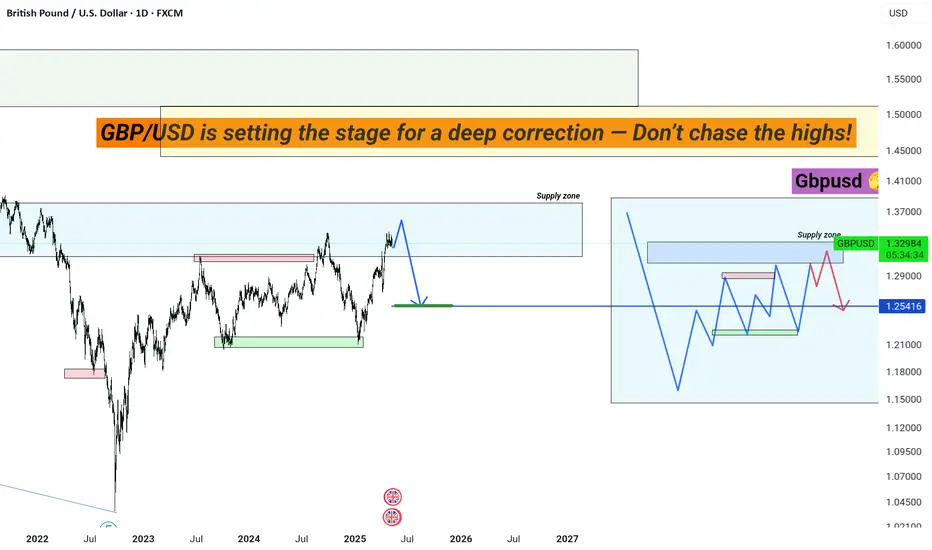
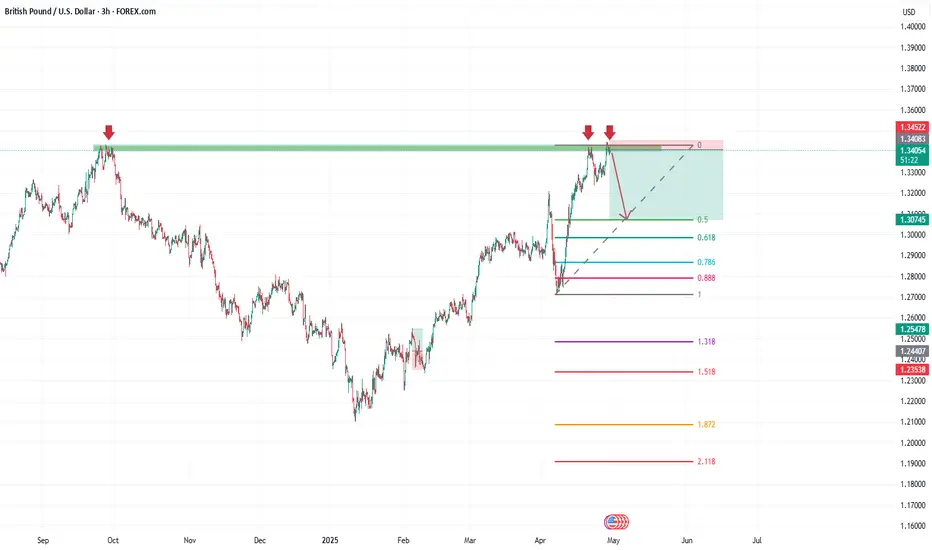
GBP/USD is setting the stage for a deep correction — Don’t chaseA Smart Money trap is unfolding as price enters a major supply zone. Prepare for a sharp move.
GBP/USD is now testing a critical supply zone near 1.3300–1.3500, where institutional sellers are likely to activate.
According to Smart Money Concept (SMC) and Market Structure, we are anticipating a liquidity grab followed by a deep corrective move towards the 1.2500–1.2300 demand zone.
Key Insights:
– Major Supply Zone: 1.3300–1.3500 is the key area for potential reversals
– Expected Move: Short-term bullish exhaustion → Strong sell-off towards 1.2500
– Mid-Term Outlook: After the correction, bullish continuation possible but only from lower demand zones
– Strategy: Wait for bearish confirmation at supply zone before selling | Look for buying opportunities closer to 1.2300 if structure shifts bullish
Smart traders wait for clean entries
GBPUSD SHORT FORECAST Q2 W19 D8 Y25GBPUSD SHORT FORECAST Q2 W19 D8 Y25
Professional Risk Managers👋
Welcome back to another FRGNT chart update📈
Diving into some Forex setups using predominantly higher time frame order blocks alongside confirmation breaks of structure.
Let’s see what price action is telling us today!
💡Here are some trade confluences📝
✅Weekly order block rejection
✅Daily order block rejection
✅Intraday 15' order blocks
✅Tokyo ranges to be filled
🔑 Remember, to participate in trading comes always with a degree of risk, therefore as professional risk managers it remains vital that we stick to our risk management plan as well as our trading strategies.
📈The rest, we leave to the balance of probabilities.
💡Fail to plan. Plan to fail.
🏆It has always been that simple.
❤️Good luck with your trading journey, I shall see you at the very top.
🎯Trade consistent, FRGNT X
GBPUSD SHORT FORECAST Q2 W19 D7 Y25GBPUSD SHORT FORECAST Q2 W19 D7 Y25
Professional Risk Managers👋
Welcome back to another FRGNT chart update📈
Diving into some Forex setups using predominantly higher time frame order blocks alongside confirmation breaks of structure.
Let’s see what price action is telling us today!
💡Here are some trade confluences📝
✅Weekly order block rejection
✅Daily order block rejection
✅Intraday 15' order blocks
✅Tokyo ranges to be filled
🔑 Remember, to participate in trading comes always with a degree of risk, therefore as professional risk managers it remains vital that we stick to our risk management plan as well as our trading strategies.
📈The rest, we leave to the balance of probabilities.
💡Fail to plan. Plan to fail.
🏆It has always been that simple.
❤️Good luck with your trading journey, I shall see you at the very top.
🎯Trade consistent, FRGNT X
GBPUSD SHORT FORECAST Q2 W19 D6 Y25GBPUSD SHORT FORECAST Q2 W19 D6 Y25
Professional Risk Managers👋
Welcome back to another FRGNT chart update📈
Diving into some Forex setups using predominantly higher time frame order blocks alongside confirmation breaks of structure.
Let’s see what price action is telling us today!
💡Here are some trade confluences📝
✅Weekly order block rejection
✅Daily order block rejection
✅Intraday 15' order blocks
✅Tokyo ranges to be filled
🔑 Remember, to participate in trading comes always with a degree of risk, therefore as professional risk managers it remains vital that we stick to our risk management plan as well as our trading strategies.
📈The rest, we leave to the balance of probabilities.
💡Fail to plan. Plan to fail.
🏆It has always been that simple.
❤️Good luck with your trading journey, I shall see you at the very top.
🎯Trade consistent, FRGNT X
GBPUSD UPDATE (NICE CHART)Hello friends
Given the failure of the pain and the strong growth of the price, you can see that the price is in correction, which is a good opportunity for safe purchases at the indicated support points, of course with capital and risk management...
*Trade safely with us*

GBPUSD SHORT FORECAST Q2 W19 D5 Y25GBPUSD SHORT FORECAST Q2 W19 D5 Y25
Professional Risk Managers👋
Welcome back to another FRGNT chart update📈
Diving into some Forex setups using predominantly higher time frame order blocks alongside confirmation breaks of structure.
Let’s see what price action is telling us today!
💡Here are some trade confluences📝
✅Weekly order block rejection
✅Daily order block rejection
✅Intraday 15' order blocks
✅Tokyo ranges to be filled
🔑 Remember, to participate in trading comes always with a degree of risk, therefore as professional risk managers it remains vital that we stick to our risk management plan as well as our trading strategies.
📈The rest, we leave to the balance of probabilities.
💡Fail to plan. Plan to fail.
🏆It has always been that simple.
❤️Good luck with your trading journey, I shall see you at the very top.
🎯Trade consistent, FRGNT X
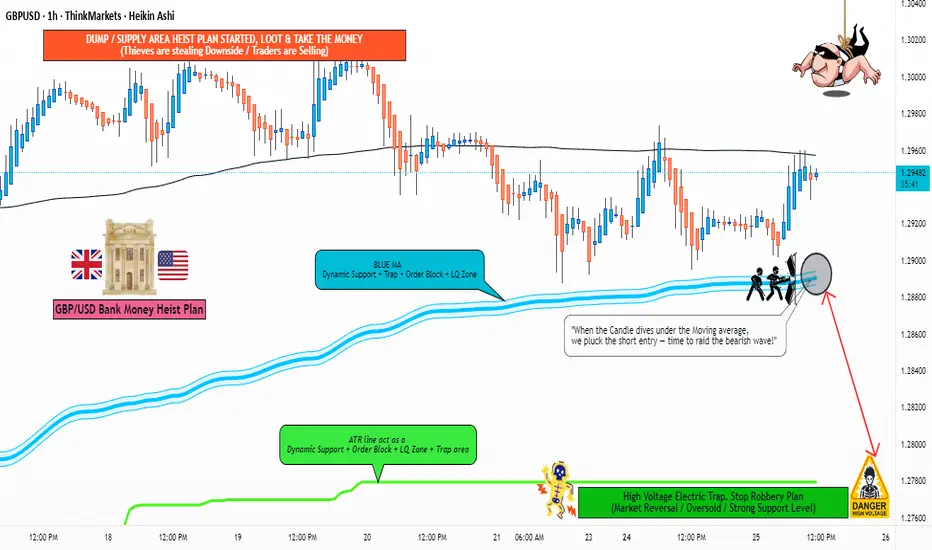
GBP/USD "The Cable" Forex Bank Heist Plan (Scalping / Day Trade)🌟Hi! Hola! Ola! Bonjour! Hallo! Marhaba!🌟
Dear Money Makers & Robbers, 🤑💰✈️
Based on 🔥Thief Trading style technical and fundamental analysis🔥, here is our master plan to heist the GBP/USD "The Cable" Forex Bank. Please adhere to the strategy I've outlined in the chart, which emphasizes short entry. Our aim is the high-risk Green Zone. Risky level, oversold market, consolidation, trend reversal, trap at the level where traders and bullish robbers are stronger. 🏆💸Book Profits Be wealthy and safe trade.💪🏆🎉
Entry 📈 : "The heist is on! Wait for the breakout (1.28877) then make your move - Bearish profits await!"
however I advise placing Sell Stop Orders below the breakout MA or Place Sell limit orders within a 15 or 30 minute timeframe. Entry from the most recent or closest low or high level should be in retest. I Highly recommended you to put alert in your chart.
📌I strongly advise you to set an "alert (Alarm)" on your chart so you can see when the breakout entry occurs.
Stop Loss 🛑: Thief SL placed at 1.29600 (swing / Day Trade Basis) Using the 2H period, the recent / swing high or low level.
SL is based on your risk of the trade, lot size and how many multiple orders you have to take.
Target 🎯: 1.27800 (or) Escape Before the Target
🧲Scalpers, take note 👀 : only scalp on the Short side. If you have a lot of money, you can go straight away; if not, you can join swing traders and carry out the robbery plan. Use trailing SL to safeguard your money 💰.
GBP/USD "The Cable" Forex Bank Heist Plan (Scalping / Day Trade) is currently experiencing a bearishness,., driven by several key factors.
📰🗞️Get & Read the Fundamental, Macro, COT Report, Quantitative Analysis, Sentimental Outlook, Intermarket Analysis, Future trend targets.. go ahead to check 👉👉👉
⚠️Trading Alert : News Releases and Position Management 📰 🗞️ 🚫🚏
As a reminder, news releases can have a significant impact on market prices and volatility. To minimize potential losses and protect your running positions,
we recommend the following:
Avoid taking new trades during news releases
Use trailing stop-loss orders to protect your running positions and lock in profits
💖Supporting our robbery plan 💥Hit the Boost Button💥 will enable us to effortlessly make and steal money 💰💵. Boost the strength of our robbery team. Every day in this market make money with ease by using the Thief Trading Style.🏆💪🤝❤️🎉🚀
I'll see you soon with another heist plan, so stay tuned 🤑🐱👤🤗🤩
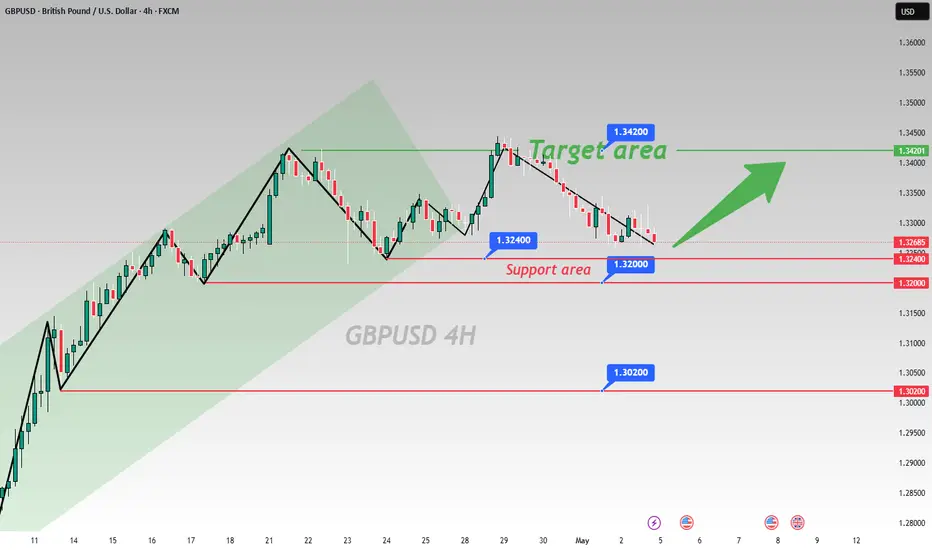
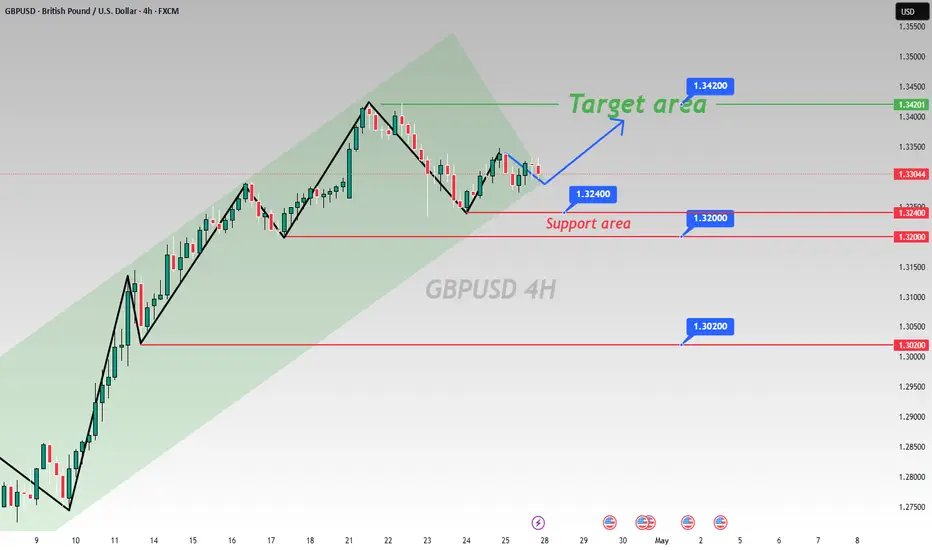
GBP/USD Trend JudgmentTechnical Analysis of GBPUSD 4 - hour Chart
Support Level Analysis
Several key support levels are clearly marked in the chart. 1.32000 is a strong support level. If the price drops to this level, it may bounce back due to the buying support formed by past intensive trading 📈. 1.32400 is near the current price and also plays a certain supporting role. The price fluctuating around this level reflects the tug - of - war between bulls and bears here 🤼. 1.30200 is an important support level further down. Once the price breaks below 1.32000, it may further test this level 📉.
Target Level Analysis
The target area is around 1.34200. Judging from the chart trend, the price previously had upward - fluctuating momentum 💹. If the current price can break through the short - term downward trend and is accompanied by trading volume, and the bullish force continues to strengthen, the price is expected to move upward towards the 1.34200 target area 🚀. This target area is derived from the high points of previous price fluctuations and trend lines. It has certain resistance, but once broken, it can open up the upper space 🚪.
Trend Judgment
Currently, the price is in a relatively volatile downward trend, but the lower support levels may change the price trend. If the price obtains effective support at the support levels and forms a reversal signal (such as a bullish engulfing pattern, etc.) 📊, an upward trend is expected to start. Investors can pay attention to the performance of the price at the support levels. If the support is effective, they can try to go long, with the stop - loss set below the support level; if the price breaks below the support level, they can consider going short, with the target looking towards the lower support level 📌.
⚡⚡⚡ GBPUSD ⚡⚡⚡
🚀 Buy@1.32000 - 1.32400
🚀 TP 1.33500 - 1.34000
Accurate signals are updated every day 📈 If you encounter any problems during trading, these signals can serve as your reliable guide 🧭 Feel free to refer to them! I sincerely hope they'll be of great help to you 🌟 👇
GBPUSD short to Asia's lowGBPUSD is showing bearish sentiment. We are in a downtrend for a few days now. It may reverse today with the news but until then my bias is bearish. I am taking a short to Asian session's low. Let's see if it play's out.
I normally don't like to go against the higher timeframe trend, especially in a possible reversal zone. So if you take the same trade, use less risk.
Once the market shows signs of reversal, we can ride it back up.
GBPUSD SHORT FORECAST Q2 W18 D1 Y25GBPUSD SHORT FORECAST Q2 W18 D1 Y25
Professional Risk Managers👋
Welcome back to another FRGNT chart update📈
Diving into some Forex setups using predominantly higher time frame order blocks alongside confirmation breaks of structure.
Let’s see what price action is telling us today!
💡Here are some trade confluences📝
✅Weekly order block rejection
✅Daily order block rejection
✅Daily high rejection
✅Daily imbalance fill targets
🔑 Remember, to participate in trading comes always with a degree of risk, therefore as professional risk managers it remains vital that we stick to our risk management plan as well as our trading strategies.
📈The rest, we leave to the balance of probabilities.
💡Fail to plan. Plan to fail.
🏆It has always been that simple.
❤️Good luck with your trading journey, I shall see you at the very top.
🎯Trade consistent, FRGNT X

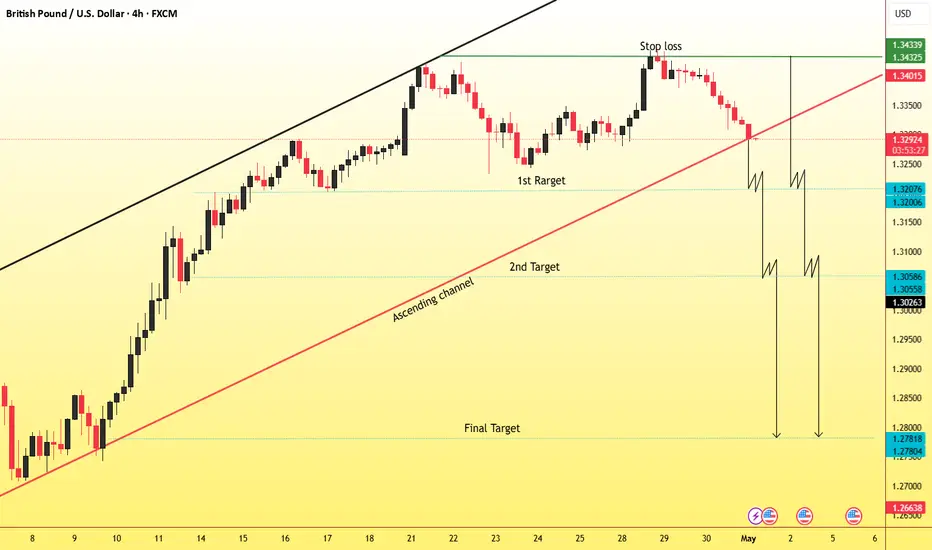
GBPUSD STRONG BEARISH PATTERN (H4)Bearish Scenario for GBP/USD
Current Sentiment: The GBP/USD market is displaying a continuous bearish pattern, indicating strong selling pressure. Price action suggests that bears are in control, pushing the pair lower through support levels.
Entry: Price is currently trending downwards after a potential lower high formation, breaking key support zones.
Bearish Targets:
1st Target: 1.32000 – This level aligns with a minor support area where previous consolidation occurred. A breach here confirms continued selling momentum.
2nd Target: 1.30600 – Historical support level; expect a potential short-term bounce or consolidation.
Final Target: 1.28100 – Major support level from previous long-term lows. A break below this could signal a shift in the broader market structure.
Thu 1st May 2025 GBP/USD Daily Forex Chart Sell SetupGood morning fellow traders. On my Daily Forex charts using the High Probability & Divergence trading methods from my books, I have identified a new trade setup this morning. As usual, you can read my notes on the chart for my thoughts on this setup. The trade being a GBP/USD Sell. Enjoy the day all. Cheers. Jim
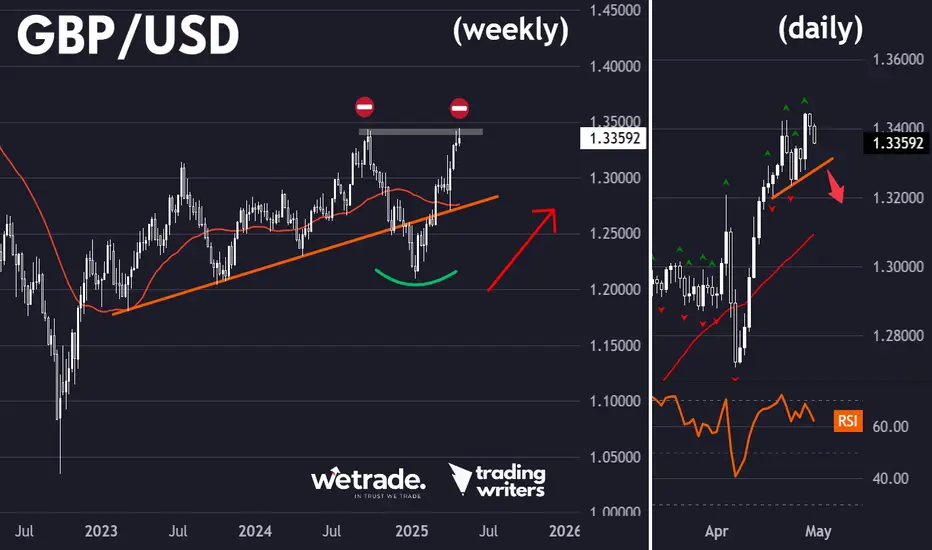
Double top mate! (GBP/USD)OK, it's not really a double top (although lots of people refer to these situations as such)
It's a re-test of the long term high and could see the current uptrend get rejected.
Can look to the daily chart for confirmation of the breakdown
Thoughts?
GBPUSD(20250430)Today's AnalysisMarket news:
The European Central Bank expects prices to rise 2.9% over the next 12 months, up from 2.6% in February, according to a monthly survey released on Tuesday. This is the highest level since April 2024. The three-year indicator rose slightly to 2.5%. The ECB's first five-year forecast was 2.1%.
Technical analysis:
Today's buying and selling boundaries:
1.3409
Support and resistance levels:
1.3471
1.3448
1.3433
1.3385
1.3370
1.3347
Trading strategy:
If the price breaks through 1.3409, consider buying, the first target price is 1.3433
If the price breaks through 1.3385, consider selling, the first target price is 1.3370
GBPUSD SHORT FORECAST Q2 W18 D30 Y25GBPUSD SHORT FORECAST Q2 W18 D30 Y25
Professional Risk Managers👋
Welcome back to another FRGNT chart update📈
Diving into some Forex setups using predominantly higher time frame order blocks alongside confirmation breaks of structure.
Let’s see what price action is telling us today!
💡Here are some trade confluences📝
✅Weekly order block rejection
✅Daily order block rejection
✅Daily high rejection
✅Daily imbalance fill targets
🔑 Remember, to participate in trading comes always with a degree of risk, therefore as professional risk managers it remains vital that we stick to our risk management plan as well as our trading strategies.
📈The rest, we leave to the balance of probabilities.
💡Fail to plan. Plan to fail.
🏆It has always been that simple.
❤️Good luck with your trading journey, I shall see you at the very top.
🎯Trade consistent, FRGNT X
GBPUSD SELL/SHORTBy utilizing levels, historical patterns, , we can formulate a hypothesis that the market might follow a similar trajectory if bearish sentiment prevails.
GBP/USD Opening Trends and Trading Strategies Next WeekTrend Analysis
Examining the 4 - hour chart of GBP/USD, the pair is distinctly navigating an upward trend. A series of successive higher highs and higher lows have been established, serving as a robust testament to the dominant strength of the bulls 🐂. This upward momentum indicates that the bulls are firmly in the driver's seat, consistently pushing the price higher and maintaining control over the market sentiment.
Key Levels
Support Area
The 1.3200 - 1.3240 range emerges as a crucial support zone on the chart. Historical price action reveals multiple instances where the price has found strong support in this area, bouncing back with resilience each time it approached. This repeated pattern underscores the presence of substantial buying pressure, as market participants actively step in to defend this price level. Should the price retrace towards this support zone again, it could potentially present a lucrative opportunity for traders to initiate long positions 💰.
Target Area
The 1.3420 mark has been identified as a significant target level. In the event that the price successfully breaks free from its current consolidation phase and continues its upward trajectory, there is a strong expectation that it will advance towards this target price. This level represents a potential milestone for the bullish rally, and reaching it would further validate the strength of the upward trend 🎯.
Trading Strategy
Long - position Strategy
For traders looking to capitalize on the bullish trend, a well - timed entry point could present itself when the price retraces to the 1.3200 - 1.3240 support area. Once there, the appearance of a bullish candlestick pattern, such as a hammer or an engulfing pattern, can serve as a signal to consider entering a long position. To manage risk effectively, it is advisable to set the stop - loss just below the support area, protecting against any unexpected downward movements. With the 1.3420 target area in sight, traders can aim for a profitable trade as the price moves in the anticipated upward direction 📈.
⚡⚡⚡ GBPUSD ⚡⚡⚡
🚀 Buy@1.32000 - 1.32400
🚀 TP 1.33500 - 1.34000
Accurate signals are updated every day 📈 If you encounter any problems during trading, these signals can serve as your reliable guide 🧭 Feel free to refer to them! I sincerely hope they'll be of great help to you 🌟
GBPUSD Sell and Buy Trading PlanH4 - We have a clean bullish trend with the price creating a series of higher highs, higher lows structure
This strong bullish move ended with a bearish divergence
While measuring this strong bullish move using the Fibonacci retracement tool we have two key support zones that has formed (marked in green)
So based on this I expect short term bearish moves now towards the Fibonacci support zones and then continuation higher.
If you enjoy this idea, don’t forget to LIKE 👍, FOLLOW ✅, SHARE 🙌, and COMMENT ✍! Drop your thoughts and charts below to keep the discussion going. Your support helps keep this content free and reach more people! 🚀
--------------------------------------------------------------------------------------------------------------------
Disclosure: I am part of Trade Nation's Influencer program and receive a monthly fee for using their TradingView charts in my analysis.
