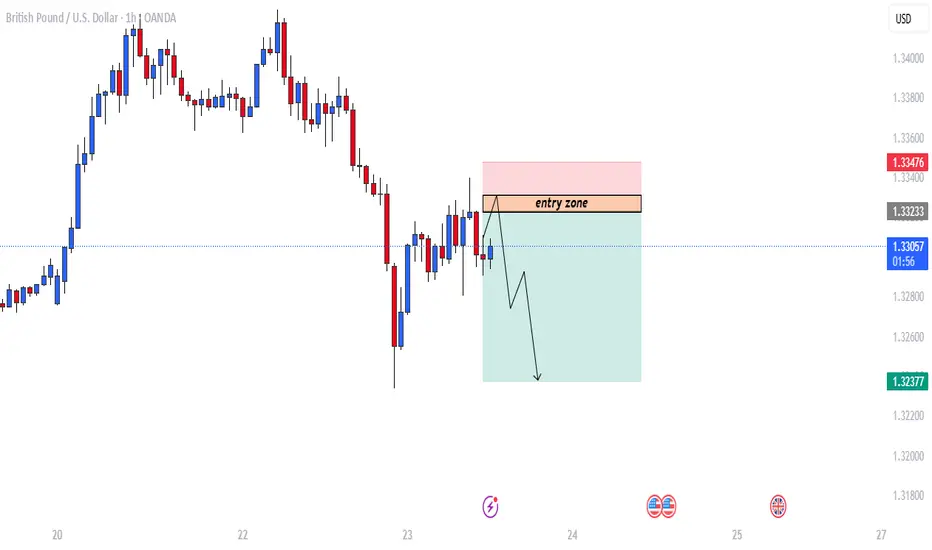
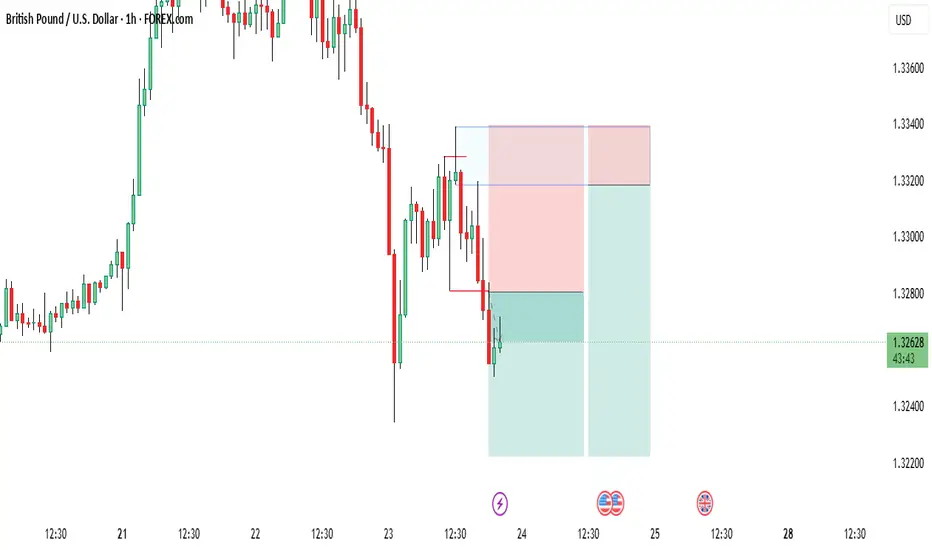
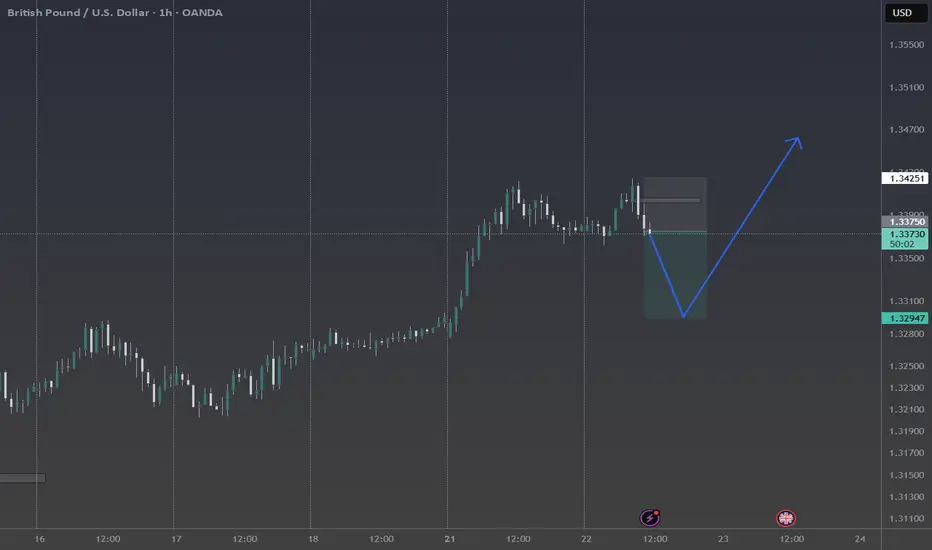
GBPUSD trade setup.This chart shows a GBP/USD (British Pound / U.S. Dollar) trading setup on the 1-hour timeframe, with a bearish outlook.
📊 Chart Analysis
Trend: Recently bearish after a previous uptrend.
Entry Zone: Area between approximately 1.33233 and 1.33317.
Setup Type: Sell/Short Trade Setup
🔍 Key Zones
Entry Zone (Supply/Resistance Area):
Marked as "entry zone".
This is the expected area where price might retrace to before dropping again.
Target Zone:
Arrow points down towards 1.32377, suggesting this is the Take Profit (TP) level.
Stop Loss (SL):
Slightly above the entry zone, near 1.33476, indicating risk management in case price continues upward.
🧠 Trade Idea Summary
Type: Short/Sell
Entry: Wait for price to re-enter the marked "entry zone" (~1.33233 - 1.33317).
Stop Loss: Above 1.33476.
Take Profit: Around 1.32377.
Risk/Reward Ratio: Favorable, as the potential profit zone (green area) is larger than the risk (red area).
Gbpusdshort
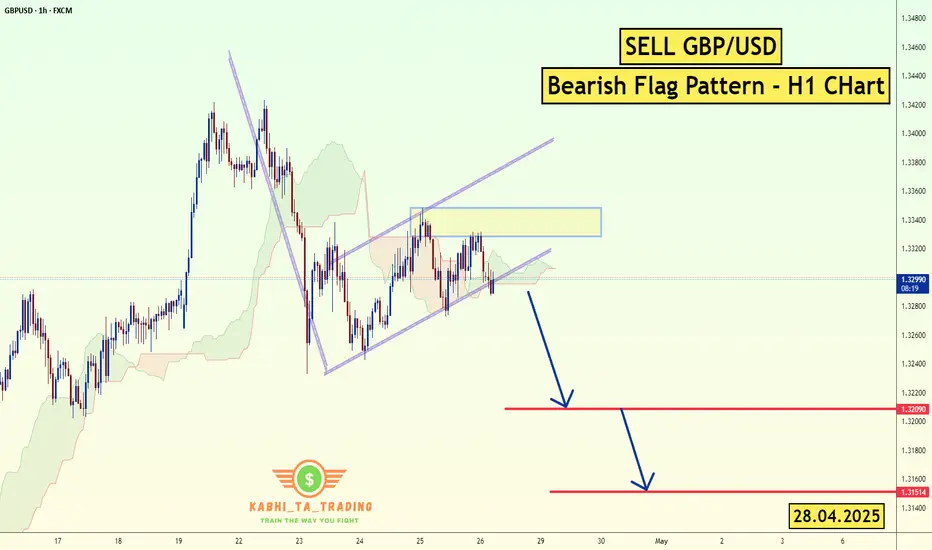
GBP/USD - H1 - Bearish Flag (28.04.2025)FX:GBPUSD The GBP/USD Pair on the H1 timeframe presents a Potential Selling Opportunity due to a recent Formation of a Bearish Flag Pattern. This suggests a shift in momentum towards the downside in the coming hours.
Possible Short Trade:
Entry: Consider Entering A Short Position around Trendline Of The Pattern.
Target Levels:
1st Support – 1.3209
2nd Support – 1.3151
🎁 Please hit the like button and
🎁 Leave a comment to support for My Post !
Your likes and comments are incredibly motivating and will encourage me to share more analysis with you.
Best Regards, KABHI_TA_TRADING
Thank you.
Fundamental Update :
on Monday as the trade tensions between the U.S. and China provided some relief to investors, while a stronger dollar further weighed on prices.
The U.S. dollar TVC:DXY rose 0.2% against a basket of currencies, making bullion more expensive for overseas buyers. TVC:DJI SP:SPX NASDAQ:IXIC also rising .
GBPUSD(20250428)Today's AnalysisMarket news:
The Fed's subsequent policy path considers two scenarios: First, there is no substantial progress in the negotiations between the United States and its trading partners. After 90 days, the US tariffs are still high. Weakened economic demand may prompt the Fed to cut interest rates starting in July, and the annual rate cut may reach 100 basis points; second, the negotiations are fruitful, tariffs are reduced, and the demand shock is small, but inflationary pressure continues. The Fed may postpone easing and only cut interest rates slightly in December. For the market, although the easing comes early in the first scenario, the "recession-style" rate cut may suppress risky assets.
Technical analysis:
Today's buying and selling boundaries:
1.3309
Support and resistance levels:
1.3379
1.3353
1.3336
1.3282
1.3265
1.3239
Trading strategy:
If the price breaks through 1.3309, consider buying, the first target price is 1.3336
If the price breaks through 1.3282, consider selling, the first target price is 1.3265
#GBPUSD: Major Swing Sell Coming On GU, What's your views? OANDA:GBPUSD , as discussed in our previous analysis, where we predicted price would reach our target area and then reject it. The price has almost reached this area, and we are now waiting for it to fully complete the move so that we can take a swing sell on the GBP. Currently, the British pound is stronger and bullish due to the UK’s strong economic growth. However, this is not the case for the US dollar. The dollar is struggling to keep up with other currencies and is currently the worst-performing currency of the month of April.
While focusing on GBPUSD as a pair, it has been extremely bullish since the start of April. However, we are now at a point where there are no strong reasons for the pair to remain bullish and continue its uptrend. There are fundamental signs that will eventually reverse the bearish trend.
Our advice to all is to wait for the price to do its thing. Once it reaches our target area, it may show strong bearish dominance. However, this is not a guarantee that it will behave as we expect. There are two targets that you can focus on once you trade is activated.
Good luck and trade safely!
Thank you for your unwavering support! 😊
If you’d like to contribute, here are a few ways you can help us:
- Like our ideas
- Comment on our ideas
- Share our ideas
Team Setupsfx_
❤️🚀
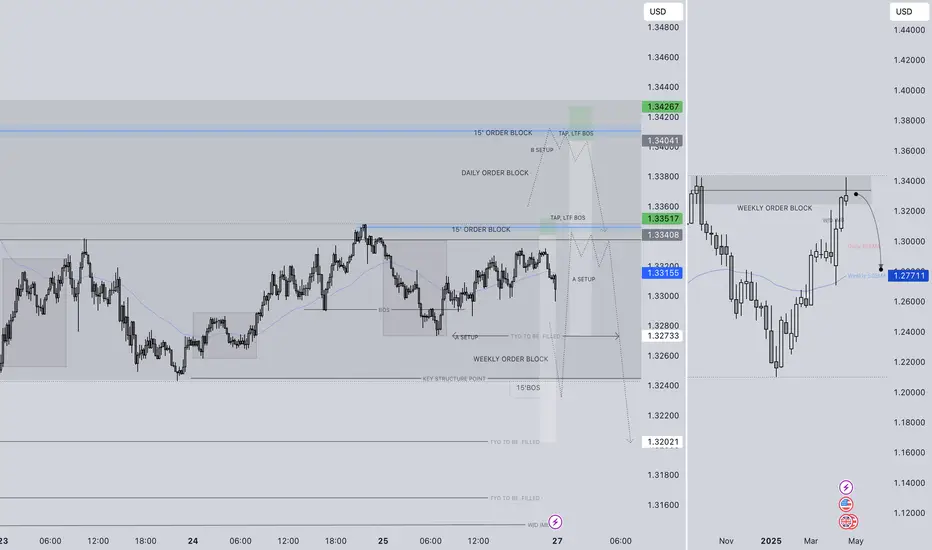
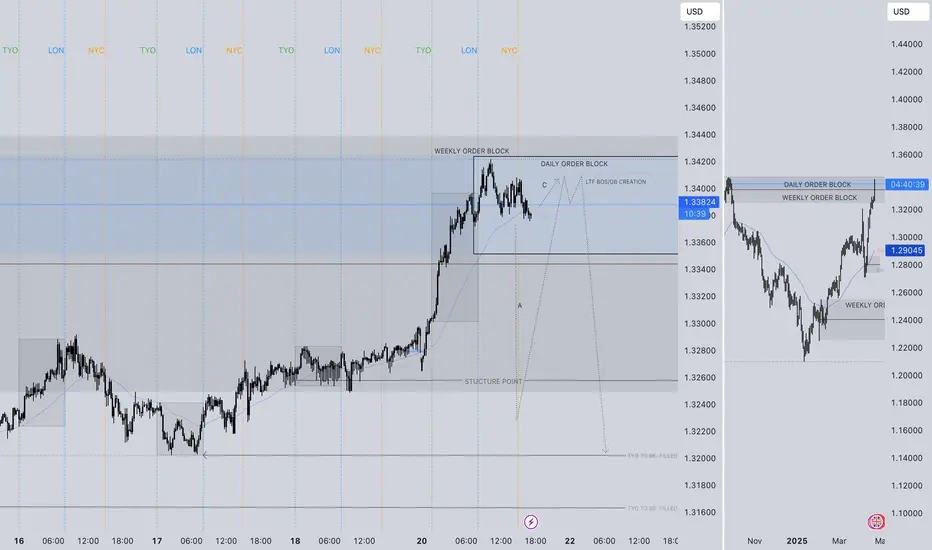
GBPUSD SHORT FORECAST Q2 W18 D28 Y25GBPUSD SHORT FORECAST Q2 W18 D28 Y25
Professional Risk Managers👋
Welcome back to another FRGNT chart update📈
Diving into some Forex setups using predominantly higher time frame order blocks alongside confirmation breaks of structure.
Let’s see what price action is telling us today!
💡Here are some trade confluences📝
✅Weekly order block rejection
✅Daily order block rejection
✅Weekly imbalance to fill short
✅15’ order block
🔑 Remember, to participate in trading comes always with a degree of risk, therefore as professional risk managers it remains vital that we stick to our risk management plan as well as our trading strategies.
📈The rest, we leave to the balance of probabilities.
💡Fail to plan. Plan to fail.
🏆It has always been that simple.
❤️Good luck with your trading journey, I shall see you at the very top.
🎯Trade consistent, FRGNT X
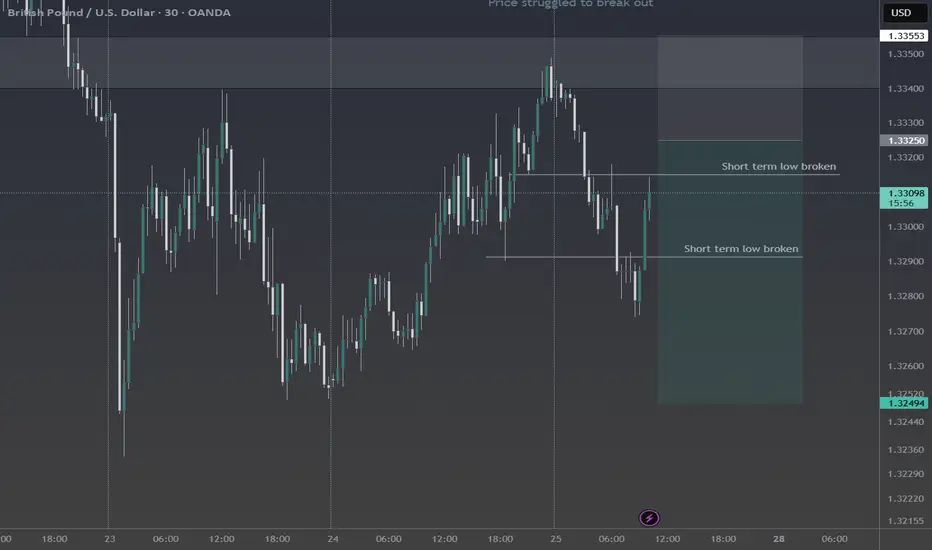
GBPUSD to retrace lowerGBPUSD is in a retracement right now after a rally to the upside.
It struggled to break out back to the upside yesterday and has been bearish today, breaking multiple short term lows.
The bias for me today is bearish but keep in mind we are in an uptrend in the higher timeframes.
GBPUSD(20250425)Today's AnalysisMarket news:
Federal Reserve-①Hamack: If economic data is clear, the Fed may cut interest rates in June
②Waller: It will take until July to get a clearer understanding of how tariffs affect the economy. If tariffs lead to higher unemployment, interest rate cuts may be initiated. ③The Atlanta Fed GDPNow model predicts that the US GDP growth rate in the first quarter will be -2.5%. ④Kashkari: The frequent announcements from Washington have brought challenges to policymakers and everyone.
Technical analysis:
Today's buying and selling boundaries:
1.3311
Support and resistance levels:
1.3411
1.3374
1.3350
1.3274
1.3248
1.3211
Trading strategy:
If the price breaks through 1.3350, consider buying, the first target price is 1.3374
If the price breaks through 1.3311, consider selling, the first target price is 1.3274
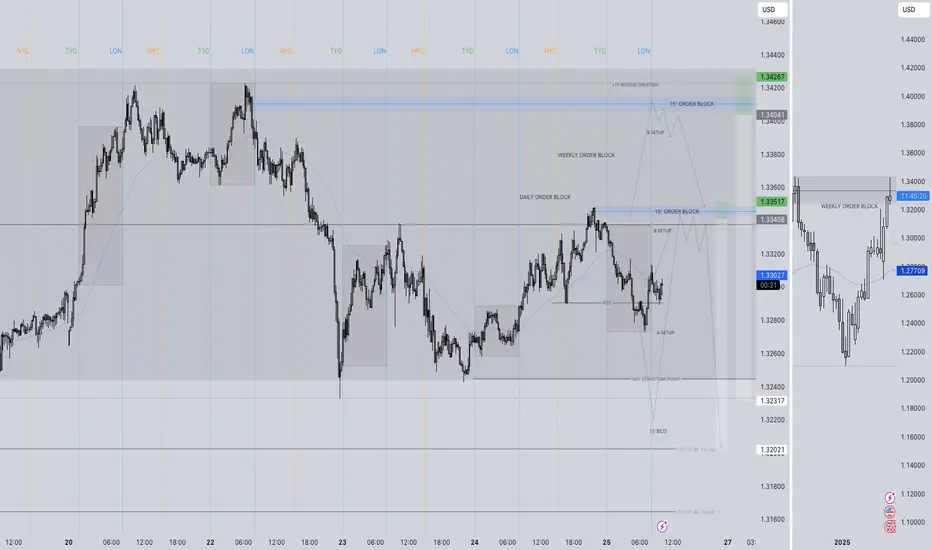
GBPUSD SHORT FORECAST Q2 W17 D25 Y25GBPUSD SHORT FORECAST Q2 W17 D25 Y25
Professional Risk Managers👋
Welcome back to another FRGNT chart update📈
Diving into some Forex setups using predominantly higher time frame order blocks alongside confirmation breaks of structure.
Let’s see what price action is telling us today!
💡Here are some trade confluences📝
✅Weekly order block rejection
✅Daily order block rejection
✅15’ order block
✅Tokyo ranges to be filled
🔑 Remember, to participate in trading comes always with a degree of risk, therefore as professional risk managers it remains vital that we stick to our risk management plan as well as our trading strategies.
📈The rest, we leave to the balance of probabilities.
💡Fail to plan. Plan to fail.
🏆It has always been that simple.
❤️Good luck with your trading journey, I shall see you at the very top.
🎯Trade consistent, FRGNT X
#gbpusdThe price can return to the signal range and we enter the trade there. There are two levels, one with low risk and the other with higher risk, and you can enter at both levels.
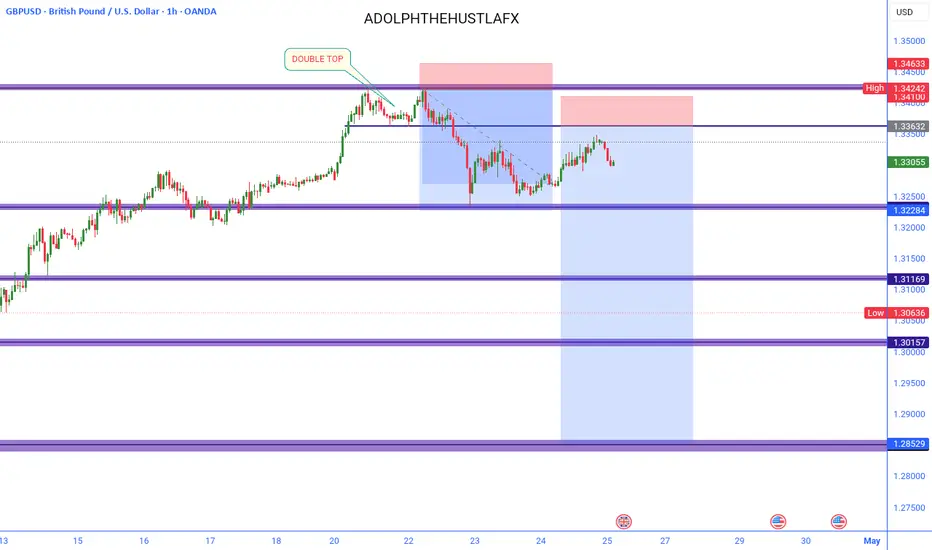
GBPUSD is bearish (selling)GBPUSD has clearly rejected the 1,34235 monthly resistance level, a key area that previously in September 2024 acted as our major zone. Using price action my entry confirmation was after the formation of a Bearish signal ( DOUBLE TOP ) on H1
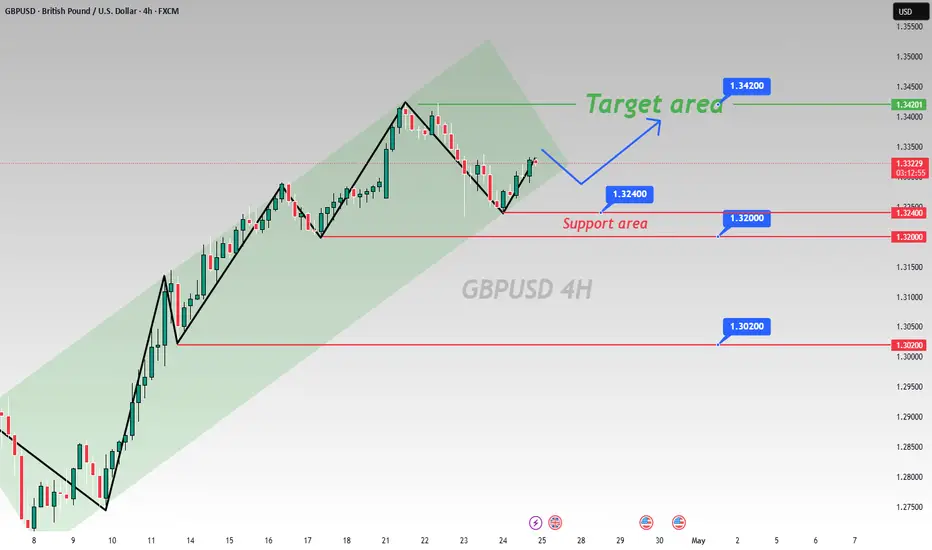
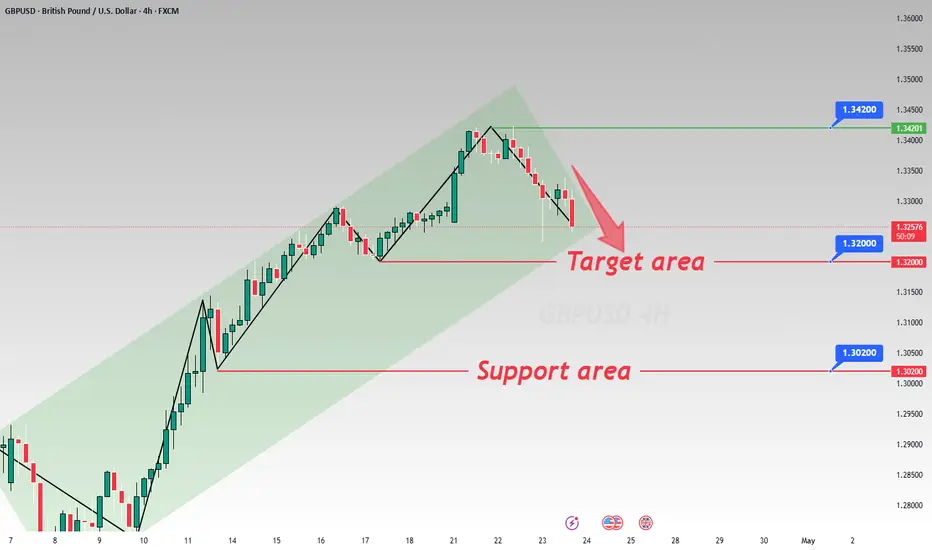
Analysis of GBPUSD 4 - hour ChartAnalysis of GBPUSD 4H Chart
Trend Analysis
From the 4 - hour chart, GBPUSD is generally in an uptrend. The price fluctuations have formed a series of higher highs and higher lows, indicating that the bulls are in control 🐂.
Key Levels
Support Area: The range of 1.3200 - 1.3240 is clearly marked as an important support area in the chart. Previously, the price has rebounded near this area multiple times, suggesting that there is strong buying pressure in this area. If the price retraces to this area again, it may present a potential opportunity to go long 💰.
Target Area: 1.3420 is marked as the target area. If the price breaks through the current consolidation range and continues its upward trend, it is expected to move towards this target price level 🎯.
Trading Strategy
Long - position Strategy: When the price retraces to the 1.3200 - 1.3240 support area and a bullish candlestick pattern appears, one may consider entering a long position. Set the stop - loss just below the support area, and target the 1.3420 target area 📈.
⚡⚡⚡ GBPUSD ⚡⚡⚡
🚀 Buy@1.32000 - 1.32400
🚀 TP 1.33500 - 1.34000
Accurate signals are updated every day 📈 If you encounter any problems during trading, these signals can serve as your reliable guide 🧭 Feel free to refer to them! I sincerely hope they'll be of great help to you 🌟
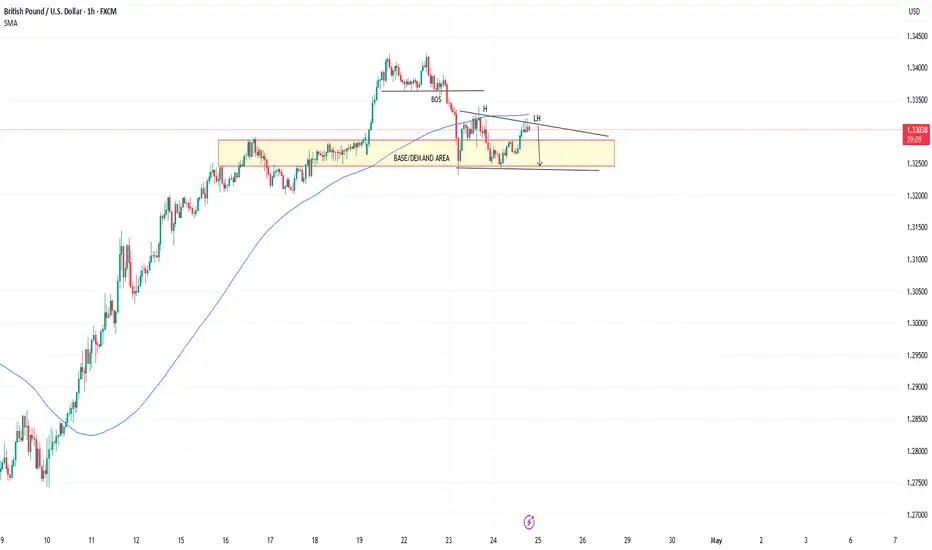
GBPUSD TRADE PLAN H1GBPUSD TF H1
SELL/SHORT PLAN
cancel if price break ma100(blue),or price break structure
take profit max 1.32000
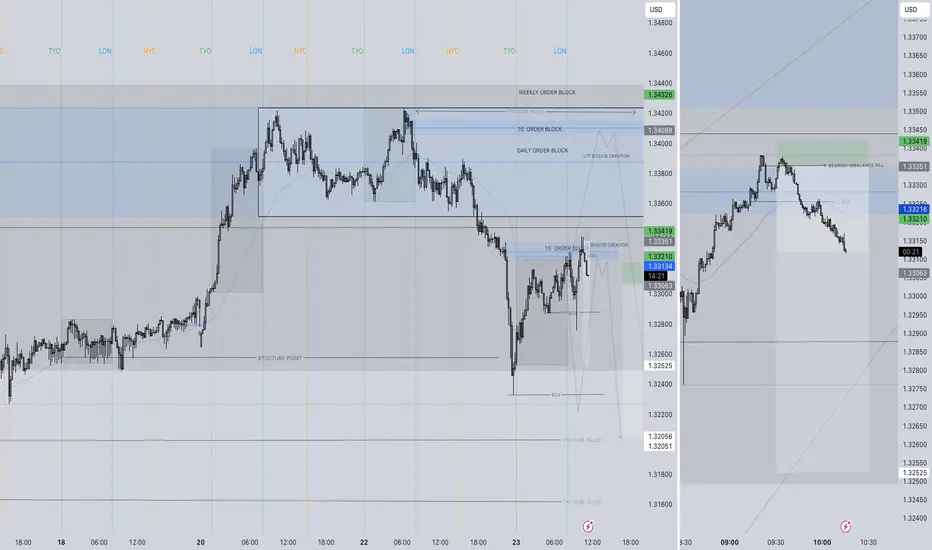
GBPUSD SHORT FORECAST Q2 W17 D23 Y25 1' ENTRY MODEL EDUCATIONGBPUSD SHORT FORECAST Q2 W17 D23 Y25 1' ENTRY MODEL EDUCATION
Professional Risk Managers👋
Welcome back to another FRGNT chart update📈
Diving into some Forex setups using predominantly higher time frame order blocks alongside confirmation breaks of structure.
Let’s see what price action is telling us today!
💡Trade confluences📝
✅Weekly Order block rejection
✅15’ order block created
✅15’ wick rejections via order block
✅Intraday bearish breaks of structure
✅Tokyo ranges to be filled
✅1’ break of structure
✅1’ bearish engulfing candle fill
✅Sell limit order on the 1’ candle fill
✅Sell limit order via 1' order block created upon 1' break of structure
🔑 Remember, to participate in trading comes always with a degree of risk, therefore as professional risk managers it remains vital that we stick to our risk management plan as well as our trading strategies.
📈The rest, we leave to the balance of probabilities.
💡Fail to plan. Plan to fail.
🏆It has always been that simple.
❤️Good luck with your trading journey, shall see you at the very top.
🎯Trade consistent, FRGNT X

As the dollar's weak trend signals an endTrump's remarks and attitudes in trade negotiations have had a significant impact on the market 📈💥
His change in attitude towards the Federal Reserve Chairman first triggered investors' concerns about the Fed's policy, leading them to seek refuge in gold and causing the price of gold to rise 🏆🚀. Later, his remarks alleviated those concerns, prompting funds to flow back into dollar-denominated assets and causing the price of gold to decline from its peak levels 📉💔
In terms of trade negotiations, potential easing measures may reduce the demand for gold as a safe-haven asset ⏳
Taken together, these factors may imply that market confidence in the dollar has been somewhat restored 🌟. When signs of the end of the dollar's weak trend emerge 📊, more funds flow into dollar assets 💸. Against the backdrop of this change in the direction of capital flows, the GBPUSD has declined 😔
⚡⚡⚡ GBPUSD ⚡⚡⚡
🚀 Sell@1.32800 - 1.32600
🚀 TP 1.32200 - 1.32000
The market has been extremely volatile lately 📈📉 If you can't figure out the market's direction, you'll only be a cash dispenser for others 💰
GBPUSD – Rejected at Multi-Month Resistance Amid Weak UK DataGBPUSD has clearly rejected the 1.3413–1.3443 resistance zone—a key area that previously acted as strong supply in September 2024. The pair has formed a bearish rejection candle and is now showing signs of downward momentum.
Key Levels:
Resistance: 1.3413 – 1.3443 (major rejection zone)
TP1: 1.3176 (minor structure)
TP2: 1.3014 (key demand zone)
TP3: 1.2890 (deeper support target)
Bearish Confluences:
Price rejected from major resistance
Bearish candle formation
Previous similar reaction from the same level
Momentum indicators favor downside
📰 Fundamental Analysis:
🔻 UK Data Weakens Further:
According to the latest S&P Global Flash UK PMI (Apr 23):
Composite Output Index: 48.2 (vs 51.5 in March) – 29-month low
Services PMI: 48.9 – 27-month low
Manufacturing PMI: 44.0 – 20-month low
This shows UK private sector activity contracting, led by a steep fall in new export orders, the worst since May 2020.
🔺 Inflation Still High:
Despite falling activity, input and output prices surged, driven by National Insurance hikes and wage growth. This makes it harder for the BoE to justify a cut, despite recession signs.
📌 Conclusion:
The bearish rejection at 1.3413 resistance, combined with deteriorating UK fundamentals, suggests a strong downside setup for GBPUSD. A break below 1.3176 would confirm the bearish move, targeting 1.3014 and potentially 1.2890.

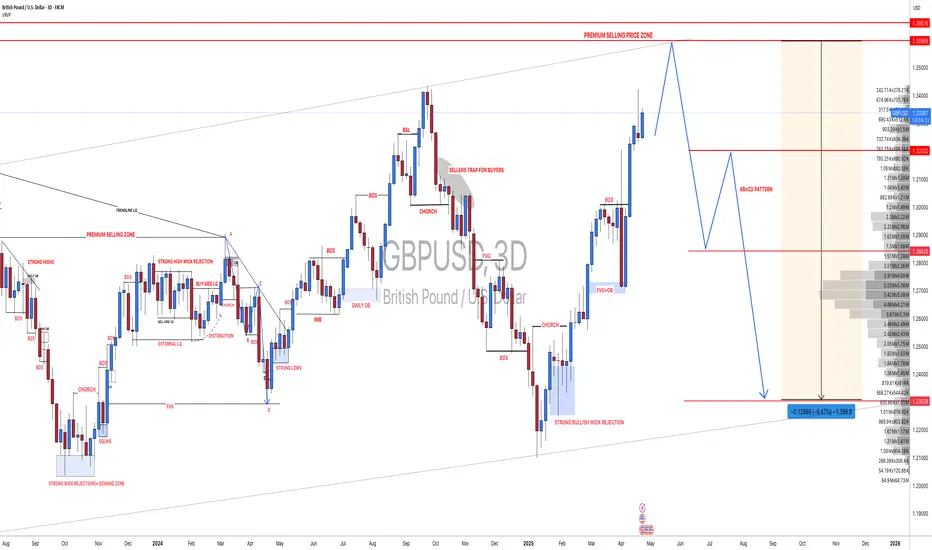
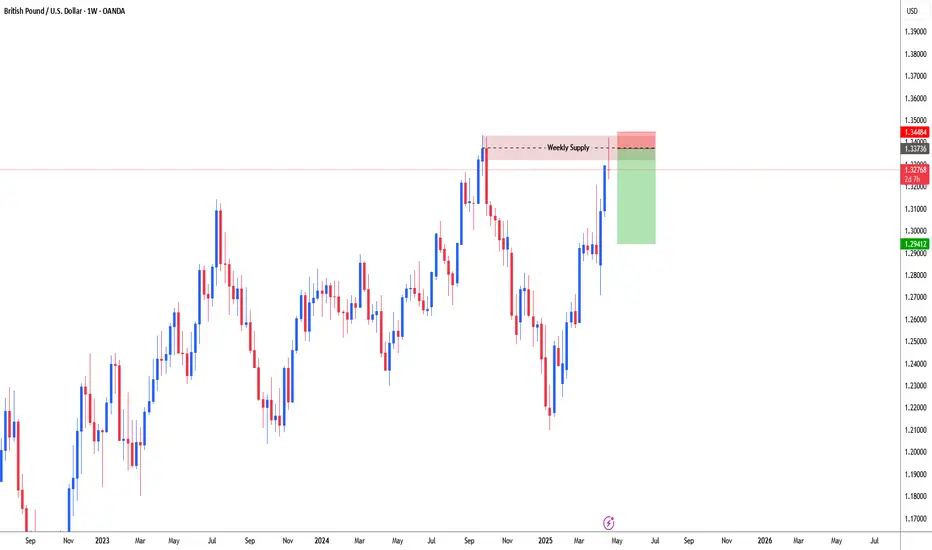
GBPUSD possible short for 1.3030gbpusd tested strong resistance level and high of the year 2024 which is 1.2423. her is weekly supply zone. price may start distribution for big sell. 1.3370-1.3430 weekly supply zone, stop loss place above weekly resistance i.e. 1.3475, target: 1.3030.
GBPUSD SHORT FORECAST Q2 W17 D23 Y25GBPUSD SHORT FORECAST Q2 W17 D23 Y25
Professional Risk Managers👋
Welcome back to another FRGNT chart update📈
Diving into some Forex setups using predominantly higher time frame order blocks alongside confirmation breaks of structure.
Let’s see what price action is telling us today!
🔑 Remember, to participate in trading comes always with a degree of risk, therefore as professional risk managers it remains vital that we stick to our risk management plan as well as our trading strategies.
📈The rest, we leave to the balance of probabilities.
💡Fail to plan. Plan to fail.
🏆It has always been that simple.
❤️Good luck with your trading journey, shall see you at the very top.
🎯Trade consistent, FRGNT X
GBPUSD SHORT FORECAST Q2 W17 D23 Y25GBPUSD SHORT FORECAST Q2 W17 D23 Y25
Professional Risk Managers👋
Welcome back to another FRGNT chart update📈
Diving into some Forex setups using predominantly higher time frame order blocks alongside confirmation breaks of structure.
Let’s see what price action is telling us today!
💡Trade confluences📝
✅Weekly Order block rejection
✅15’ order block created
✅15’ wick rejections via order block
✅Intraday bearish breaks of structure
✅Tokyo ranges to be filled
✅1’ break of structure
✅1’ bearish engulfing candle fill
✅Sell limit order on the 1’ candle fill
🔑 Remember, to participate in trading comes always with a degree of risk, therefore as professional risk managers it remains vital that we stick to our risk management plan as well as our trading strategies.
📈The rest, we leave to the balance of probabilities.
💡Fail to plan. Plan to fail.
🏆It has always been that simple.
❤️Good luck with your trading journey, shall see you at the very top.
🎯Trade consistent, FRGNT X
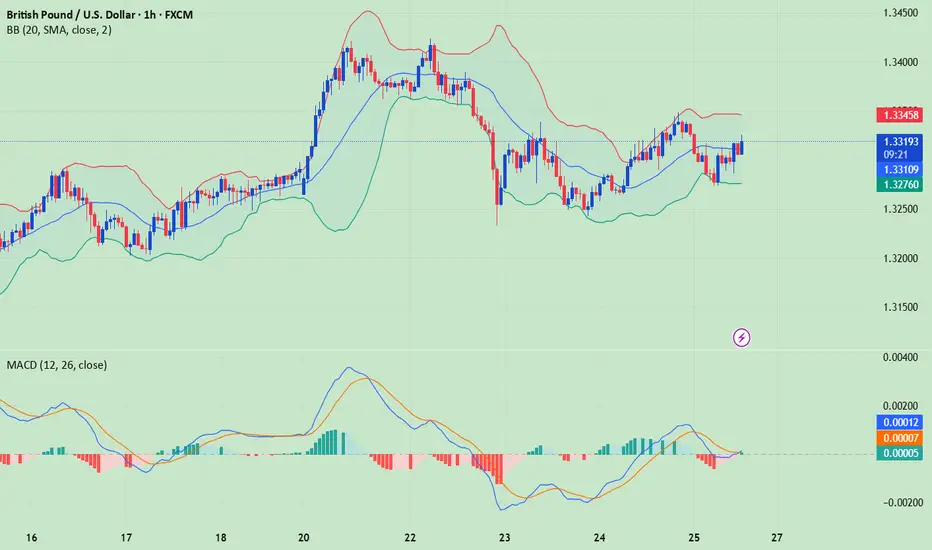
Short term retracement on GBPUSD before continuing the uptrendGBPUSD has been flying for a while now due to dollar weakening.
From my analysis it looks like it is currently making a short term retracement to fill some imbalances before continuing to the upside again.
EURUSD and GBPUSD Analysis todayHello traders, this is a complete multiple timeframe analysis of this pair. We see could find significant trading opportunities as per analysis upon price action confirmation we may take this trade. Smash the like button if you find value in this analysis and drop a comment if you have any questions or let me know which pair to cover in my next analysis.

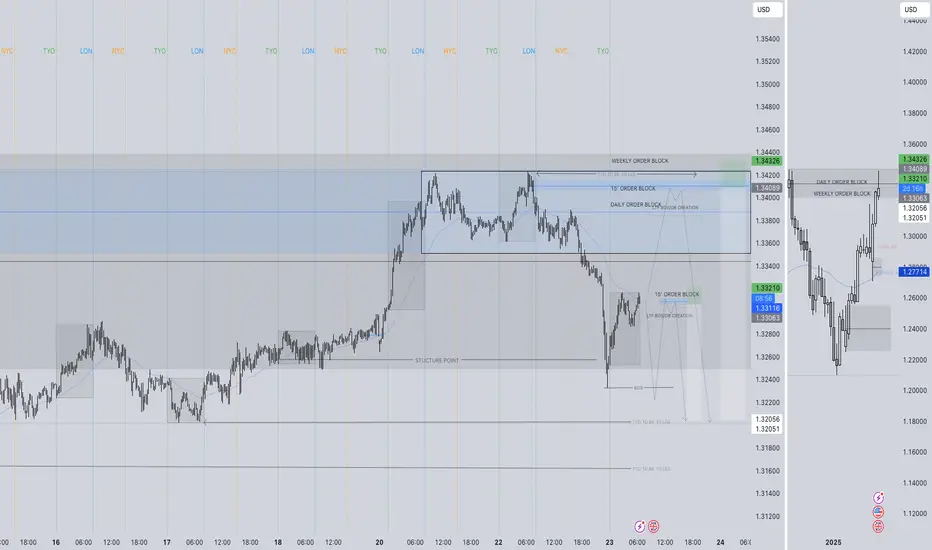
GBPUSD SHORT FORECAST Q2 W17 D22 Y25GBPUSD SHORT FORECAST Q2 W17 D22 Y25
SUMMARY
- Weekly order block
- Daily order block
- Price action bullish in current point of interest.
REQUIREMNTS
- Setup A) Substantial 15' break of structure, creating 15' order block to short from on the pull back.
- Setup C) Lower time frame break of structure without initial 15' break of structure.
- Candle stick formation confluences.
FRGNT X
IG - JCFRGNT
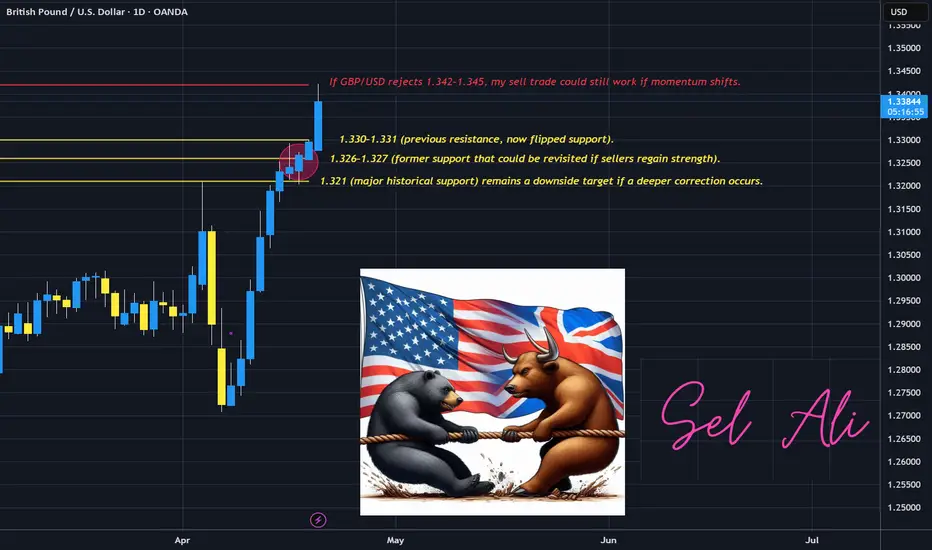
GBPUSD Let’s see if sellers step in.GBP/USD Trade Update: Holding My Sell at 1.32480
I entered a sell trade at 1.32480, expecting a reversal based on key technical and fundamental setups. But with GBP/USD now sitting at 1.33814, I have to reassess market conditions while still staying true to my trading approach.
Fundamental Overview – Why I Still Favor Downside
This week’s economic events could create volatility, and I’m paying close attention to:
UK PMI (April 23): Expected declines in Manufacturing (44.1) and Services (51.0) suggest economic weakness, which could weigh on GBP.
US Durable Goods Orders (April 24): Mixed expectations—headline at +1.8%, but ex-defense and transportation are negative, meaning uncertainty in USD strength.
UK Retail Sales (April 25): Forecasted at -0.3%, signaling weaker consumer spending. This aligns with my sell bias, as slowing UK economic data could trigger renewed selling pressure.
If the UK data disappoints, GBP/USD could struggle to hold higher levels, reinforcing my trade.
Technical & Price Action Analysis
Resistance Holding at 1.342–1.345:
Strong resistance is forming here. If bulls fail to push past this zone, my sell trade could still play out.
Wick formations near this level suggest some rejection, but confirmation is needed.
Key Support Levels for a Potential Drop:
1.330–1.331 (Flipped Resistance, Now Support) – Watching if price retests this zone.
1.326–1.327 (Major Support) – If momentum shifts, price could revisit this area.
1.321 (Stronger Support) – If price weakens further, this becomes my downside target.
Momentum is slowing, but the bullish trend is still intact unless price rejects at 1.342–1.345.
Volume Profile & Institutional Behavior – Are Big Players Selling?
Signs of Institutional Unloading:
Buy-side orders appear strong, but price is not breaking higher with conviction. This could mean large traders are selling into the rally.
Watching for a delta imbalance where buyers dominate order flow, but price fails to rise. This is a classic distribution sign.
Why This Matters: If institutions are offloading positions near 1.342–1.345, we could see price stall and reverse. My focus is on whether this resistance holds or breaks. That will define whether my sell trade remains valid.
My Trade Management Plan – Staying Patient
As a daily trader, I wait for the daily candle close before making adjustments.
If price rejects 1.342–1.345, I’ll hold my position with targets back toward 1.330–1.327.
If price breaks above resistance and holds, I may need to reevaluate my stop-loss placement.
Final Thoughts – Trusting My Process
I’m still holding my sell at 1.32480, but I recognize that buyers are testing key resistance. If institutions are quietly distributing, we could see a shift back to the bearish side, but I’m waiting for confirmation at the daily close.
I’ll update once the daily candle closes. Let’s see if sellers step in.
GBPUSD Happy Easter Traders! 4/20 6:33pm. I’m currently holding a sell position on GBP/USD at 1.32480, and despite price climbing to 1.32942, I see several technical and fundamental factors that support my trade idea.
Fundamental Perspective
Looking ahead, this week presents major economic events that could drive volatility in GBP/USD.
UK PMI (April 23): Manufacturing PMI is expected to drop to 44.1, while Services PMI may soften to 51.0—both indicators suggest economic slowdown, potentially putting downward pressure on GBP.
US Durable Goods (April 24): Forecasts show mixed numbers—headline durable goods is projected at +1.8%, but ex-transportation and ex-defense figures are negative, meaning uncertainty surrounding USD demand.
UK Retail Sales (April 25): The monthly figure is expected at -0.3%, signaling weaker consumer spending. This aligns with my sell bias, as deteriorating UK economic conditions could contribute to pound weakness.
If the UK data disappoints while US figures remain mixed or slightly stronger, GBP/USD could face renewed selling pressure, validating my position.
Technical Analysis - Historical & Indicator Confirmation
Looking at the daily chart, there’s strong alignment between price action and indicator readings that suggest a potential reversal:
Resistance Holding at 1.330–1.331:
The Stochastic at 74.88 suggests GBP/USD is nearing overbought conditions.
The Williams %R at -22.24 reinforces the idea that price is pushing into exhaustion territory.
Support Structure (Where Downside Pressure Could Build):
Immediate Support at 1.326–1.327: Previous lows from April 20 confirm this zone as a critical level for sellers.
Secondary Support at 1.321: Multiple recent price reactions suggest this area could serve as a strong downside target.
Deeper Support at 1.316–1.318: If bearish momentum strengthens, this area represents a key swing low.
Additionally, while price is pushing higher in the short term, it’s trading well above long-term daily EMAs, suggesting the rally is a temporary overextension rather than a sustained breakout. If GBP/USD fails to break above 1.330–1.331, momentum could shift in favor of my sell trade.
Trade Management & Outlook
Despite the recent push higher, I remain confident in my sell position as long as GBP/USD does not break and hold above 1.330–1.331. If price starts rejecting this level, the next downside target could be 1.326, followed by 1.321, where I’d consider taking partial profits.
With fundamental catalysts ahead, volatility will likely increase. If bullish momentum persists beyond 1.331, I may need to re-evaluate my position, but until that happens, my trade setup remains valid.
Final Thoughts
My sell at 1.32480 is built on strong reasoning—key fundamental risks, extended technical levels, and a solid structure of resistance all favor a potential reversal. If sellers step in soon, I’ll have the opportunity to secure profits on a well-planned move. Now, it’s a waiting game to see how price reacts to resistance and upcoming data.
