#GBPUSD: Two Prominent Buying Points! Will Dxy Bounce Back? Due to strong economic data supporting GBP, its price has been bullish throughout the week, especially since DXY plunged. Given ongoing trade tensions, we may see another higher high. This is risky, so please analyse it yourself.
Like and comment to support us in bringing more analysis.
Have a great weekend! ❤️
Team Setupsfx_
Gbpusdshort
GBPUSD Analysis 4/18 11:13amI've been analyzing GBP/USD closely over the past few days, and here's where I stand. The daily historical data shows an overall uptrend from around 1.278 on April 9 to roughly 1.328 on April 18. Although the price has been climbing, I've noticed that momentum is starting to taper off, which makes me question whether this rally might be overextended.
On the fundamentals side, a series of high-impact events are coming up. For example, recent UK PMI readings have come in slightly weaker—manufacturing at 44.1 and services at 51—while US indicators like PMIs and housing data have shown mixed results, such as an unusually sharp drop in New Home Sales MoM. These data points suggest both the dollar and the pound are facing headwinds, and they add a layer of uncertainty over the near-term direction.
Technically, I've set up a sell trade at 1.32480 with the current price now at 1.32830. My chart tells me that if the market dives further.
Overall, while the short-term setup shows some bullish energy, the divergence with longer-term daily averages and the mixed fundamental data make me cautious. I'll be watching for a pullback toward those support levels that might validate my bearish stance.
That's it for me for today.. unless something unexpected happens ..
Have a great weekend!
BTW im looking for another pair to trade comment below your recommendations and why! Thanks!
GBPUSD:SIGNALHello friends
Given the good growth we had, we can buy within the specified support ranges with capital and risk management because buyers reacted well after the price correction and this could be the beginning of a good growth.
*Trade safely with us*

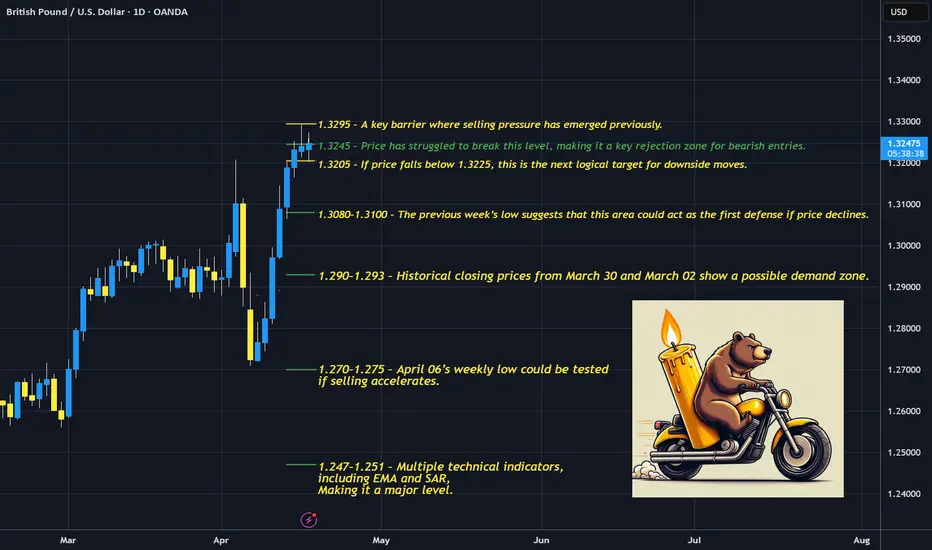
GBP/USD: The Bear's Ride Down the TrendAs I assess the GBP/USD market today, I see that the current price is 1.32466, and I’ve taken a sell position at 1.32480, which is moving well. Based on recent fundamentals, technical indicators, and historical weekly data, here’s my full market breakdown:
Fundamentals & Economic Outlook
Recent US economic data has provided mixed signals for the dollar:
Initial & 4-Week Jobless Claims: Came in lower than expected, signaling a stronger labor market, which supports USD strength.
Continuing Jobless Claims: Higher than expected, showing some lingering unemployment pressure.
Housing Starts: Significantly below expectations, hinting at weakness in real estate.
Building Permits: Surpassed expectations, suggesting future construction remains strong.
Looking ahead to next week, key events will shape price action:
UK S&P Global PMIs: If manufacturing and services figures improve, GBP may gain traction.
US PMIs & Home Sales: Expected to trend lower, possibly weakening USD momentum.
UK Retail Sales (Friday): Anticipated to drop significantly, which could weigh on GBP.
US Michigan Consumer Sentiment: Forecasted to decline, potentially putting USD under pressure.
With these fundamental factors, GBP/USD faces mixed conditions—potential volatility ahead.
Momentum readings show caution for bulls:
Short-term (1-minute to 15-minute) indicators suggest mild consolidation.
The 1-hour and daily charts indicate GBP/USD is overextended compared to historical averages.
Weekly and monthly averages are much lower (~1.27047 and 1.23141), signaling the risk of mean reversion.
Trading Strategy & Considerations
Since I’m already in a sell position, I’m watching support levels closely for profit-taking zones.
If price dips near 1.3100, I might secure partial profits before assessing further downside potential.
I’ll keep an eye on daily EMA (~1.25176) as a deeper support that might act as a turning point.
Technical divergences (such as the Accumulation Distribution Oscillator) hint at distribution pressure, reinforcing my bearish bias.
With all this being said, i'm looking for a new pair to dive deep into. What do you recommend and why? Im all ears! also dont hesitate to reach out id love to talk about forex! :) im in the works of creating a youtube page and maybe a X account. Hope to reach some of you there as well.
p.s i love this shit!
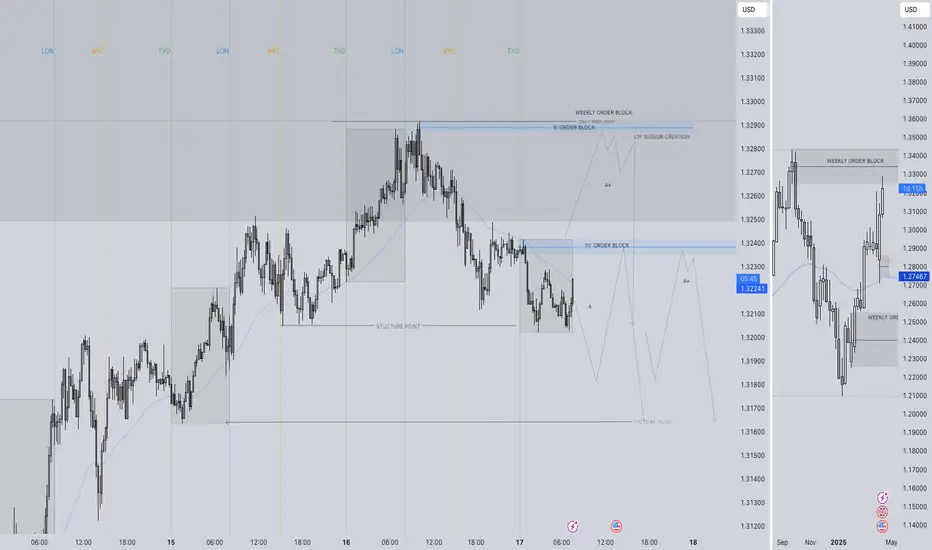
GBPUSD SHORT FORECAST Q2W W16 D17 Y25GBPUSD SHORT FORECAST Q2W W16 D17 Y25
GM GM!
- Potential 15' OB Short
- Potential 5' OB Short, lower time frame Break of structure via level
- Potential
SUMMARY
- Weekly order block rejection is the setup
- Required 15' Breaks of structure
FRGNT X
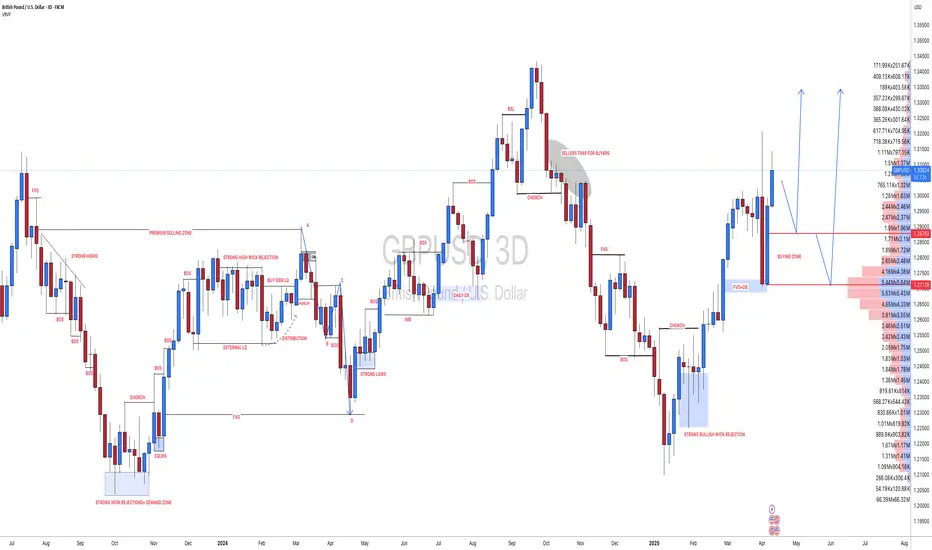
GBPUSD is in the Buying Direction after Testing SupportHello Traders
In This Chart GBPUSD HOURLY Forex Forecast By FOREX PLANET
today GBPUSD analysis 👆
🟢This Chart includes_ (GBPUSD market update)
🟢What is The Next Opportunity on GBPUSD Market
🟢how to Enter to the Valid Entry With Assurance Profit
This CHART is For Trader's that Want to Improve Their Technical Analysis Skills and Their Trading By Understanding How To Analyze The Market Using Multiple Timeframes and Understanding The Bigger Picture on the Charts

GBPUSD I Short Opportunity Coming Soon Welcome back! Let me know your thoughts in the comments!
** GBPUSD Analysis - Listen to video!
We recommend that you keep this pair on your watchlist and enter when the entry criteria of your strategy is met.
Please support this idea with a LIKE and COMMENT if you find it useful and Click "Follow" on our profile if you'd like these trade ideas delivered straight to your email in the future.
Thanks for your continued support!Welcome back! Let me know your thoughts in the comments!

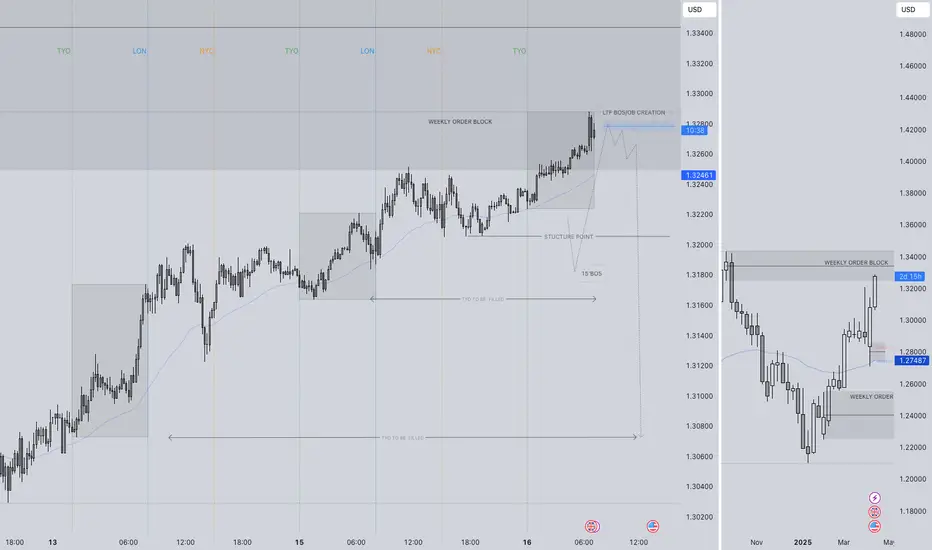
GBPUSD SHORT FORECAST Q2 W16 D16 Y25GBPUSD SHORT FORECAST Q2 W16 D16 Y25
Thoughts- It's not if, it's WHEN !
All longs are null until the weekly order block has been breached or price drops considerably. In the here and now the short seems to be closing in.
It is as always important to stack confluences in favour of the short prior risking capital.
15' break of structure is an absolute requirement as this point of price action.
Within the higher time frame order block- looking for a lower time frame order block is not enough to short from therefore scrolling back months to find is pointless in our opinion.
We will let price show us, we will reaction with price.
What are your thoughts...
Are we dropping today?
FRGNT X
GBPUSD ShortWe have a lot of wicks which indicates slowdown in price and an bearish engulfing, we have an 5m imbalance where my entry is and i can cover the highs with the 10 pip stop.
75% will be taken off at 3RR, rest will go to 8RR asia low or breakeven.

GBPUSD SHORT FORECAST Q2 W16 D15 Y25GBPUSD SHORT FORECAST Q2 W16 D15 Y25
Morning Traders!
Let's await price action to tap into the weekly order block!
From then on, eyes open for 15' breaks of structure. Ensure that key higher low areas and double doubles for potential longs are broken before looking to short a fairly strong looking pound!
We simply await the pull back into s 15' order block that should be created post bearish move we have spoken of above. Upon the turn around in price action, we can be satisfied the bullish trend has exhaust somewhat.
Let's await the setup. No positions on GBPUSD until the above.
FRGNT X

GBPUSD Analysis 4/14 at 7:11pm I've been closely watching GBP/USD, and as of now, the pair is trading at 1.31771. Based on my technical analysis and upcoming market events, I believe the best trade setup is a short position, but only after confirming a rejection near 1.316–1.317.
Why This Short Trade Makes Sense
Overbought Conditions
The daily RSI is at 76.08, meaning the pair is in overbought territory. This increases the likelihood of a pullback rather than a continued rally.
Other momentum indicators (like Stochastic RSI) show that buying pressure is weakening, further supporting the case for a reversal.
Key Resistance at 1.320
Price has tested 1.320 multiple times but failed to break above it, reinforcing this area as strong resistance.
The recent high at 1.31998 showed rejection, indicating that bullish momentum is struggling.
Upcoming Fundamental Events
The UK retail sales data exceeded expectations, providing some short-term support for GBP.
However, upcoming major US economic releases—including Empire State Manufacturing and Retail Sales—could shift sentiment.
With Fed Chair Powell speaking on April 16, volatility is expected, and I prefer to wait for these catalysts before fully committing to a position.
My Trade Plan
Entry: I’ll wait to sell GBP/USD after confirming rejection at 1.316–1.317.
Final Thoughts
I’m waiting for clear price rejection before entering. If GBP/USD struggles to break higher and starts reversing at 1.316–1.317, that’s my signal to short. At the same time, I’ll watch how the upcoming economic events influence market sentiment—especially the US retail sales data and Powell’s speech.
This approach ensures I’m trading based on confirmation rather than speculation, reducing the risk of entering prematurely.

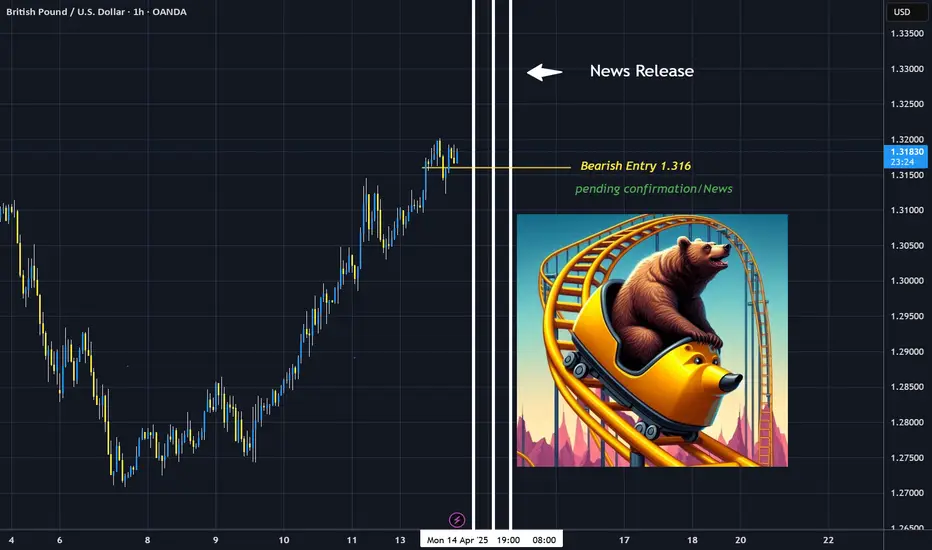
GBPUSD Analysis 4/14/2025 1:35pmI've been closely watching GBP/USD, and as of now (with the pair trading around 1.31808), I see it moving within a tight consolidation range—roughly between 1.307 and 1.320. Given that I'm near the upper end of this range, I feel that jumping in right away could expose me to potential reversals or whipsaw moves.
My plan is to take a short position, but only after the market pulls back to around 1.316. I view that level as a more attractive entry point since it’s toward the lower side of the current consolidation. This strategy offers me a better risk/reward setup; I can tighten my stops (placing a stop loss above recent highs around 1.320) while aiming for a move down toward the support area, which I expect could be around 1.304–1.305 if the sell-off continues.
In addition, there are several high-impact economic events coming up for both the UK and US—ranging from GBP retail sales and employment data to key US manufacturing, retail sales, and even a speech from Fed Chair Powell. With all that volatility on the horizon, I prefer to wait and see how the news plays out. This way, I can avoid being caught in erratic moves and let market sentiment become clearer before I commit to my trade.
To sum it up: I'm planning to short GBP/USD by waiting for a pullback to about 1.316, with a stop set just above 1.320, and a target closer to the lower support around 1.304–1.305. This approach takes into account the current consolidation, technical signals (like overbought conditions), and the upcoming fundamental catalysts that could swing the market.
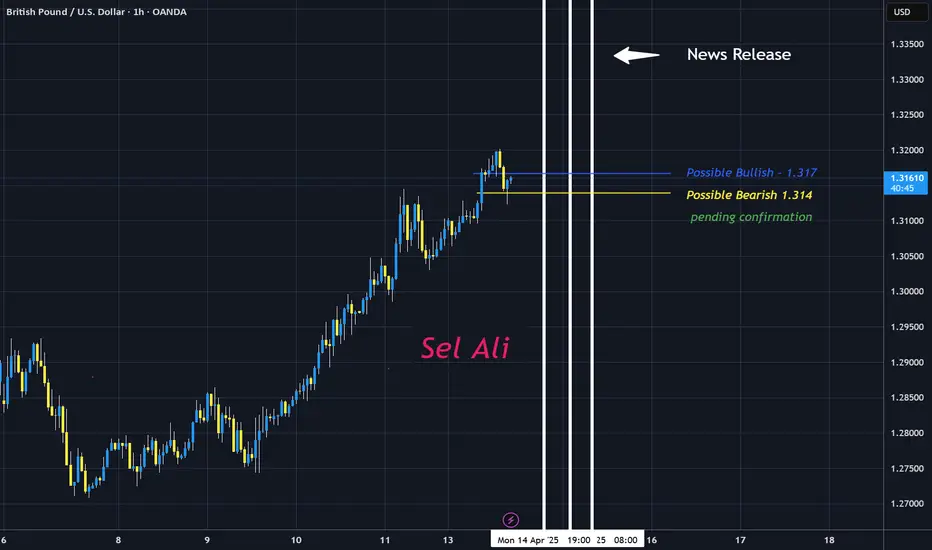
GBPUSD Analysis Update 4/14 10:18am, pending confirmationI've been closely analyzing GBP/USD this week, and here's my updated view based on all the technical indicators and fundamental data.
Price Action & Key Levels
Right now, GBP/USD is trading at 1.31537, after rejecting 1.320 resistance earlier in the session. The market made a strong attempt to break above 1.320, but sellers stepped in, causing a pullback. Given this rejection, I'm watching 1.317 closely—if price fails to reclaim that level, a bearish continuation toward 1.312–1.310 becomes increasingly likely.
Technical Indicators & Market Signals
Momentum & Trend Strength
RSI: Short-term signals suggest price is consolidating (RSI at 48.78), while the daily RSI (76.08) indicates overbought conditions, meaning a larger pullback may be ahead.
Aroon Oscillator: Weakening bullish strength, suggesting trend exhaustion.
ADX: At 10.1 (1-hour), showing weak trend momentum, meaning price might stay range-bound or reverse lower.
MACD: Mixed signals—some divergence appears, showing signs of a potential downward move.
Fibonacci Retracement Levels (From 1.320 High)
23.6% retracement: 1.3172 → Minor resistance zone.
38.2% retracement: 1.3158 → Current price zone.
50% retracement: 1.3143 → Potential short-term support.
61.8% retracement: 1.3129 → Stronger support level.
78.6% retracement: 1.3110 → Critical breakdown point.
If GBP/USD fails to reclaim 1.317, I anticipate further downside toward 1.312–1.311, where stronger support exists.
Bollinger Bands Confirmation
Upper Band (~1.320): Acted as resistance—price rejected this zone, confirming sellers stepped in.
Middle Band (~1.315–1.316): Price hovering here—neutral consolidation phase.
Lower Band (~1.312–1.313): If price breaks below 1.314, downward momentum is likely toward this level.
Fundamental Factors Supporting Bearish Bias
GBP Weakness: Expected softer BRC Retail Sales, Employment Change, and Inflation Rate data, which could weigh on GBP/USD.
USD Strength: Strong Retail Sales figures and upcoming Fed Chair Powell’s speech might bolster the Dollar, adding further downside pressure to GBP/USD.
Trade Setup & Execution Strategy
Bearish Case:
If GBP/USD fails at 1.317, I’ll look to enter short below 1.3155, targeting 1.312 or lower.
Bullish Case:
If GBP/USD reclaims 1.317, buyers could push price back toward 1.320 resistance.
Conclusion
At the moment, GBP/USD is at a decision point—while short-term indicators suggest some consolidation, rejection at 1.320 confirms bearish pressure. If sellers hold control, I expect price to move toward 1.312–1.311 in the coming sessions, making a short setup favorable. However, if price reclaims 1.317, buyers may attempt another test of 1.320 resistance.
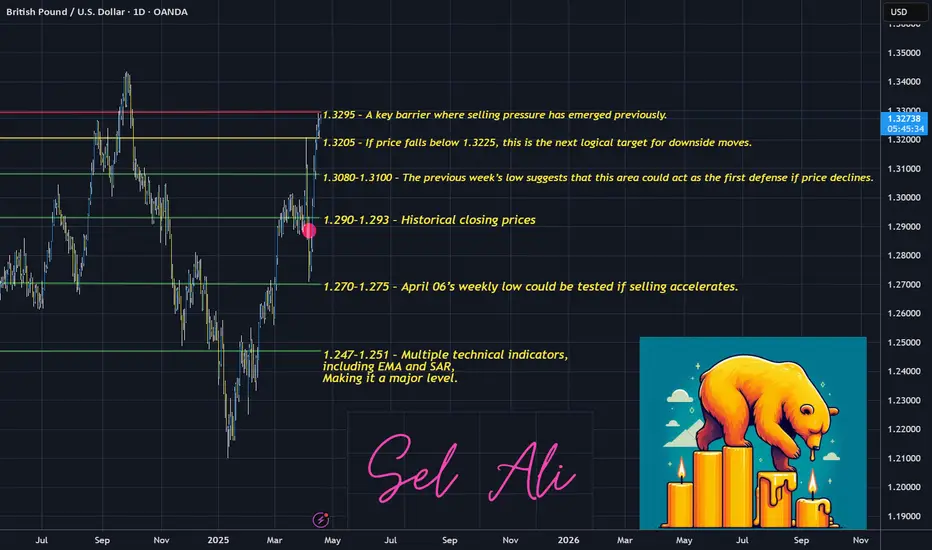
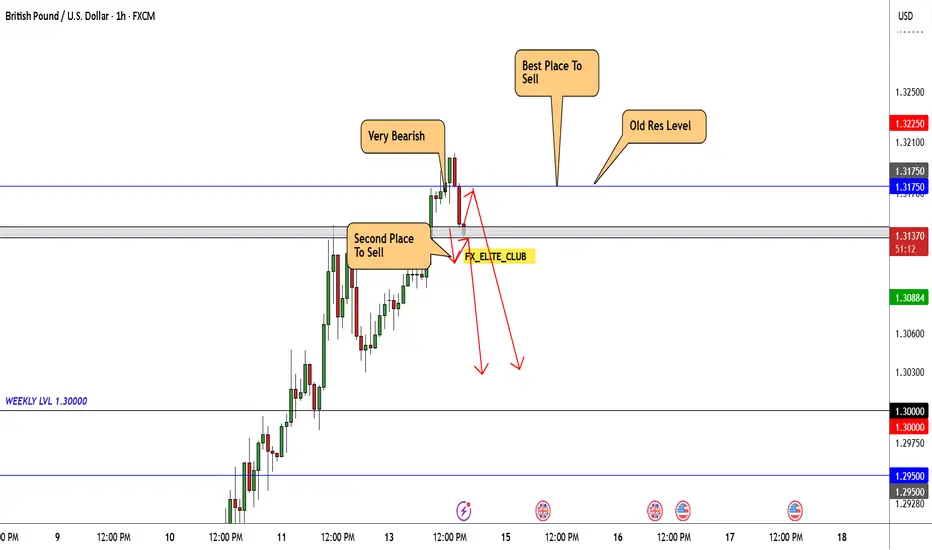
GBP/USD At Interesting Area To Sell , Should We Sell Now ?Here is my Opinion About GBP/USD , I Have an old res and the price respect it 100% and gave us a very good bearish P.A , So i think we have 2 places to sell it , first one if the price back to retest my res level 1.31750 and if the price give us a good bearish price action we can enter and targeting 200 pips . if the price didn`t back to retest the res level we can wait he price to close below support with 4h candle and then we can enter a sell trade with the same target .
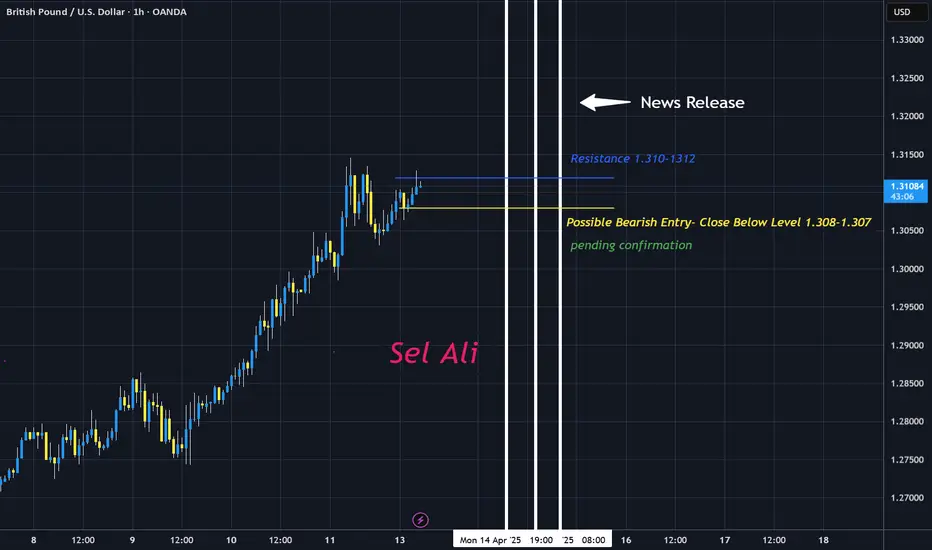
GBPUSD Are the Bears back? I've been analyzing GBP/USD closely, and here's my outlook for this week. The pair is currently trading at 1.31123, testing a significant resistance zone that has been crucial in recent sessions. Technically, short-term indicators show overbought conditions—the RSI on the 1-minute chart is at 87, and Stochastic RSI is at extreme levels, both signaling a high probability of a rejection from resistance rather than a continued breakout.
Digging deeper into trend and momentum indicators, I see that ultra-short-term readings (such as the Aroon Oscillator on the 1- and 5-minute charts) are bullish, but longer-term indicators suggest waning momentum. Linear regression slopes and moving averages like KAMA and EMA indicate slowing upward momentum. Meanwhile, the Average True Range (ATR) is low, signaling consolidation rather than strong trend continuation. Considering these factors, I expect a retracement soon and am watching 1.308–1.307 as potential entry points.
Fundamentally, things aren’t looking great for the Pound. GBP economic releases this week—including BRC Retail Sales, Employment Change, and Inflation figures—are expected to show weakness. Softer retail sales and job growth numbers could weigh on GBP further. Meanwhile, the USD is strengthening, with upbeat Retail Sales data and an important speech from Fed Chair Powell likely reinforcing the Dollar's momentum.
Based on my analysis, I anticipate GBP/USD will move lower this week and am leaning toward a bearish trade. My plan is to wait for a rejection from resistance before entering a short position, ideally around 1.308 or lower.
Please note things do change so let's see what this week brings :) !
GBP/USDHello friends
According to the trend and price drop, we see that a flag pattern has formed, which we can enter into a trade with capital and risk management.
*Trade safely with us*
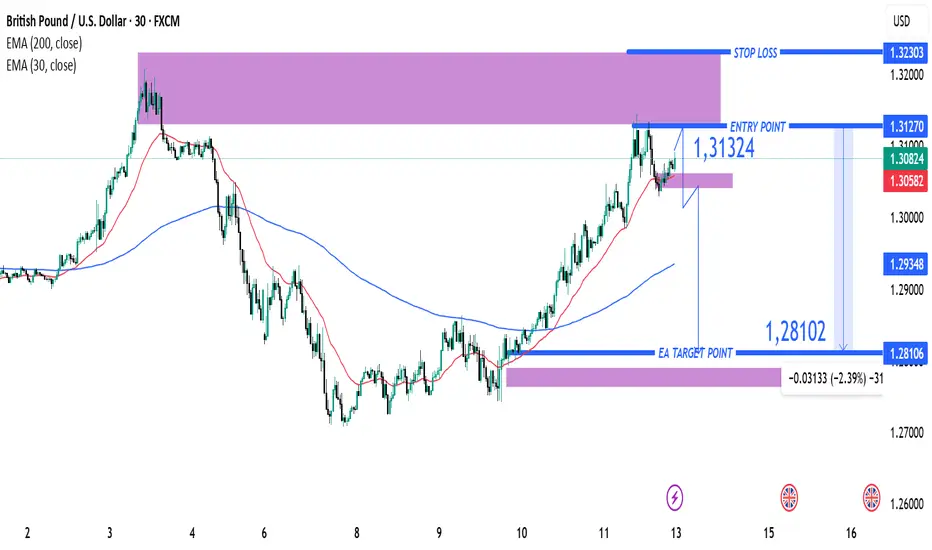
GBP/USD Short Setup – Rejection from Resistance Zone with High REMA 30 (red line)
EMA 200 (blue line)
---
Key Levels:
Entry Point: 1.31324
Stop Loss: 1.32303
Target (TP): 1.28102
---
Analysis:
1. Trend Context:
The market shows a recent bullish move approaching a key resistance zone (highlighted in purple).
The price is now reacting to that resistance zone and potentially forming a reversal.
2. EMA Insight:
Price is currently trading slightly above the EMA 200 and EMA 30, indicating short-term bullish momentum.
However, the suggested trade setup appears to be short (sell), anticipating a reversal from resista
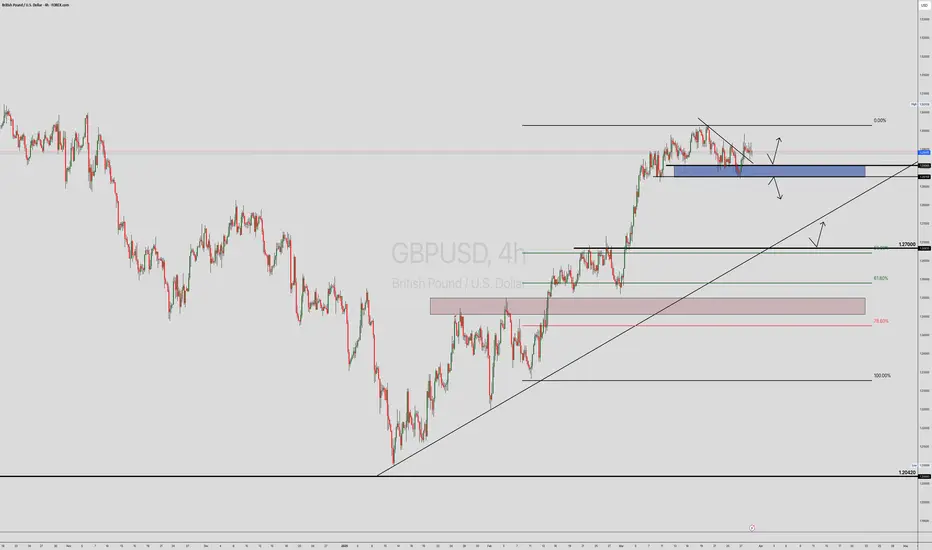
GBP/USD Ready to Fly! 📢 GBP/USD Ready to Fly! 🚀
📈 Looking bullish from Weekly Bullish FVG 50% Level 🎯
✅ Waiting for confirmation before entry!
🎯 Target: Bearish Extreme Order Block
🔥 Don't miss the move! Stay updated – Follow our TradingView page! 📊
GBPUSD, Is This Just a Pullback or a Full Reversal? 4/11 11:26amI’ve been closely analyzing GBP/USD, and right now, I’m assessing whether the recent drop is just a pullback within an uptrend or the start of a full reversal into bearish territory.
Pullback vs. Reversal: What I’m Looking For
Pullback Characteristics: A pullback is typically a short-lived dip before the trend resumes. If GBP/USD stabilizes around 1.3030–1.3050 and then rebounds, it would confirm that buyers are still in control and the overall bullish trend is intact. Moving averages (like EMA and KAMA) should continue to slope upward in that scenario.
Reversal Characteristics: A full reversal happens when price breaks major support levels (like 1.2990) and shows bearish confirmation—things like a bearish engulfing candle, lower highs/lows, and negative momentum signals. If key indicators (like RSI dropping below 30 and MACD turning negative) confirm the trend shift, then sellers are fully taking control.
Current Market Signs
GBP/USD fell sharply from 1.314, forming an M-shape pattern that often signals trend exhaustion.
If price fails to bounce near 1.3050, the likelihood of a full reversal increases.
Shorter timeframe indicators (like RSI and MACD) are showing slowing momentum, which reinforces the case for further downside.
My Verdict & Trade Decision
I’ve decided that this is looking more like a near-term reversal rather than just a pullback. Since price keeps failing to reclaim 1.3050, the bearish pressure remains strong. If we break below 1.2990, I expect a deeper decline into a full downtrend shift.
Final Trading Action
Closing my trade: Given everything I’m seeing, I’m closing my current long trade now to lock in profits and avoid further downside risk.
Future trade setup: If price rejects 1.3050 and starts rebounding, I’d consider re-entering long. However, if GBP/USD closes below 1.2990, I’ll switch to a short trade, targeting further downside.
Happy Friday!

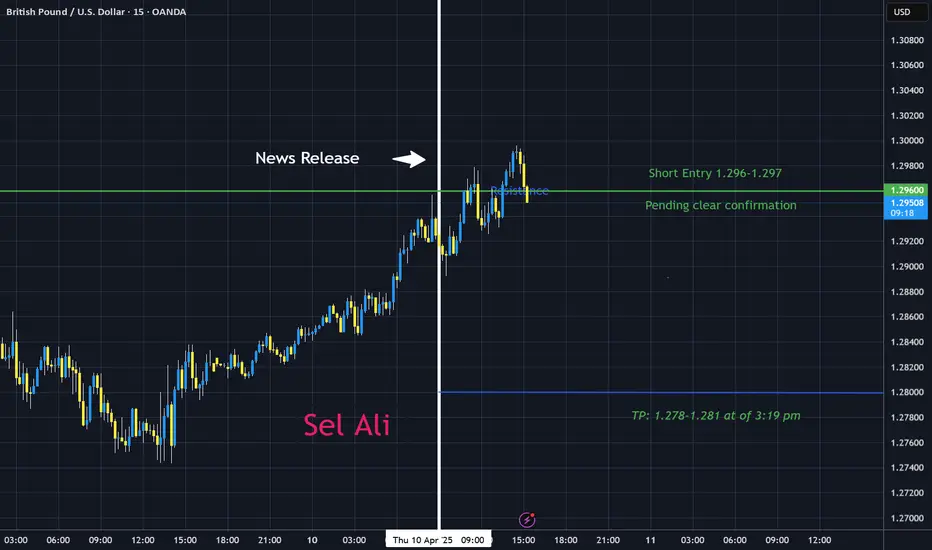
GBPUSD analysis as of 4/10 3:19pm Mind you, i still have a bullish trade going from my previous long trade.. I removed my take profit yesterday and im continuing to monitor the market. but as for now these are the numbers we are looking at.
The market has really overextended itself—prices are at levels that feel too high compared to the earlier consolidation. On the 1‑hour, 4‑hour, and daily charts, I’m spotting clear bearish signals (like the bearish bet-hold patterns, closing marubozu, bearish engulfing, and even hikkake formations) that suggest sellers might soon step in. Even though the higher timeframes still hold an overall bullish bias, these short-term resistance patterns are warning me that the rally may be topping out.
Given this, my plan is to close out my bullish trade as soon as I get confirmation of a reversal. I’m watching for a clear candlestick signal—a bearish engulfing pattern, a pin bar, or any strong rejection on the lower timeframe (say the 15‑minute or even a confirming close on the 1‑hour) around the 1.293–1.290 area. Once I see that confirmation, I’ll lock in my profits from the bullish trade and then pivot to a sell. I’d target my short entry near that level, with a stop-loss just above recent highs (around 1.296–1.297), aiming for a retracement toward the previous support zone (around 1.278–1.281).
In short: I’ll close my bullish position when the price clearly shows it’s reversing from these overextended, overbought highs, and then I’ll open a sell trade to take advantage of the expected short-term pullback. This approach lets me protect my gains and capitalize on the bearish signals emerging from the chart.
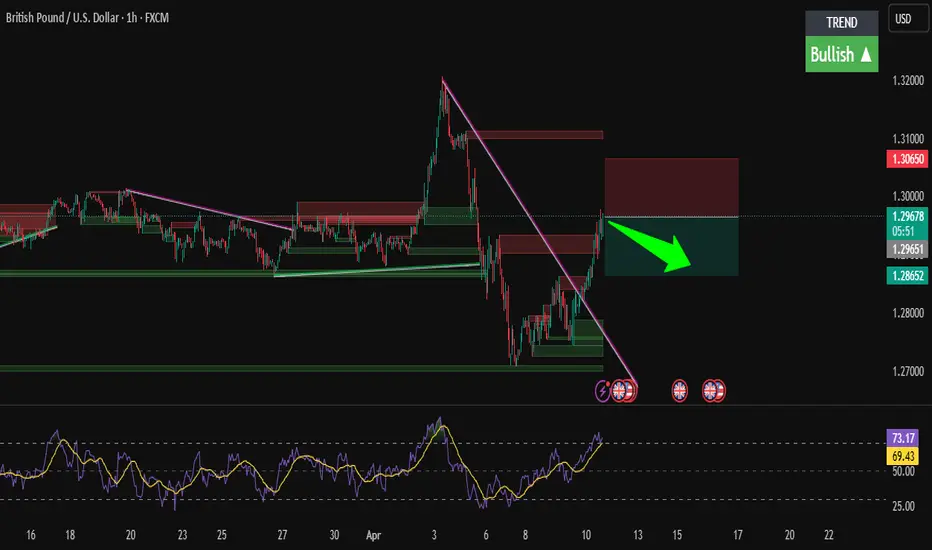
GBP/USD Breakdown Incoming? Bearish Setup Unfolding!Hi traders! Analyzing GBP/USD on the 1H timeframe, spotting a potential rejection at the descending trendline:
🔹 Entry: 1.29660
🔹 TP: 1.28652
🔹 SL: 1.30650
Price is reacting to the descending trendline after testing a key resistance zone. This level has acted as dynamic resistance in the past, and price shows signs of rejection.
The RSI is in the overbought area, suggesting a possible pullback. If the bearish momentum confirms, we could see a clean move back down to the previous support levels.
⚠️ DISCLAIMER: This is not financial advice. Every trader must evaluate their own risk and strategy.
GBP/USD Bullish Breakout Setup – Entry, Target & Stop Loss AnalyEMA 200 (blue line): 1.28423 – typically used to define long-term trend direction.
EMA 30 (red line): 1.28253 – shorter-term trend indication.
Currently, the price is above the 30 EMA and slightly above the 200 EMA, suggesting short-term bullish momentum with potential for trend reversal or continuation.
🟪 Key Zones and Levels:
Entry Point Zone: Around 1.28242–1.28423 (highlighted in purple).
Stop Loss: Set slightly below the purple demand zone at 1.27931.
Target (EA TARGET POINT): Marked around 1.29809.
🧠 Trade Setup Summary:
Risk/Reward: Good – aiming for a ~1.19% gain (~152.5 pips), with a relatively tight stop loss.
Structure:
The price has broken above a consolidation range (demand zone) and retested the zone (potential bullish retest).
EMA crossover could soon occur if the 30 EMA crosses above the 200 EMA, confirming bullish sentiment.
✅ Bullish Confirmation Signs:
Higher lows forming.
Break and retest of previous resistance (now support).
EMA proximity breakout is occurring.
Strong bullish candles near the entry level.
⚠️ Things to Watch:
If price closes strongly above 1.2860–1.2870, that could signal momentum continuation.
Failing to hold 1.2824–1.2800 might invalidate the setup and trigger the stop loss.
Watch for fundamental events (economic news, especially from UK/US) that could cause sudden volatility.

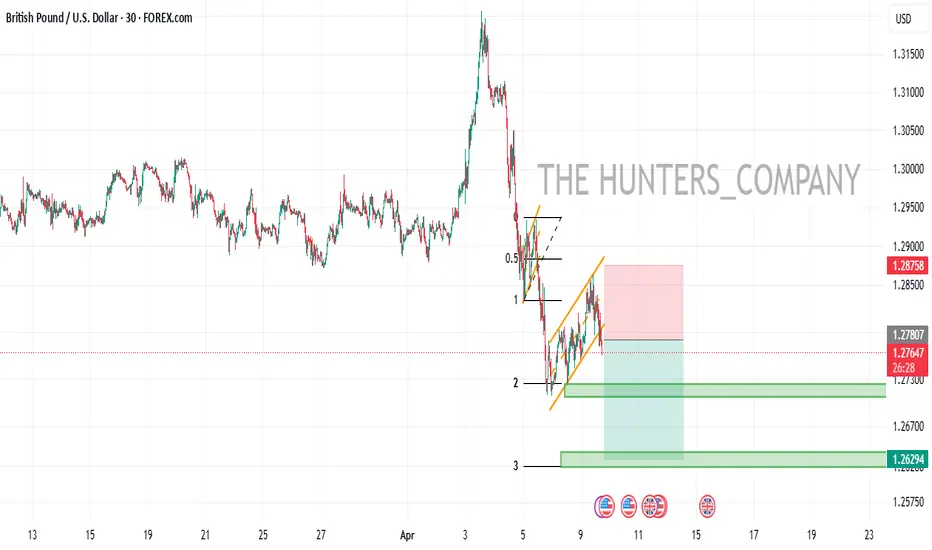
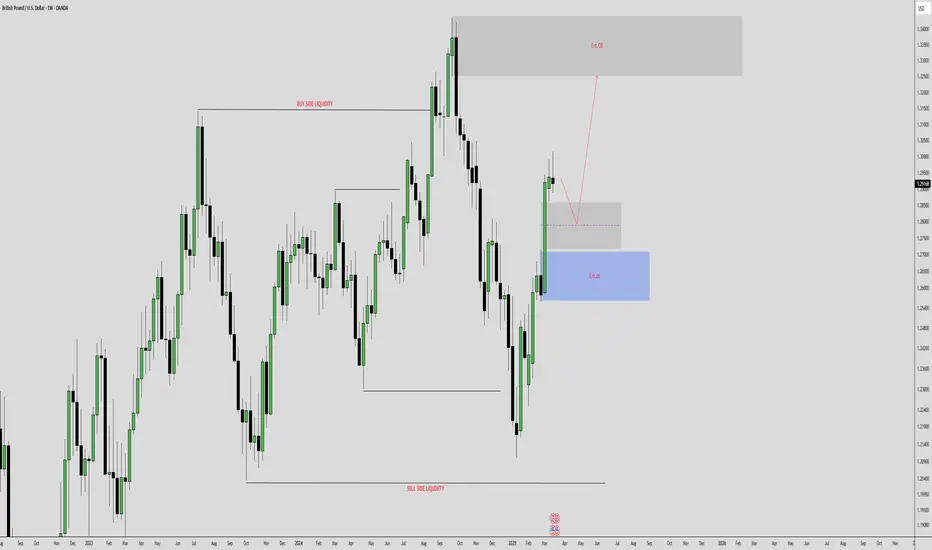
GBPUSD TRADE SETUPPotential Trade Setup on GBPUSD
The price has successfully retested a very strong support after the 3-week rally it exhibited in March.
However there has been little to no pullback after the rally, and currently, it is firing a possible divergence at 1.2970
The price is developing, and I am waiting for a break below the support area at 1.2960 to take a possible short-term sell trade.
A BUY opportunity is at the bottom of the 50% fib at 1.2700.
You may find more details in the chart!
Thank you and Trade Responsibly!
❤️PS: Please support with a like or comment if you find this analysis useful for your trading