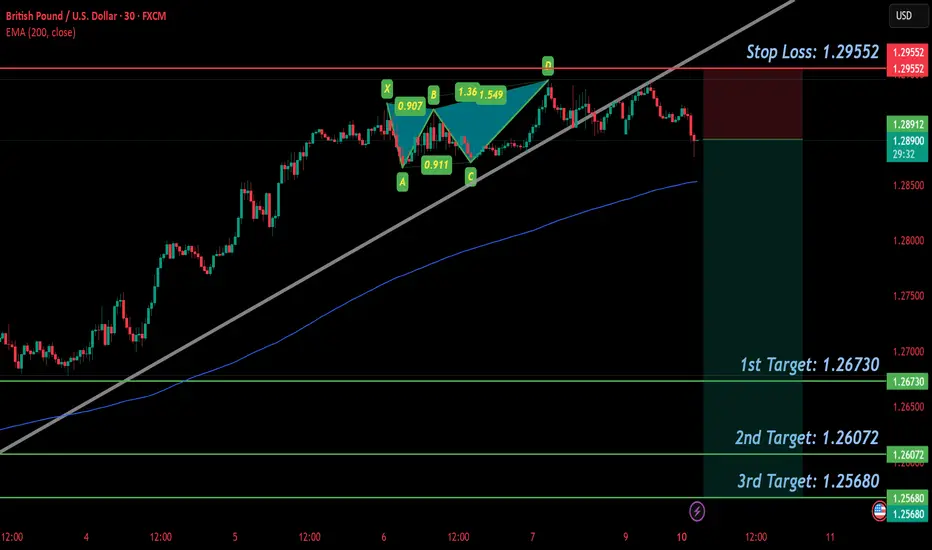
GBP/USD SELL IDEA (R:R=5)Selling GBP/USD now. I placed a sell earlier at 1.29276 after seeing a wonderful BUTTERFLY form on the 30 min chart. Already starting to form lower highs and lower lows on smaller timeframes.
Stop Loss is: 1.29552
(Due to SL hunting)
Please move SL to break even when trade is 100+ pips in profit.
1st Target: 1.26730
2nd Target: 1.26072
3rd Target: 1.25680
Happy Trading! :)
Gbpusdshort
GBPUSD IS SELL SETUPwe will look sell from bb are you ready for sell dont forget to share your likes comments and thoughts
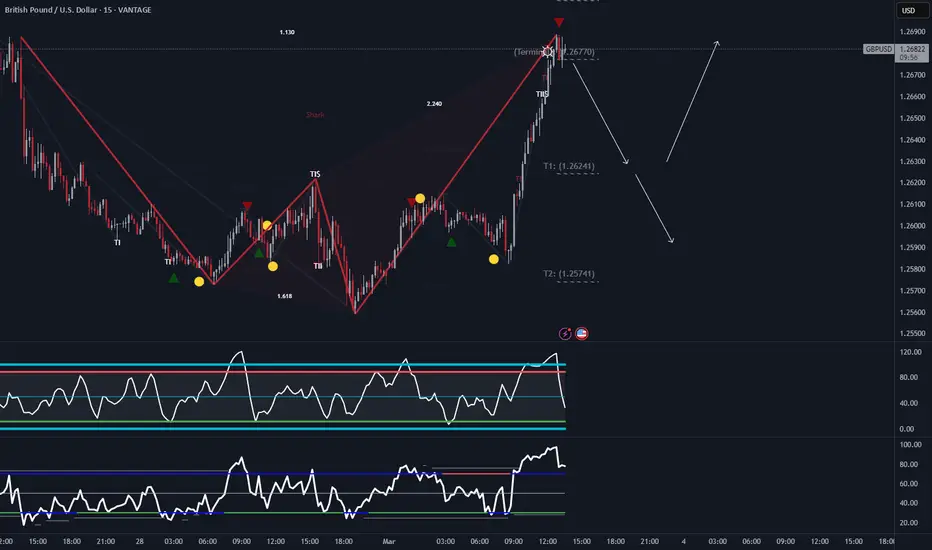
GBP/USD 15-Minute Chart: Bearish Reversal at Harmonic CompletionThe chart showcases a well-defined harmonic pattern, the Shark, with the price reaching the terminal zone at 1.2670 , marked by a red downward triangle. This suggests a potential reversal zone where selling pressure may emerge.
Key observations:
The price has reacted strongly at the completion point, aligning with Fibonacci extensions.
Overbought conditions are evident in the RSI and other momentum indicators, indicating potential exhaustion of the bullish trend.
Target levels:
T1: 1.26241
T2: 1.25741
Suggests a possible downside move if the reversal confirms.
Traders should watch for bearish confirmation before entering short positions, while bulls may seek a break above 1.2670 for further upside.
GBPUSD Bearish ContinuationGBPUSD price seems to exhibit signs of overall Bearish momentum as the price action may form a credible Lower High with multiple confluences through key Fibonacci and Resistance levels which presents us with a potential short opportunity.
Trade Plan :
Entry @ 1.2580
Stop Loss @ 1.2830
TP 0.9 - 1 @ 1.23550 - 1.2330

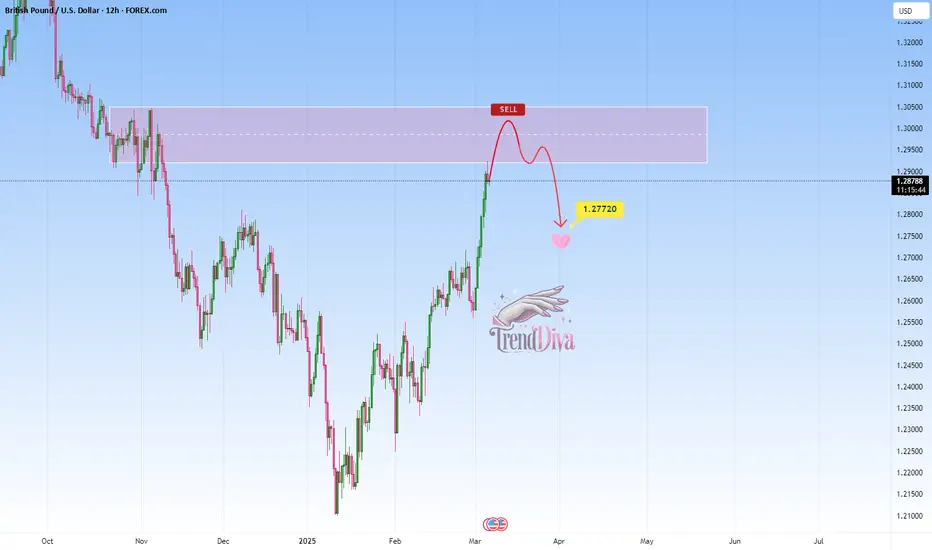
GBPUSD Approaching Key Resistance — Will It Drop to 1.27720?OANDA:GBPUSD is approaching a significant resistance zone, an area where sellers have previously stepped in to drive prices lower. This area has acted as a key supply zone, making it a level to watch for potential rejection.
If price struggles to break above and we see bearish confirmation, I anticipate a pullback toward the 1.27720 level.
However, a strong breakout and hold above resistance could invalidate the bearish outlook, potentially leading to further upside.
Just my take on support and resistance zones—not financial advice. Always confirm your setups and trade with solid risk management.
Best of luck!
GBPUSD Approaching Major Resistance — Potential Sell SetupOANDA:GBPUSD is approaching a significant resistance zone, a level where sellers have consistently stepped in, leading to notable bearish reversals in the past. This area is marked by strong selling interest and historical price reactions, increasing the likelihood of a bearish move if sellers regain control.
The current price action suggests that if the pair confirms resistance through signals like bearish engulfing candles, long upper wicks, or increased selling volume, we could see a downward move toward 1.25770—a logical target based on previous price behavior and market structure.
However, if the price breaks above this zone and sustains, the bearish outlook may be invalidated, opening the door for further upside.
Just my take on support and resistance zones—not financial advice. Always confirm your setups and trade with solid risk management.
Best of luck!

GBPUSD is in the Buying Direction after Testing SupportHello Traders
In This Chart GBPUSD HOURLY Forex Forecast By FOREX PLANET
today GBPUSD analysis 👆
🟢This Chart includes_ (GBPUSD market update)
🟢What is The Next Opportunity on GBPUSD Market
🟢how to Enter to the Valid Entry With Assurance Profit
This CHART is For Trader's that Want to Improve Their Technical Analysis Skills and Their Trading By Understanding How To Analyze The Market Using Multiple Timeframes and Understanding The Bigger Picture on the Charts
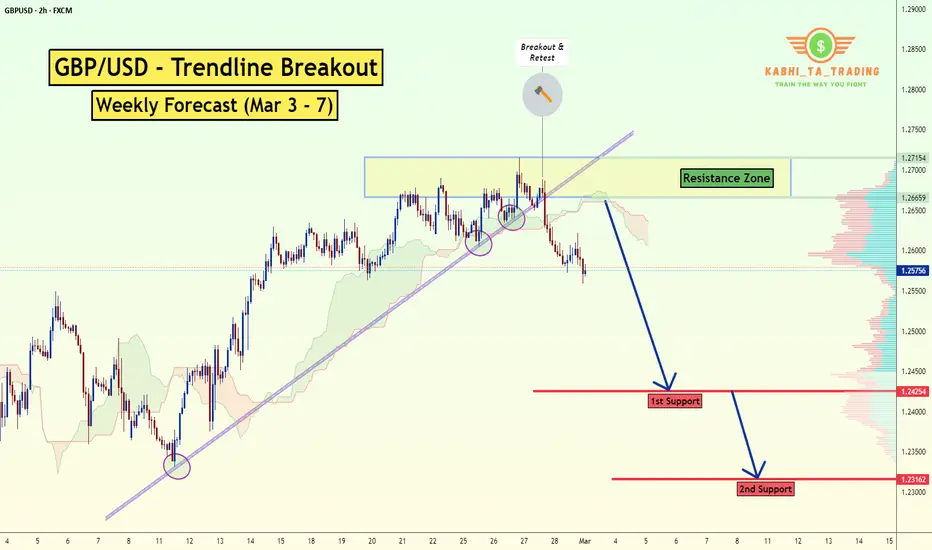
GBP/USD Trendline Breakout (Weekly Forecast Mar 3 - 7)The GBP/USD Pair on the H2 timeframe presents a Potential Selling Opportunity due to a recent Formation of a Trendline Breakout Pattern. This suggests a shift in momentum towards the downside in the coming hours.
Possible Short Trade:
Entry: Consider Entering A Short Position around Trendline Of The Pattern.
Target Levels:
1st Support – 1.2425
2nd Support – 1.2316
🎁 Please hit the like button and
🎁 Leave a comment to support for My Post !
Your likes and comments are incredibly motivating and will encourage me to share more analysis with you.
Best Regards, KABHI_TA_TRADING
Thank you.
Fri 28th Feb 2025 GBP/USD Daily Forex Chart Sell SetupGood morning fellow traders. On my Daily Forex charts using the High Probability & Divergence trading methods from my books, I have identified a new trade setup this morning. As usual, you can read my notes on the chart for my thoughts on this setup. The trade being a GBP/USD Sell. Enjoy the day all. Cheers. Jim

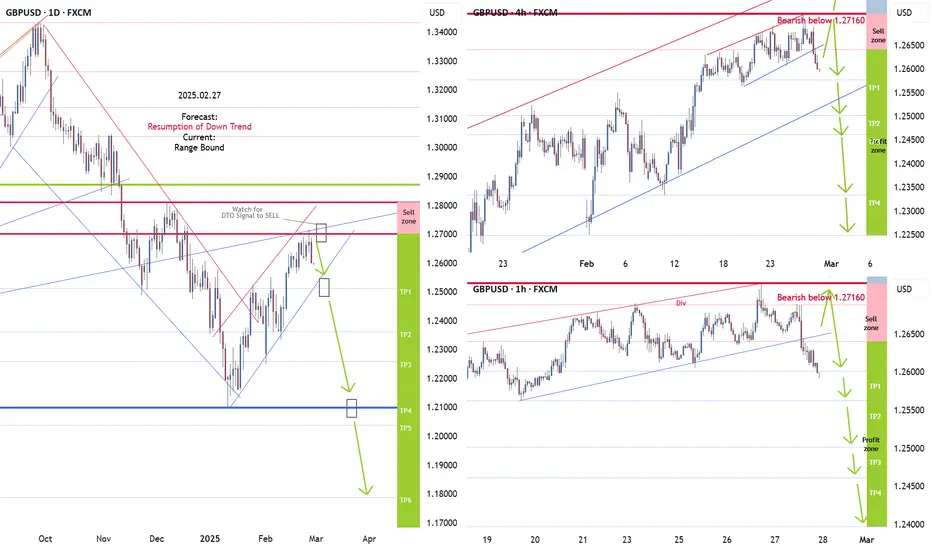
GBPUSD Daily, H4,H1 Forecasts, Technical Analysis & Trading Idea💡 Daily Timeframe:
FX:GBPUSD has been in a Range Bound recently. It touched and rejected from 1.2700 major resistance today.
A peak is formed in daily chart at 1.27150 on 02/26/2025, so more losses to support(s) 1.25107, 1.23609, 1.22589 and minimum to Major Support (1.20981) is expected.
💡 Four-hour Timeframe:
The uptrend is broken, and price is in an impulse wave.
The bearish wave is expected to continue as long as the price is below the strong resistance at 1.2715
💡 One-hour Timeframe:
1.2640 support is broken now. It will act as a Resistance now!
A strong bearish divergence has also formed in the RSI.
Forecast:
Correction wave toward the Sell Zone
Another Downward Impulse wave toward Lower TPs
SL: Above 1.2715
GBP/USD Bullish Recovery – Key Levels for a Breakout & ReversalHello, buddies.
Given the decline, the price has now established a solid floor, and we expect it to continue growing; nevertheless, we must enter a price correction, therefore we have selected the best possible support point for you...
We will wait for a new ceiling to be registered before proceeding with the purchase transaction, but with careful risk and capital management.
*Trade safely with us*
Overview:
The GBP/USD 4-hour chart shows a potential bullish reversal after a significant downtrend. Price has formed a double-bottom pattern and has broken out of a descending trendline, signaling a shift in momentum. The chart highlights key areas of support and resistance that traders should watch for confirmation of a sustained move higher.
Key Technical Analysis:
Fake Breakout: A false breakdown below the trendline in August led to a sharp recovery, confirming a liquidity grab before a bullish continuation.
Trendline Breakout: The price has successfully broken the descending trendline (orange line), indicating potential bullish strength.
Support Zones:
Blue Zone (~1.2450 - 1.2500): A strong demand area where buyers may re-enter.
Purple Zone (~1.2120 - 1.2200): A deeper support level, acting as the last line of defense for bulls.
Fibonacci Levels & Targets:
1.2785: First key resistance level.
1.3022: A major resistance and potential breakout zone.
1.3242: Final bullish target if momentum continues.
Trade Plan:
📌 Buy Limit Entry: Around 1.2450-1.2500 (if price retests the support zone).
🎯 Target 1: 1.2785
🎯 Target 2: 1.3022
🎯 Target 3: 1.3242
🛑 Stop Loss: Below 1.2400 to minimize risk.
Conclusion:
The GBP/USD pair is showing signs of a potential bullish reversal. A short-term pullback to the blue support zone could provide an optimal buying opportunity before a strong upward move. However, a break below 1.2400 could invalidate this bullish setup, leading to a deeper correction.
🚀 Bullish Bias if Key Support Holds! 🚀

GBPUSD Analysishello friends
Considering the drop we had, now the price has made a good floor and we expect it to continue its growth, but we have to enter into price correction, so we identified the best possible support point for you...
We will wait for a new ceiling to be registered and then enter into the purchase transaction, but with risk and capital management.
*Trade safely with us*

GBPUSD: Short Setup at Key ResistanceOANDA:GBPUSD is nearing a key supply zone that has been a critical area for bearish reversals in the past. The current price action suggests sellers may regain control at this resistance level.
If bearish patterns appear, such as long upper wicks or bearish engulfing candles, I anticipate a move toward 1.25890.
However, if the price successfully breaks and holds above the zone, this would invalidate the bearish outlook and might indicate further upside.
Proper risk management is essential, given the possibility of price breaking higher.
Just my take on support and resistance zones—not financial advice. Always confirm your setups and trade with solid risk management!

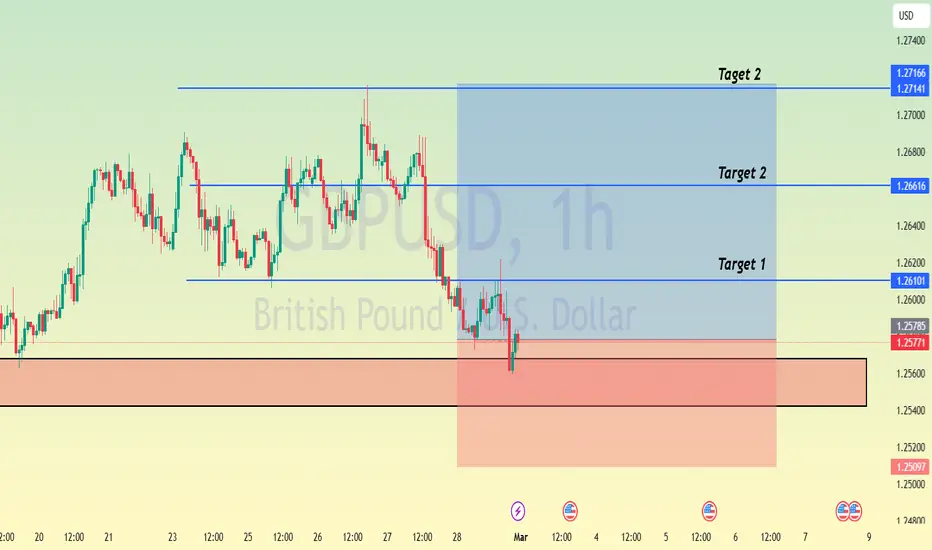
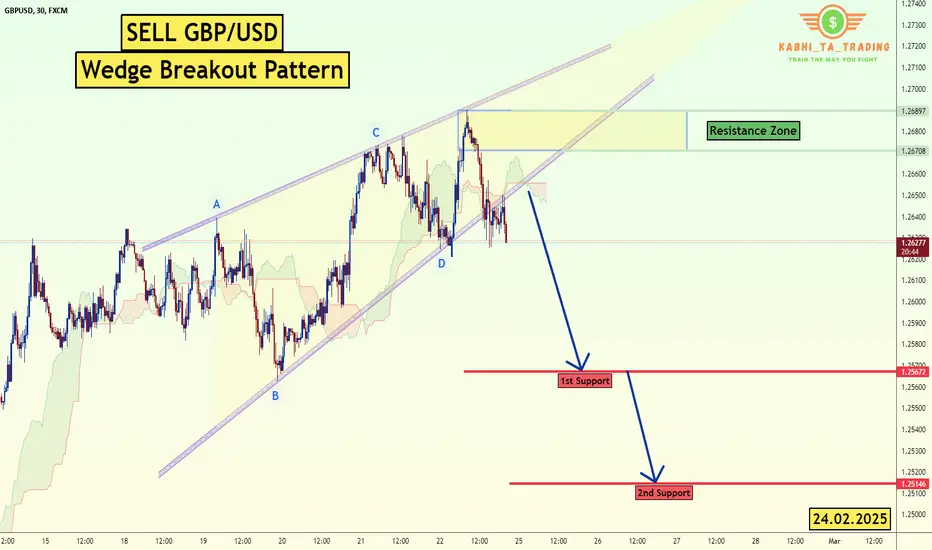
GBP/USD Wedge Breakout (24.2.25)The GBP/USD Pair on the M30 timeframe presents a Potential Selling Opportunity due to a recent Formation of a Wedge Breakout Pattern. This suggests a shift in momentum towards the downside in the coming hours.
Possible Short Trade:
Entry: Consider Entering A Short Position around Trendline Of The Pattern.
Target Levels:
1st Support – 1.2567
2nd Support – 1.2515
🎁 Please hit the like button and
🎁 Leave a comment to support for My Post !
Your likes and comments are incredibly motivating and will encourage me to share more analysis with you.
Best Regards, KABHI_TA_TRADING
Thank you.
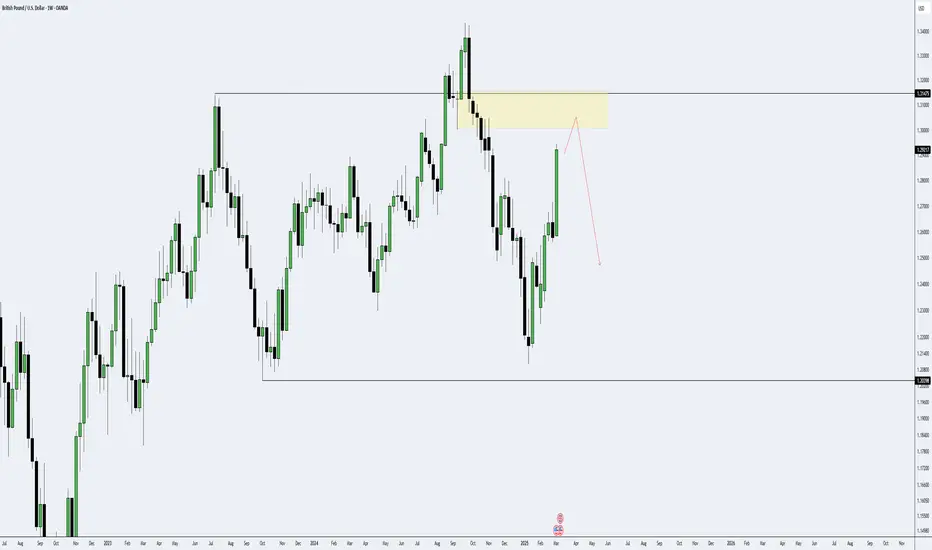
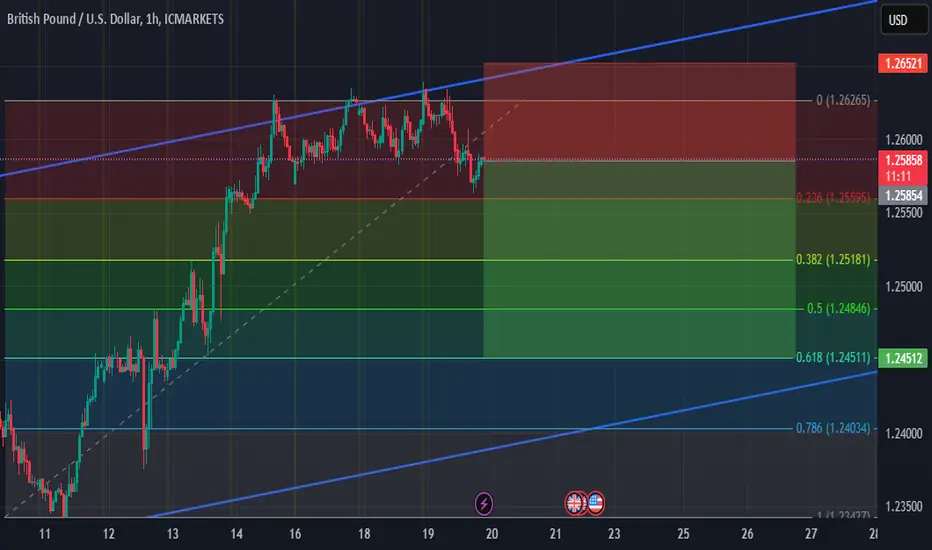
British Pound / U.S. DollarHello Dear Traders
Pound Analysis
Based on the bullish analysis of DXY, I present to you the updated analysis for the Pound. The Pound chart has confirmed its bullish daily confirmation, and I expect the major daily ceiling, which is the main price target, to reach 1.34340 in the coming weeks. However, we have a long way to go until the price reaches our target.
Currently, based on the bullish analysis of DXY, I have identified a suitable selling area in the 1-hour timeframe. Additionally, the minor 1-hour chart indicates a bullish trend. The Change of Character (CHoCH) has provided confirmation of a temporary correction in the 1-hour timeframe. Therefore, with this trend change, we can utilize this area of the Secret Order Block (1H) for entering a sell position.
Again, in the selling area, a 5-minute confirmation can help us optimize our entry into the trade.
First Support: 1.24866
1-Hour Liquidity: 123748
Potential Suitable Buying Area: 1.22928, which I will update once the price reaches this level.
Wishing you all success!
Fereydoon Bahrami
A retail trader in the Wall Street Trading Centre (Forex)
Risk Disclosure:
Trading in the Forex market is risky due to high price volatility. This analysis is solely my personal opinion and should not be considered financial advice. Please do your own research. You are responsible for any profits or losses resulting from this analysis.

Is it time to buy the US dollar?With US inflation rising, the US economy performing well, and rates higher for longer (well, I wouldn't be surprised to see the Fed hike rates by the end of 2025), the USD continues to be an obvious buy.
The TVC:DXY is currently testing key horizontal support (previously resistance) and is nearing the weekly moving averages. This could be the time to buy the dollar.
I'm personally looking to short OANDA:EURUSD OANDA:GBPUSD and OANDA:NZDUSD and buy OANDA:USDCAD and OANDA:USDCHF

GBP/USD: Distribution Signals a Drop to 1.25GBP/USD appears to be in a distribution phase, struggling to break through resistance around 1.2620. The price has formed multiple rejection points at this level, indicating weakening bullish momentum.
The recent lower high, combined with a potential break of the ascending trendline, suggests sellers are regaining control. If price breaches the key support zone, a move towards the 1.2500 region becomes increasingly likely.
With a bearish harmonic pattern and liquidity grab indications, GBP/USD could see further downside as selling pressure intensifies.

GBPUSDWe are trending UP but the price now show as weaknes for buyers and we think that gone to the level 61.8
LR
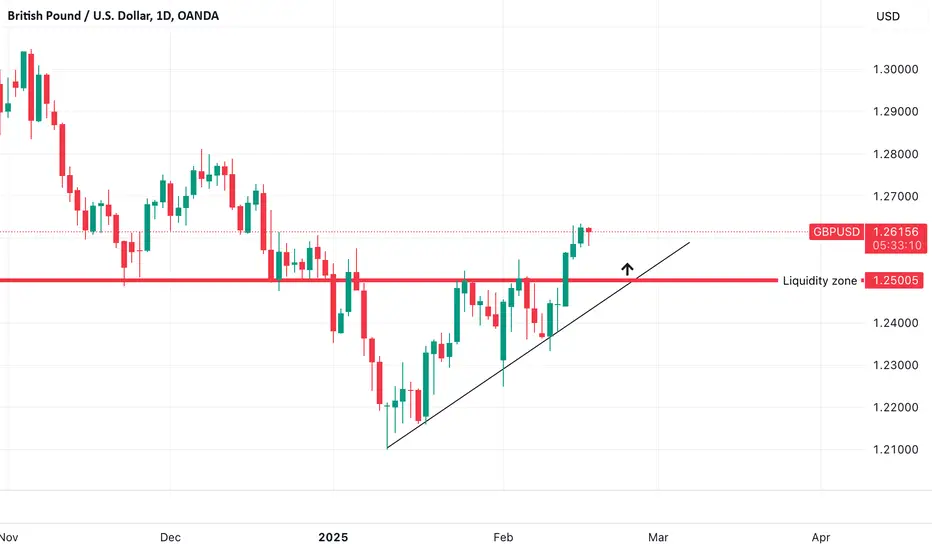
GBPUSD - Long from trendline !!Hello traders!
‼️ This is my perspective on GBPUSD.
Technical analysis: Here we are in a bullish market structure from daily timeframe perspective, so I look for a long. My point of interest is rejection from trendline + LZ around level 1.25000.
Like, comment and subscribe to be in touch with my content!
SHORT ON GBP/USDGreat setup on GU
Price is falling from a major supply zone.
I will be selling GU to the next level of Demand.

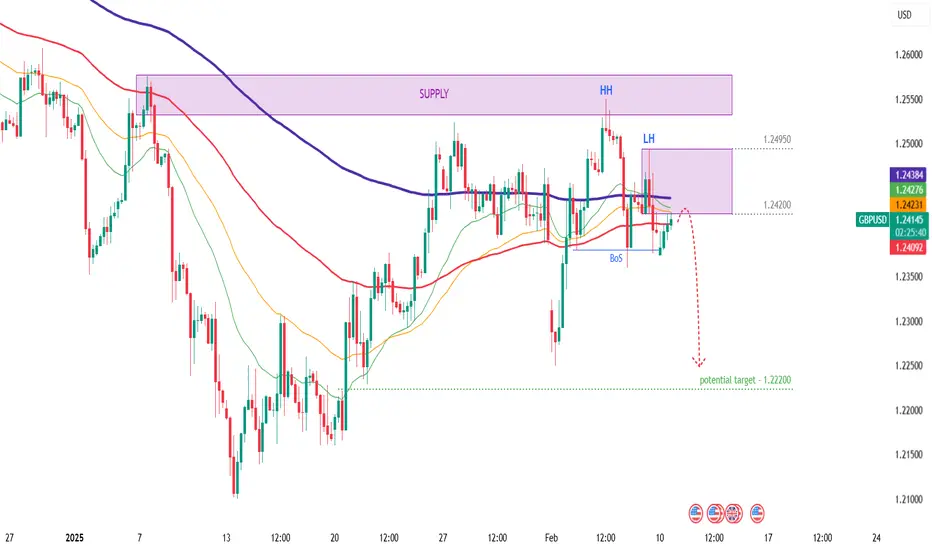
GBPUSD - Analysis and Potential Setups (Intraday- 10.02.25)Overall Trend & Context:
The OANDA:GBPUSD pair is in an overall downtrend on the higher time frames and lower time frames are in alignment.
Technical Findings:
Price broke below all EMA's - is now consolidating below.
Keep an eye on LTF supply levels between 1.24635 - 1.24530 (within 4h supply).
Bullish price action appears inherently weaker against the bears.
Potential Scenarios:
For now I will only be considering shorts.
Trade is active at 1.24150.
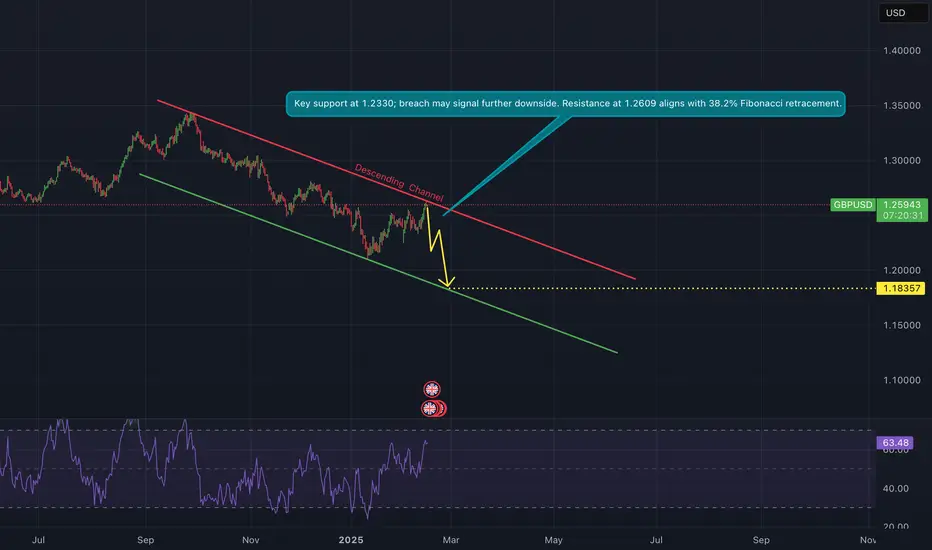
GBP/USD Bearish Outlook – Technical & Fundamental ConfluenceGBP/USD remains in a well-defined downtrend, respecting a descending channel and key resistance levels. The pair recently tested the upper boundary of the channel near 1.2609, aligning with the 38.2% Fibonacci retracement level and the 200-day moving average, suggesting strong bearish rejection.
Technical Outlook:
• Price Action: GBP/USD has formed lower highs and lower lows, indicating sustained selling pressure.
• Trendline & Resistance: The pair remains below the long-term descending trendline, with 1.2609 acting as a major resistance zone.
• Indicators:
• RSI: Approaching overbought territory, increasing the likelihood of a reversal.
• MACD: Bearish momentum is building, suggesting potential downside continuation.
• Target Levels:
• Short-term support: 1.2330 – Break below this level could trigger further downside.
• Major target: 1.1835 – A measured move projection based on the channel pattern.
Fundamental Factors:
• BoE Dovish Stance: The Bank of England recently cut rates to 4.5%, citing economic concerns, contrasting with the Federal Reserve’s steady rate policy, which supports USD strength.
• UK Inflation Concerns: Inflation is expected to rise to 2.8% due to VAT increases and higher airfares, potentially complicating BoE’s policy direction.
• US Economic Strength: Strong US economic data, including GDP growth and resilient labor markets, further bolster the USD.
• Geopolitical Uncertainty: Potential US tariffs on UK exports could add additional downside pressure on GBP.
Trade Idea:
• Bias: Bearish
• Entry: Below 1.2330 on confirmed breakdown
• Target: 1.2099, with potential for 1.1835
• Stop-Loss: Above 1.2609 to invalidate the bearish structure
Conclusion:
GBP/USD remains under selling pressure both technically and fundamentally. A confirmed breakdown below 1.2330 could accelerate bearish momentum toward the next key support levels. Traders should watch for price action signals and remain cautious of any unexpected shifts in macroeconomic data.
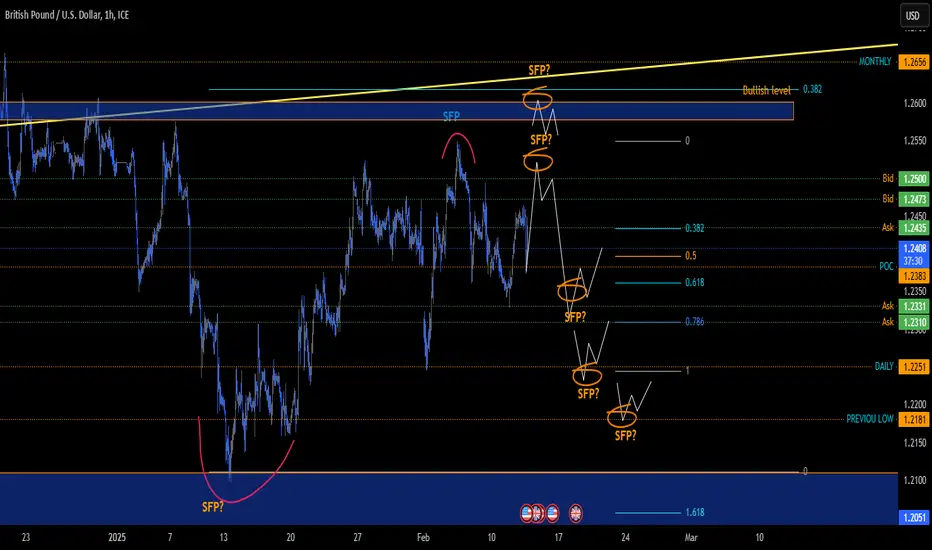
Scenario on GBPUSD 12.2.2025I see the GBPUSD market so that if I were to look for a short, the first one I like is the level for a possible sfp around the price of 1.2520, if the market were to break through the price level, then the next sfp could come into consideration around the resistance of 1.26-1.258, which is also a bulls zone, if I am to take long positions into account, the first one could come at the sfp at the level of 1.231 and the next up to the daily level 1.2251