GBPUSD: 700+ Pips Swing Buy! Get ready for big moveDear Traders,
GBPUSD our first few ideas are up and running in profit of 700+ pips, we are expecting bullish move to continue dominating the market. Now we think price is likely to remain bullish for next few weeks, while wee may also notice some correction in the market.
Want to support us?
-Please like and comment our ideas which will encourage us to post more educative posts like this. ;)
Thank you
Gbpusdsignal
GBPUSD: 2000+ Pips Buying Opportunity! Dear Traders,
Hope you are doing great, we have an excellent buying opportunity on GU which worth up to 2000 pips. Please wait for price to make correction and enter accordingly. Use accurate risk management.
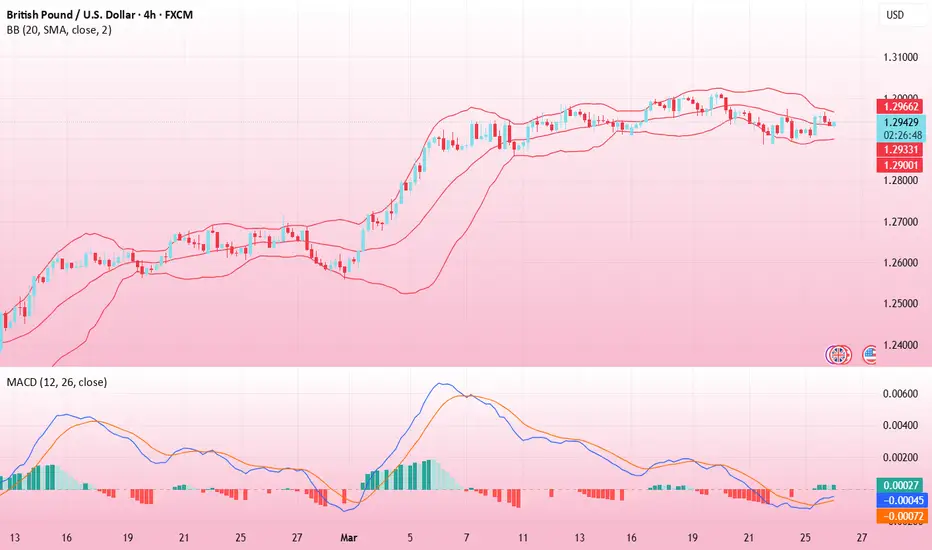
DeGRAM | GBPUSD retest of the rangeGBPUSD is in an ascending channel above the trend lines.
The price is declining from the upper boundary of the channel and has now moved closer to the lower boundary, testing the support level.
On the 4H Timeframe, the indicators indicate the pair is oversold.
The chart maintains an upward structure.
We expect a rebound after a retest of the lower channel boundary.
-------------------
Share your opinion in the comments and support the idea with a like. Thanks for your support!

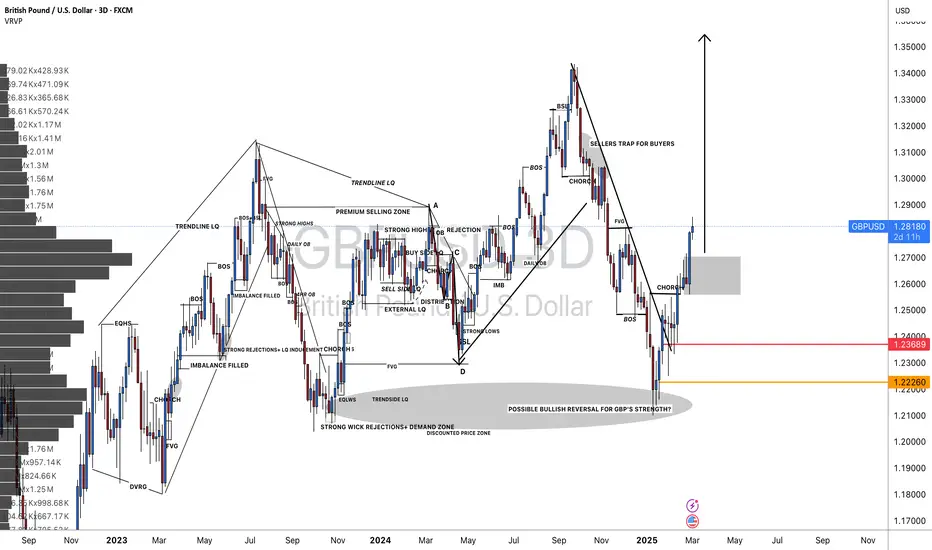
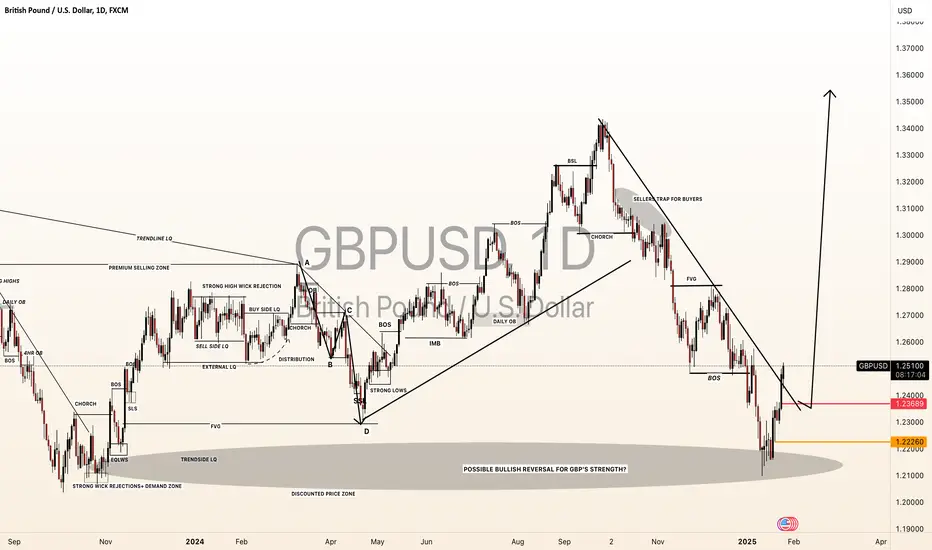
GBPUSD Analysis todayHello traders, this is a complete multiple timeframe analysis of this pair. We see could find significant trading opportunities as per analysis upon price action confirmation we may take this trade. Smash the like button if you find value in this analysis and drop a comment if you have any questions or let me know which pair to cover in my next analysis.

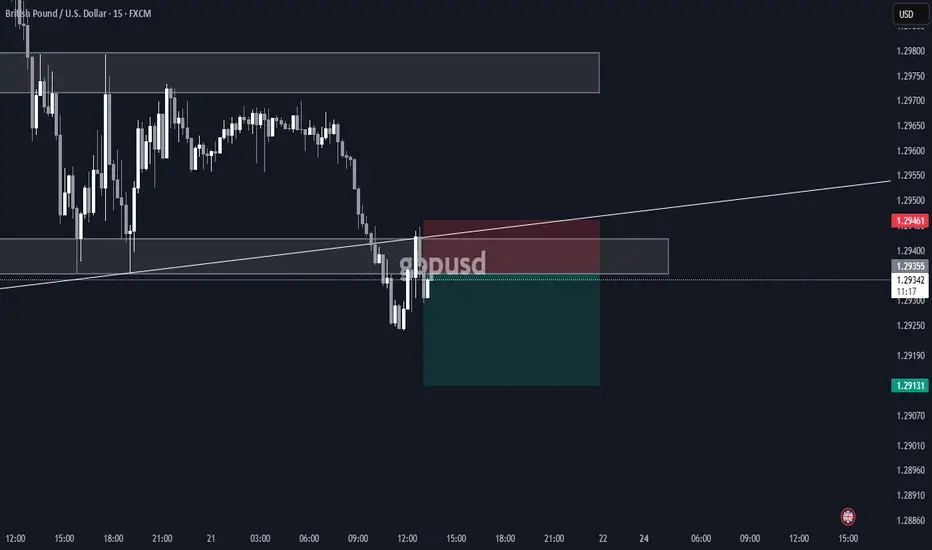
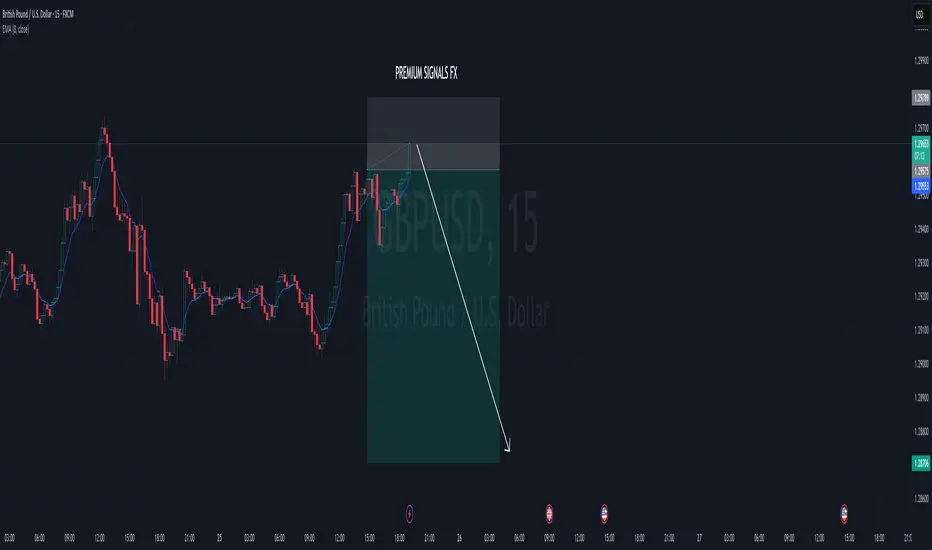
GBP/USD Technical Analysis: Key Levels and Trade SetupThis chart represents a technical analysis of the GBP/USD currency pair on a 15-minute timeframe, using exponential moving averages (EMAs) and key levels.
Key Observations:
1. EMA Indicators:
The 200-period EMA (blue) is at 1.29238.
The 30-period EMA (red) is at 1.29155.
Price is currently below the 200 EMA, indicating a potential bearish trend.
2. Support and Resistance:
Resistance Level: 1.29346 (highlighted in blue).
Support Zone: Around 1.28857 (purple highlighted area).
3. Trading Plan:
The price is currently consolidating in a range between the support and resistance levels.
If the price breaks above 1.29346, it could move towards the target of 1.29720.
If the price fails to break resistance and falls below support (1.28857), a bearish

GBPUSD(20250403)Today's AnalysisMarket news:
US trade policy-① Trump signed an executive order to establish a 10% "minimum base tariff" for all countries, and will impose reciprocal tariffs, including 20% for the EU, 24% for Japan, 46% for Vietnam, and 25% for South Korea. The tariff exemption for goods that meet the USMCA will continue, and the tariff for those that do not meet the requirements will remain at 25%; ② The US Treasury Secretary called on countries not to retaliate; ③ The base tariff will take effect on April 5, and the reciprocal tariff will take effect on the 9th. In addition, the 25% automobile tariff will take effect on the 3rd, and the automobile parts tariff will take effect on May 3rd; ④ Gold bars, copper, pharmaceuticals, semiconductors and wood products are also not subject to "reciprocal tariffs".
Today's buying and selling boundaries:
1.2976
Support and resistance levels
1.3100
1.3053
1.3023
1.2928
1.2898
1.2852
Trading strategy:
If the price breaks through 1.3023, consider buying, the first target price is 1.3053
If the price breaks through 1.2976, consider selling, the first target price is 1.2928
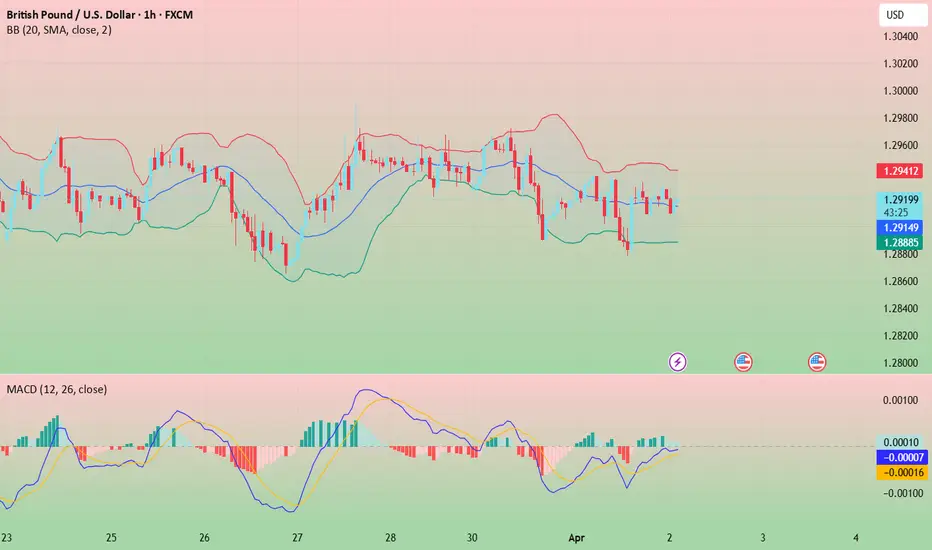
GBPUSD(20250402)Today's AnalysisToday's buying and selling boundaries:
1.2913
Support and resistance levels
1.2973
1.2951
1.2936
1.2889
1.2875
1.2852
Trading strategy:
If the price breaks through 1.2936, consider buying, the first target price is 1.2951
If the price breaks through 1.2913, consider selling, the first target price is 1.2889
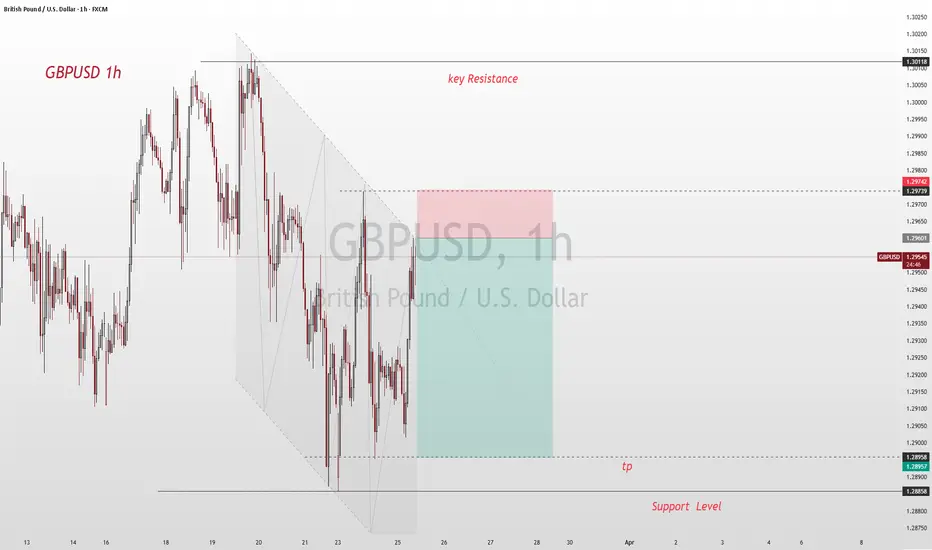
GBP/USD 1-Hour Chart Analysis: Bearish Setup with Key ResistanceGBP/USD 1-Hour Chart Analysis: Bearish Setup with Key Levels
Key Technical Indicators:
Current Price: $1.29427
30 EMA (Red Line): $1.29453 (Short-term trend)
200 EMA (Blue Line): $1.29351 (Long-term trend)
Key Resistance Zone: $1.29663 - $1.29851 (shaded purple)
Support & Target Levels:
TP 1: $1.29358
TP 2: $1.29153
TP 3: $1.28895
Final Target: $1.28662
Analysis:
Trend:
The price is struggling around the 30 EMA and 200 EMA, showing indecision.
The shaded resistance zone ($1.29663 - $1.29851) is a key area where sellers may take control.
Trade Setup:
Entry: Expected near $1.29663 (potential rejection from resistance).
Stop Loss: Above $1.29851 (to minimize risk if price breaks higher).
Take Profit Targets: Multiple levels, with the final target at $1.28662.
Bearish Confirmation:
If price gets rejected at resistance, a downside move toward support levels is likely.
A break below 1.29358 could accelerate selling pressure.
Conclusion:
The chart suggests a potential bearish trade setup, with resistance acting as a key rejection point.
Watch for confirmation signals at the resistance zone before entering a short trade.
A break above $1.29851 would invalidate the bearish outlook.

GBPUSD:This is a bullish situationThe GBP/USD is still fluctuating repeatedly at present. Taking various factors into account, there is a great deal of market noise in the current currency market, and many currency pairs are in a sideways trend.
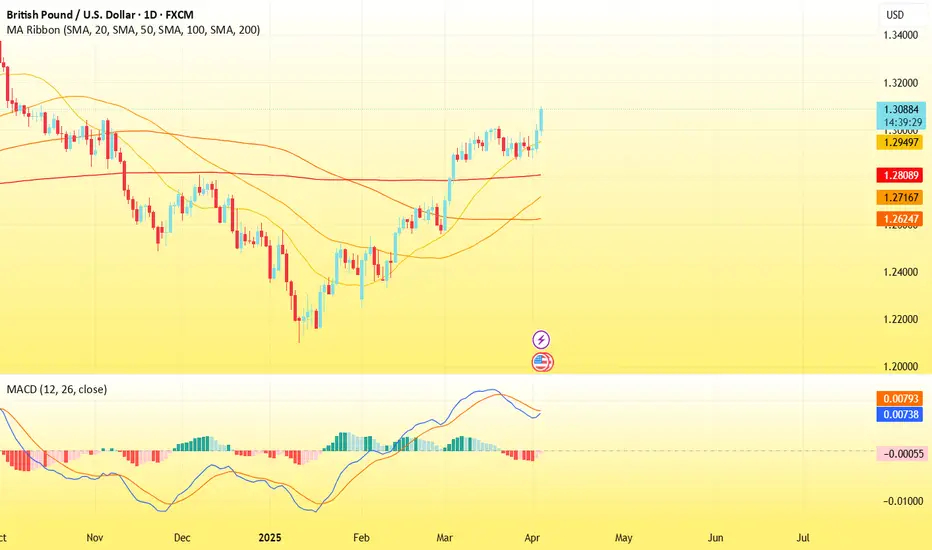
The British pound has been fluctuating sideways for several weeks, and the market is digesting the previous significant upward rally. The 1.30 level on the upside serves as a resistance level, while the 1.29 level on the downside acts as a support level. The so-called "golden cross" has recently occurred, so this is a bullish market.
Trading strategy:
buy@1.2910
TP:1.2970-1.2990
Get daily trading signals that ensure continuous profits! With an astonishing 90% accuracy rate, I'm the record - holder of an 800% monthly return. Click the link below the article to obtain accurate signals now!

GBPUSD:The strategy for next week remains bullishOn Friday, the GBP/USD traded and stopped at 1.2943, hovering near the upper end of the recent trading range. The currency pair has regained the ground above the 50-day Exponential Moving Average (EMA) at 1.2933, and currently, this level serves as an intraday support level, while the 200-day EMA at 1.2896 continues to underpin the broader momentum. The price movement is approaching the resistance zone of 1.2973 to 1.3008, which has restricted multiple rebound attempts this month. Breaking through this level may reach 1.3014. On the downside, the pivot point at 1.2937 and 1.2903 remain key levels worthy of attention. The short-term structure is constructive, but the bulls need a clear breakout to confirm the continuation of the trend beyond the resistance of the downward trend line.
Trading strategy:
buy@1.2910
TP:1.2970-1.2990
Get daily trading signals that ensure continuous profits! With an astonishing 90% accuracy rate, I'm the record - holder of an 800% monthly return. Click the link below the article to obtain accurate signals now!

GBPUSD(20250328)Today's AnalysisToday's buy and sell boundaries: 1.2936
Support and resistance levels:
1.3057
1.3012
1.2983
1.2890
1.2861
1.2816
Trading strategy:
If the price breaks through 1.2983, consider buying, the first target price is 1.3012
If the price breaks through 1.2936, consider selling, the first target price is 1.2890

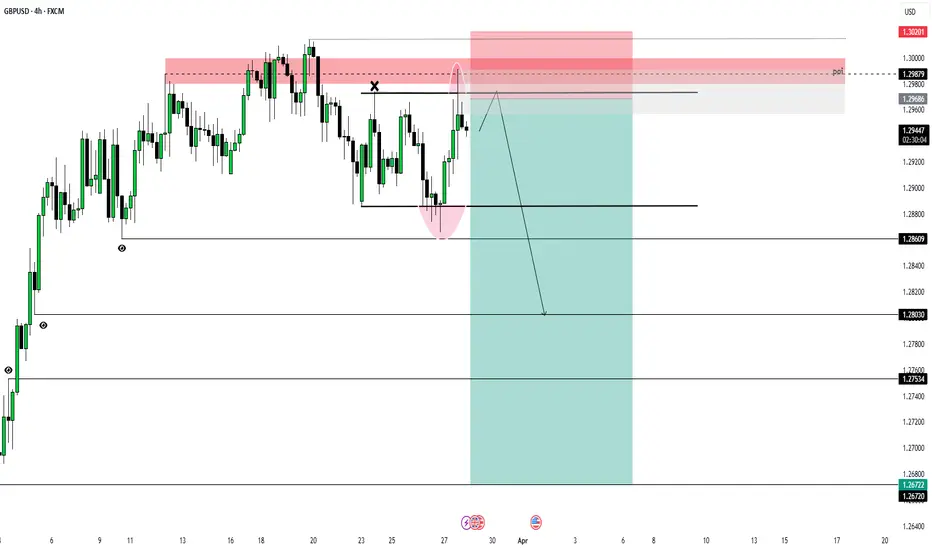
GBPUSD 4H SHORTAt the moment, GBPUSDT the asset is being marked down. There was a price reaction to the POI range from which a reaction was received instantly. I missed this moment due to personal matters, although there was a reminder. I understand that the risk of not opening, or the receipt of new variables from the market, can break the trend, but I will try to open a short from the designated mark 1.29686$
Targets
$1.28609
$1.28030
$1.27534
$1.26722
Risk for stop order -1%
GBPUSD in Correction Phase – Potential for a Short OpportunityGBPUSD ( FX:GBPUSD ) is approaching the Support zone($1.286-$1.278) , Support lines and Important Support line .
Regarding Elliott Wave theory , GBPUSD appears to have completed the microwave 5 of the main wave 3 with the help of the Ending Diagonal Pattern and is currently completing the main wave 4 . The main wave 4 is likely to have a Double Three Correction(WXY) .
I expect GBPUSD to decline at least to the Support zone($1.286-$1.278) and Support lines .
Note: If GBPUSD goes above $1.30 we should expect more pumping. The worst Stop Loss(SL) for a SHORT position could be $1.30.
Note: If GBPUSD falls below $1.2760, we should expect more dumping.
Please respect each other's ideas and express them politely if you agree or disagree.
British Pound/U.S. Dollar Analyze (GBPUSD), 4-hour time frame.
Be sure to follow the updated ideas.
Do not forget to put a Stop loss for your positions (For every position you want to open).
Please follow your strategy and updates; this is just my Idea, and I will gladly see your ideas in this post.
Please do not forget the ✅' like '✅ button 🙏😊 & Share it with your friends; thanks, and Trade safe.

GBPUSD(20250327)Today's AnalysisToday's buying and selling boundaries:
1.2897
Support and resistance levels:
1.2974
1.2945
1.2927
1.2868
1.2849
1.2821
Trading strategy:
If the price breaks through 1.2897, consider buying, the first target price is 1.2927
If the price breaks through 1.2868, consider selling, the first target price is 1.2849
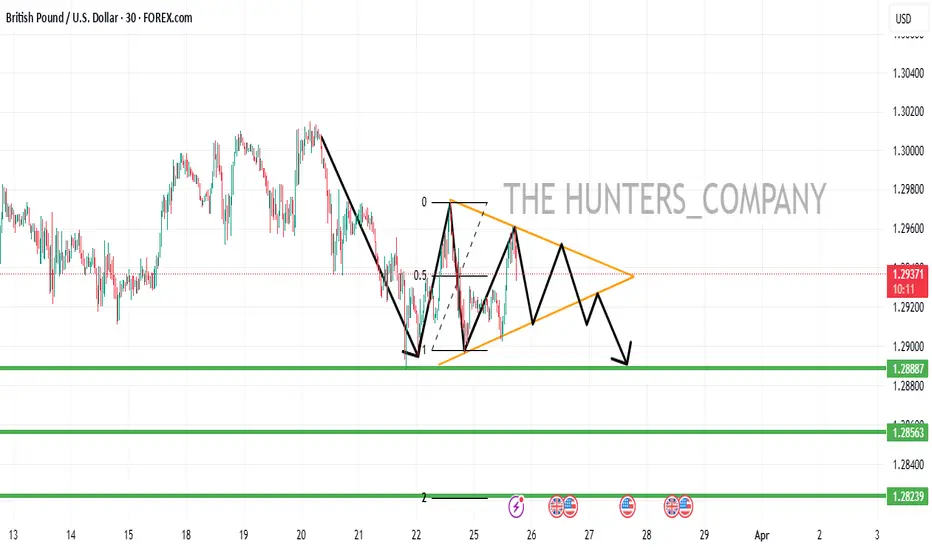
GBP/USDHello friends
You can see that a trend continuation triangle pattern is forming, which we can enter into a trade if it fails.
The targets are also specified.
*Trade safely with us*
GBP/USD Trade Analysis: Bullish Reversal from Support ZoneExponential Moving Averages (EMAs):
200 EMA (Blue) at 1.29309: Represents the long-term trend.
30 EMA (Red) at 1.29122: Represents the short-term trend.
Price is currently below both EMAs, suggesting a bearish trend.
Support and Resistance Zones:
Resistance Zone (Purple at the top): Price previously reacted strongly at this level.
Support Zone (Purple at the bottom): A potential demand area where price is currently bouncing.
Trade Setup:
Entry Point: Near 1.28875 (highlighted on the chart).
Stop Loss: Set around 1.28714-1.28856, below the support zone.
Target Point: 1.29730, above the resistance and near the 200 EMA.
Risk-to-Reward Ratio: The setup aims for a higher reward than risk.
Trade Idea:
Bullish Reversal Trade: The price is reacting at a support zone, and the target aligns with a previous resistance level.
A confirmation (strong bullish candle or break of 30 EMA) could indicate a move toward 1.29730.
EMA Crossover Watch: If the 30 EMA crosses above the 200 EMA, it may confirm a stronger uptrend.
Potential Risks:
If price breaks below 1.28714, the bullish idea is invalid.
Resistance at 1.29309 (200 EMA) could slow the move upward.

GBP/USD: Struggles at Resistance, Risks of Weak Oscillation PersDuring the European session on Tuesday, GBP/USD held steady above 1.29000. However, the technical outlook maintained a bearish bias. The US dollar strengthened due to upbeat data, suppressing the rebound of the British pound. The exchange rate faced resistance at key resistance levels when attempting to rise.
If it fails to break through these resistance levels, in the short term, it may continue the weak, oscillatory downward trend, and the downside risks still remain. The market lacks strong momentum, and overall, it stays in a weak, oscillatory pattern.
GBPUSD
sell@1.29600-1.29900
tp:1.28800
I will share trading signals every day. All the signals have been accurate for a whole month in a row. If you also need them, please click on the link below the article to obtain them.
GBPUSD(20250326)Today's AnalysisToday's buying and selling boundaries:
1.2937
Support and resistance levels:
1.3001
1.2977
1.2962
1.2912
1.2897
1.2873
Trading strategy:
If the price breaks through 1.2962, consider buying, the first target price is 1.2977
If the price breaks through 1.2937, consider selling, the first target price is 1.2912
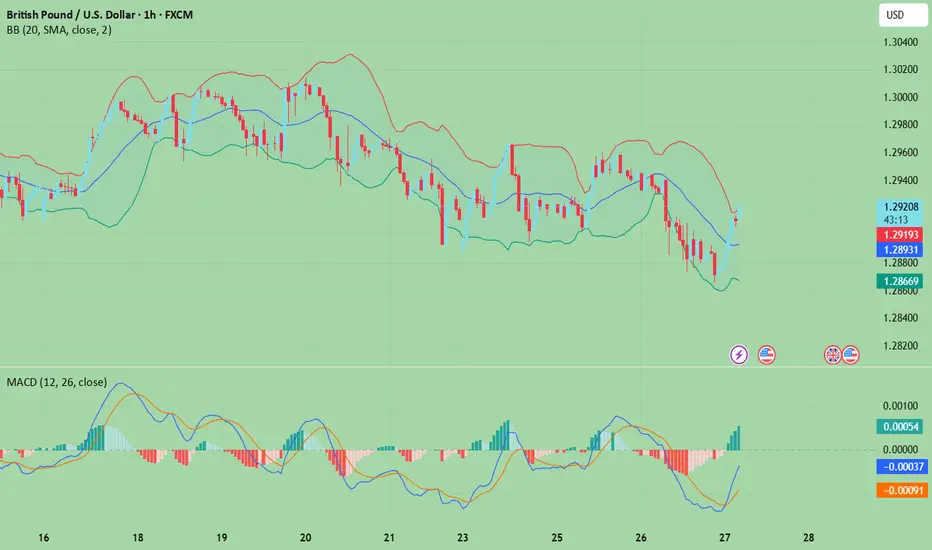
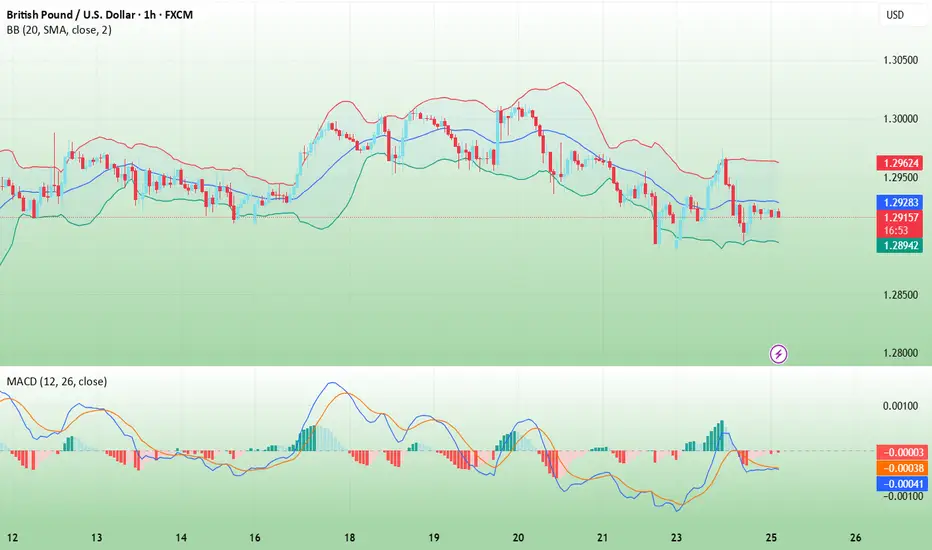
GBPUSD SHORT Until the next 1h orderblockGBPUSD Short until the next 1h orderblock. We have Bearish divergence on MACD.
GBPUSD(20250325)Today's AnalysisToday's buying and selling boundaries:
1.2929
Support and resistance levels:
1.3007
1.2978
1.2959
1.2899
1.2880
1.2850
Trading strategy:
If the price breaks through 1.2929, consider buying, the first target price is 1.2978
If the price breaks through 1.2899, consider selling, the first target price is 1.2880
EURUSD and GBPUSD Analysis todayHello traders, this is a complete multiple timeframe analysis of this pair. We see could find significant trading opportunities as per analysis upon price action confirmation we may take this trade. Smash the like button if you find value in this analysis and drop a comment if you have any questions or let me know which pair to cover in my next analysis.

GBPUSD BUY SETUPEU and GU had an SMT this morning and i'm concentrating on GU cos the setup looks cleaner over there.
let fvcking gooo!!!

GBPUSD SELLJust a quick trade—I'll update afterward. Follow for simple and effective trades faster!
1RR