GBPUSD Will Go Down!
HI,Traders !
#GBPUSD keeps falling down
And broke the
Key wide horizontal level
Around 1.33938 which is now
A resistance and the breakout
Is confirmed so we are very
Bearish biased and we will
Be expecting a bearish
Continuation !
Comment and subscribe to help us grow !
Gbpusdsignals

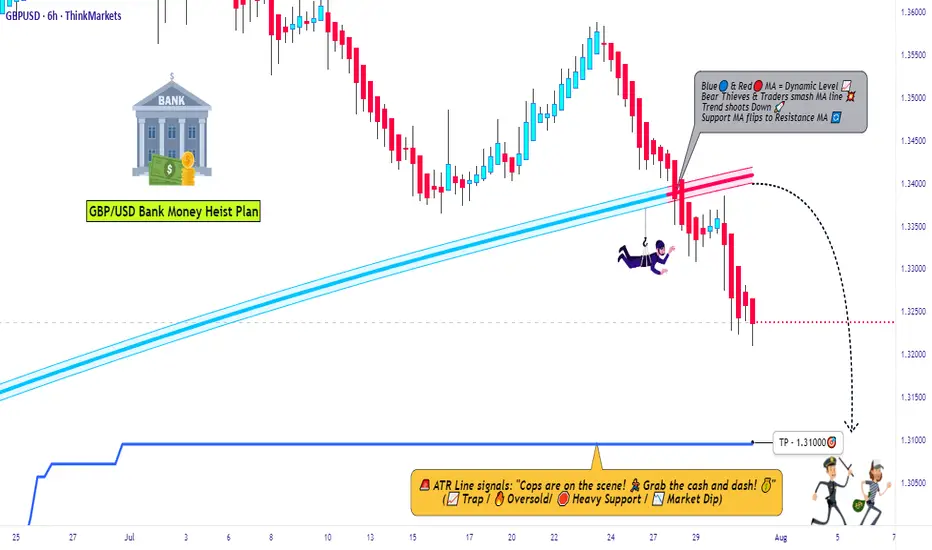
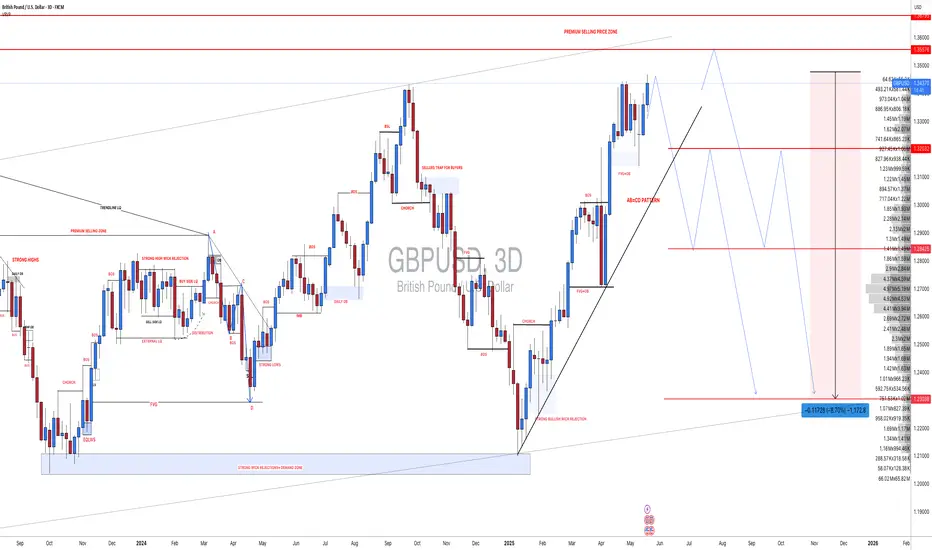
Market Trap Alert! GBP/USD Bearish Robbery Plan🔥💸 "The Cable Heist" – GBP/USD Robbery Plan Using Thief Trading Style 💸🔥
— Unfiltered Forex Forecast with Risky Intentions —
🌍 Hey Money-Makers, Market Hustlers & Chart Bandits! 🤑✈️
Hola! Bonjour! Marhaba! Hallo! Ciao! Welcome to the Forex streets where the smart rob the charts, not banks.
Ready for the GBP/USD Heist? Let’s break it down with our infamous Thief Trading Style – raw, unapologetic, and built for profits.
💼 Operation Name: “The Cable Forex Bank Robbery”
🎯 Pair: GBP/USD – aka “The Cable”
⚔️ Style: Scalp / Day Trade / Swing Heist
📊 Bias: Short (Bearish Setup)
🛠 STRATEGY SETUP: "Follow the Shadows"
🔍 Analysis Basis:
Smart-Money Traps at Key Levels
Oversold ≠ Reversal (Read between the candles)
Liquidity Hunting Zones
Retail Stop Clusters Exposed
Thief-style DCA Entries (Staggered Entry Levels)
Multi-timeframe Confirmation
COT, Sentiment & News-Driven Volatility
🎯 ENTRY ZONE:
Enter short (sell) using 15M or 30M chart.
Sell Limits near recent highs (pullback zone).
DCA (Layered Entry) recommended – Thief loves catching price slipping.
Let the liquidity work for us.
🛑 STOP LOSS (SL):
Base SL around 1.34000 on 4H Chart – above swing high.
Adjust SL per position size and total entries.
Manage risk, but remember: thieves don’t panic, they plan!
🎯 TARGET ZONE:
TP near 1.31000 or adjust using price action.
Escape before target if market mood flips – no need to be greedy.
Trail SLs if market momentum dies down.
👀 Scalpers' Special Note:
Only SHORT — don’t mess with long side unless you’re a liquidity donor.
Quick ins & outs. If you're loaded with capital, jump in big – else follow the swing team.
Use trailing SLs for safety — protect the loot.
📢 FUNDAMENTALS TO WATCH:
News Impacting GBP/USD
COT Reports
Sentiment Indicators
Macro Trends / Yield Spreads
US Dollar Strength Index (DXY)
UK Economic Reports (CPI, GDP, Rate Decisions)
⚠️ RISK MANAGEMENT TIPS:
🚨 Avoid new entries during news releases
🚨 Use trailing stops during volatility spikes
🚨 Secure running trades before major announcements
🚀 Boost the Robbery – Support the Strategy
💖 Smash that BOOST BUTTON if you're vibing with this setup. Help the Thief crew grow stronger!
Let’s keep milking the market 💸 – one “heist” at a time. Stay dangerous, stay smart.
🔓 NOTE: This isn't investment advice. Just a wild trading idea from a chart outlaw.
Always DYOR – Do Your Own Robbery (Research).
Market conditions shift fast. Stay alert, adapt, and respect your capital.
#ForexThiefStyle #CableHeist #GBPUSDShort #SmartMoneyMoves #LiquidityHunters #ChartOutlaws #TradingRebels #DayTradeLife #ScalpersParadise #ForexGang #FXHeistPlans
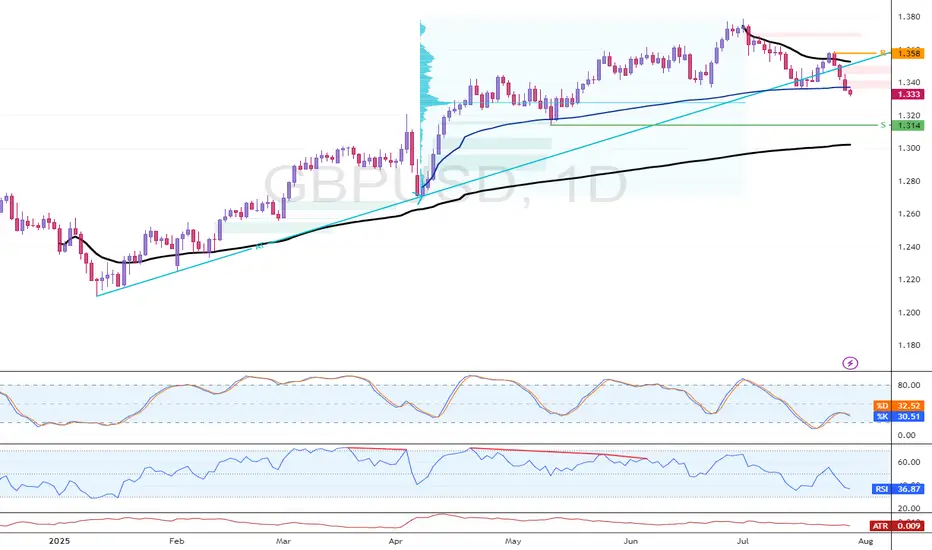
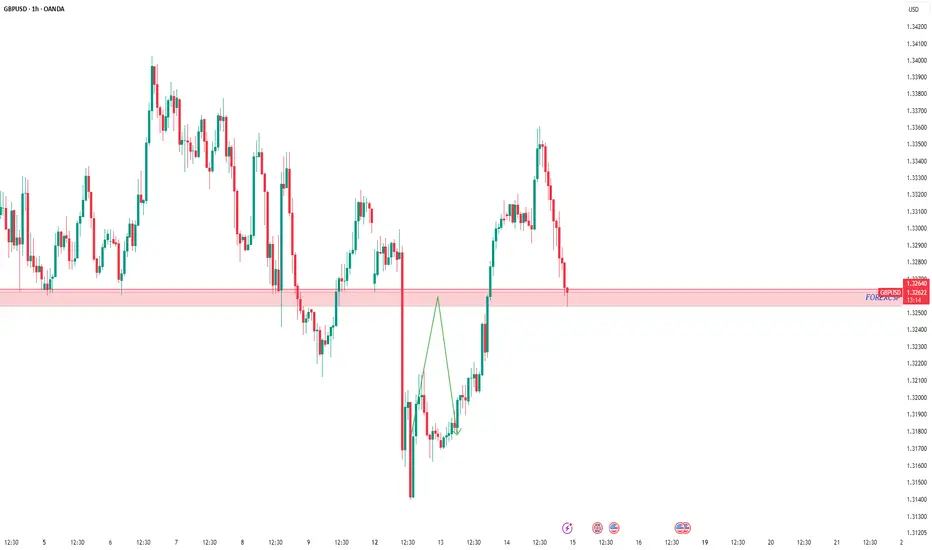
GBP/USD Weakens Below TrendlineFenzoFx—GBP/USD broke below the ascending trendline and currently trades slightly below the VWAP at $1.322. Immediate resistance is at $1.357. From a technical perspective, the downtrend will likely extend to $1.313 if this level holds.
The bearish outlook should be invalidated if GBP/USD closes and stabilizes above $1.357.
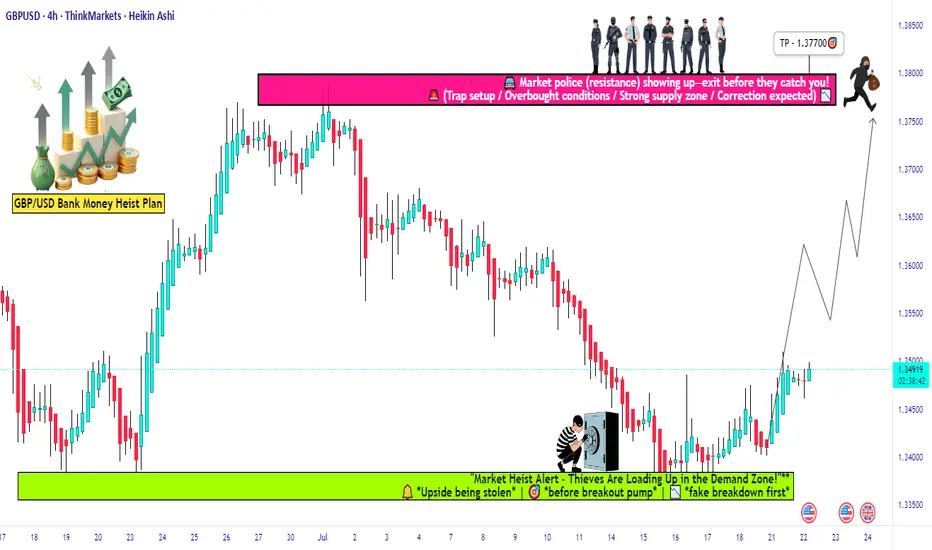
GBP/USD Long Setup: Loot & Escape Before Bears Attack!🏴☠️ GBP/USD HEIST ALERT: "The Cable" Bank Robbery Plan! 💰🚨
Thief Trading Strategy | Swing/Day Trade | High-Risk, High-Reward Loot!
🤑 DEAR MARKET PIRATES & MONEY SNATCHERS!
Based on our 🔥Thief Trading Masterplan🔥, we’re targeting the GBP/USD ("The Cable") for a bullish heist! Police barricades (resistance) are risky, but overbought markets = consolidation = TREND REVERSAL TRAP! Bears are strong here, but smart robbers take profits early!
🎯 Mission: LONG ENTRY + ESCAPE BEFORE THE POLICE (SELLERS) ARRIVE!
🔓 ENTRY: "VAULT IS OPEN!"
📍 Bullish Loot Zone: Swipe longs at any price—but smart thieves use Buy Limits near 15M/30M swing lows for pullback entries!
📍 Pro Thief Move: DCA/Layering strategy (multiple limit orders for max loot).
🛑 STOP LOSS: "DON’T GET CAUGHT!"
📍 SL @ Recent Swing Low (4H): 1.33700 (Adjust based on your risk, lot size, & entry layers!).
📍 Day/Swing Trade? Tighten SL if scalping!
🎯 TARGETS: "LOOT & BOUNCE!"
✅ 1.37700 (Main Heist Target)
✅ Scalpers: Trail SL & escape early!
✅ Swing Bandits: Hold for bigger payout!
📢 THIEF’S FUNDAMENTAL INTEL
Why GBP/USD? Bullish momentum from:
Macro Trends (COT Report, Sentiment, Liquidity Zones)
Intermarket Signals (Stocks, Bonds, Commodities)
News Trap Alerts (Avoid high-impact news chaos!)
🚨 THIEF’S GOLDEN RULES
✔ AVOID NEWS VOLATILITY! (No new trades during releases)
✔ TRAILING SL = SAFE ESCAPE ROUTE! (Lock profits like a pro)
✔ BOOST THIS IDEA! 💥 More boosts = stronger heist crew!
💎 FINAL WARNING
This is a HIGH-RISK heist! Only risk what you can lose.
Market conditions change FAST! Adapt or get caught.
Not advice—just a pirate’s plan! Do your own analysis.
🚀 NEXT HEIST COMING SOON… STAY TUNED, ROBBERS! 🏴☠️💸
Bullish Momentum Builds Above $1.3475 for GBP/USDFenzoFx—GBP/USD is testing the descending trendline as resistance. The primary trend is bullish, and if bulls close and stabilize above $1.3475, the uptrend will likely resume.
If this scenario unfolds, the next bullish target could be the resistance at $1.3525. Please note that the bullish outlook should be invalidated if GBP/USD closes and stabilizes below $1.3369.

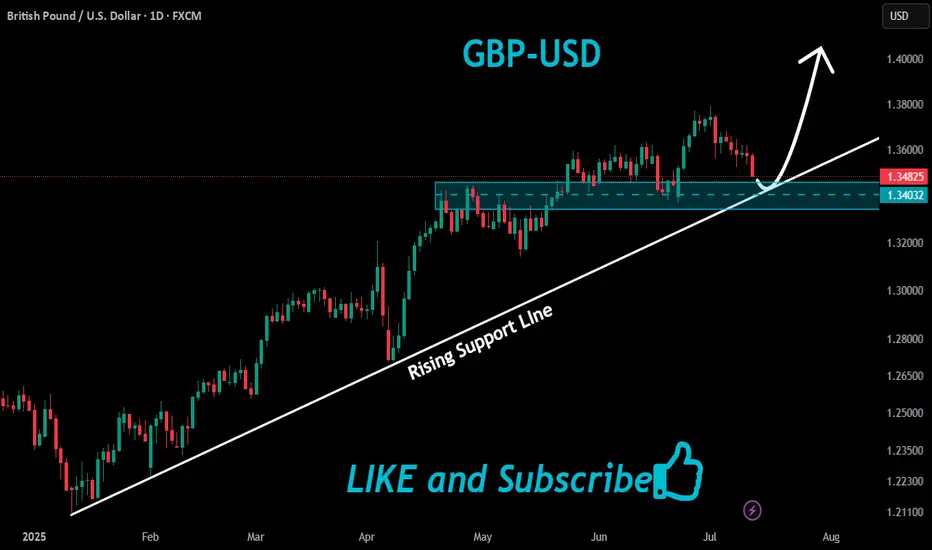
GBPUSD Long From Rising Support !
HI,Traders !
#GBPUSD is trading along
The rising support line
And the pair will soon hit
A trend-line from where we
Will be expecting a local
Bullish rebound and a
Further bullish move up !
Comment and subscribe to help us grow !
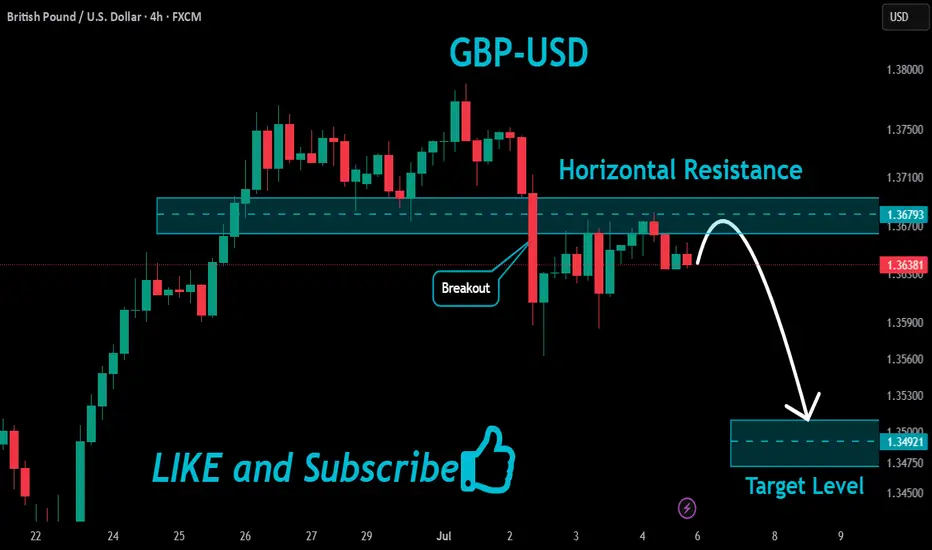
GBPUSD Resistance Ahead!
HI,Traders !
#GBPUSD made a rebound
From the support and went
Up but will now retest a
Local horizontal level
Of 1.36793 from where
We will be expecting
A local bearish reaction !
Comment and subscribe to help us grow !
GBPUSD📌 GBPUSD – Scenario-Based Plan
The first level I’ve marked is a short-term zone.
If we get a strong buy signal there with good R/R, I’ll enter and trail aggressively.
The second level is a stronger demand zone and a better area for potential long setups.
❗️Remember: These are just scenarios — not predictions.
We stay ready for whatever the market delivers.

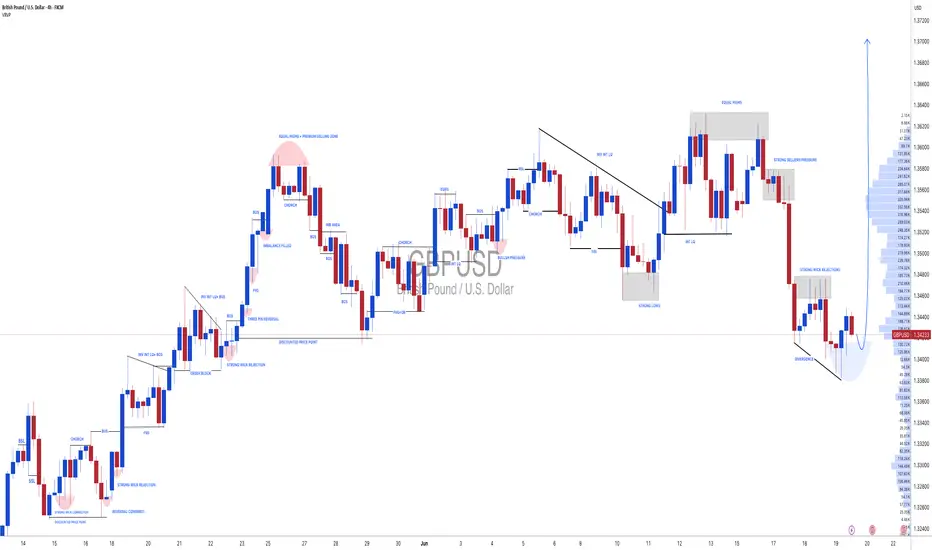
#GBPUSD: A strong bullish move incoming, comment your views The price has shown a possible price divergence, which could lead to a long-term move to 1.37. We expect the US dollar to weaken, which will likely push the price of GBPUSD to our target. Key economic data will be released later today and tomorrow, which could shape the price pattern.
Good luck and trade safely!
Team Setupsfx_
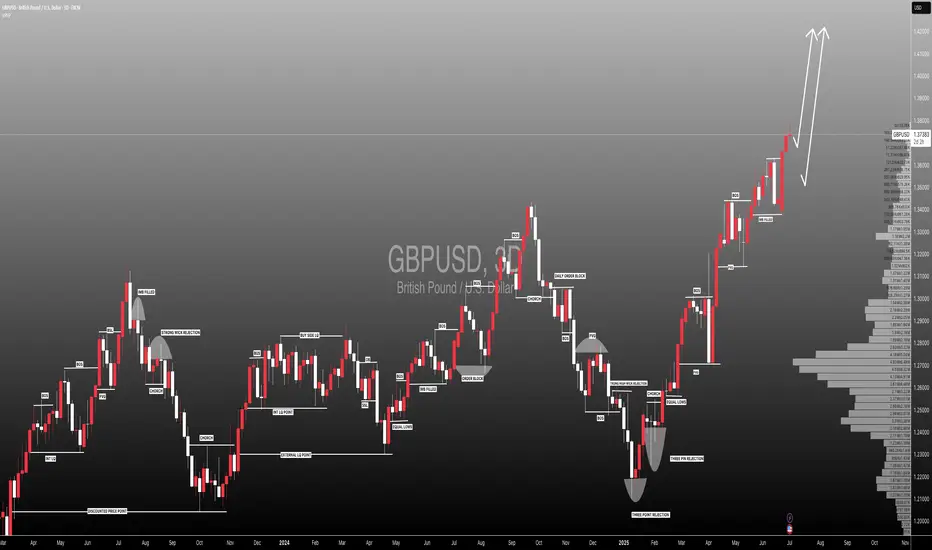
#GBPUSD: Detailed View Of Next Possible Price Move! GBPUSD exhibited a favourable movement after rejecting a pivotal level previously identified. We anticipate a smooth upward trajectory, potentially reaching approximately 1.45. Conversely, the US Dollar is on the brink of collapse around 90, which will directly propel the price into our take-profit range.
During GBPUSD trading, it is imperative to adhere to precise risk management principles. Significant news is scheduled to be released later this week.
We kindly request your support by liking, commenting, and sharing this idea.
Team Setupsfx_
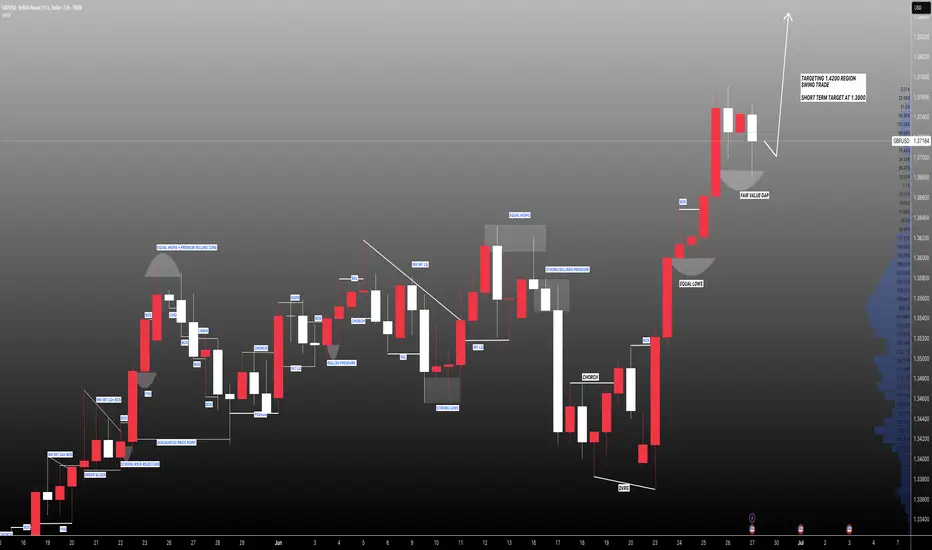
GBPUSD: Targeting 1.4200 Swing Move Target! Swing Trading GBPUSD: We’ve identified a key reversal zone where our long-term take-profit target is set at 1.4200. This is a long-term approach, but in the short term, we could target 1.3900, which is a reasonable take-profit area. Before taking any buying entry, please do your own analysis.
Good luck and trade safely!
Like
Comment
Share
Team Setupsfx_
GBP/USD Robbery: Can You Grab the Cash Before the Cops Arrive?🚨 GBP/USD "The Cable" forex bank Heist Alert: The Bullish Breakout Robbery Plan (Swing & Scalp Strategy) 🚨
🌟 Hi! Hola! Ola! Bonjour! Hallo! Marhaba! 🌟
Attention Money Makers & Market Robbers! 🤑💰💸
Based on the 🔥Thief Trading Style🔥, here’s our master plan to loot the GBP/USD "The Cable" forex bank. Follow the strategy on the chart—focusing on LONG entries—and escape near the high-risk Red Zone. This area is overbought, consolidating, and a potential reversal trap where bears lurk. 🏆 Take profits fast—you’ve earned it! 💪
🎯 Heist Entries:
📈 Entry 1: "The Breakout Heist!" – Wait for Resistance (1.36200) to break, then strike! Bullish profits await.
📈 Entry 2: "Big Players’ Pullback!" – Jump in at 1.34000+ buy above at any price for a safer steal.
🔔 Pro Tip: Set a chart alert to catch the breakout instantly!
🛑 Stop Loss Rules:
*"Yo, listen! 🗣️ If you’re entering with a buy-stop, DON’T set your SL until AFTER the breakout. Place it at the nearest swing low (3H timeframe) or wherever your risk allows—but remember, rebels risk more! 🔥"*
🏴☠️ Target: 1.37500
🧲 Scalpers: Only play LONG! Use trailing SL to lock in profits. Big wallets? Go all in. Small stacks? Join the swing heist!
📊 Market Pulse:
The GBP/USD "The Cable" is neutral but primed for bullish momentum. Watch:
Fundamentals (COT, Macro, Geopolitics)
Sentiment & Intermarket Trends
Positioning & Future Targets & Overall score
📌 Check our bioo linkks for deep analysis! 🔗🌍
⚠️ Trading Alert:
News = Volatility! Protect your loot:
Avoid new trades during major news
Use trailing stops to secure profits
💥 Boost This Heist!
Hit 👍 & 🔄 to strengthen our robbery crew! Let’s dominate the market daily with the Thief Trading Style. 🚀💵
Stay tuned—another heist drops soon! 🎯🐱👤

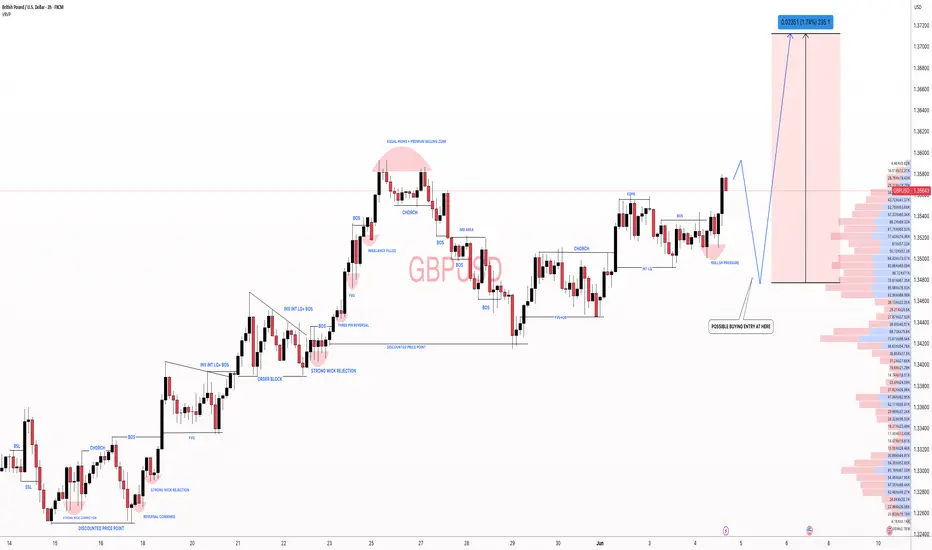
How I’m Planning My Next GBPUSD Trade Setup📉 GBPUSD Analysis Update
Currently keeping a close eye on GBPUSD 👀. On both the Daily and 4H charts, we’ve seen a strong bullish rally, driving price into a premium zone and tapping into key buy-side liquidity resting above previous highs 🔼💧.
The pair now appears overextended and is trading into a significant resistance level 🧱. Given this context, I’m anticipating a potential retracement. If we see a pullback followed by a clean bullish break in market structure, that’s when I’ll be looking to enter a long position 🎯📈.
⚠️ As always, this is not financial advice — just sharing my personal view of the markets.

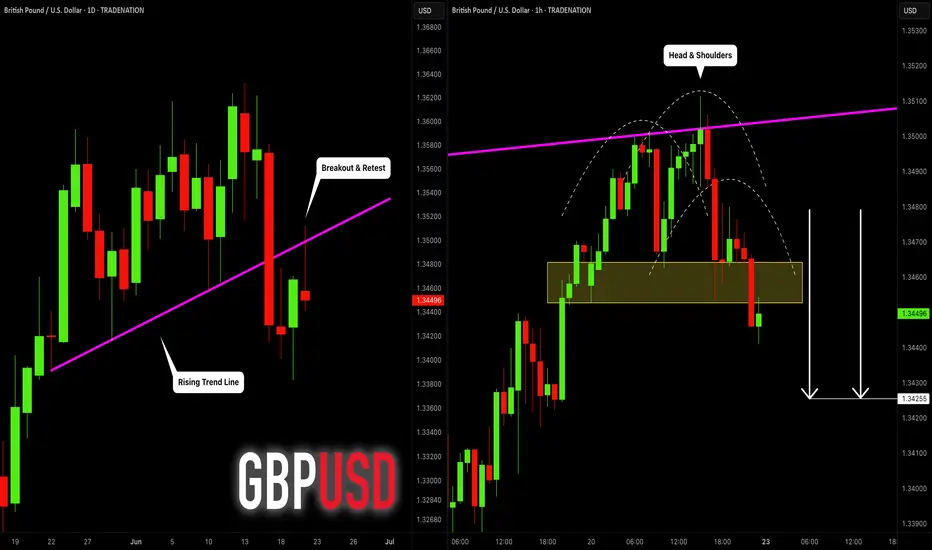
GBPUSD: Bearish After Opening 🇬🇧🇺🇸
There is a high chance that GBPUSD will drop after the market opening.
I see a strong bearish confirmation after a test of a recently broken trend line.
The price formed a head & shoulders pattern and violated its neckline
on an hourly time frame.
Goal - 1.3425
❤️Please, support my work with like, thank you!❤️
I am part of Trade Nation's Influencer program and receive a monthly fee for using their TradingView charts in my analysis.
GBPUSD hit its 1D MA50. Perfect buy signal.The GBPUSD pair has been trading within a Channel Up pattern since the January 13 2025 market bottom. Yesterday it hit its 1D MA50 (blue trend-line) for the first time since April 08.
This is the most efficient buy entry as the 1D MA50 has been supporting since the February 13 break-out. Even the 1D CCI turned oversold and rebounded, which is consistent with all bottom buys inside the Channel Up.
The Bullish Leg can extend to as high as +5.05% but due to the presence of the Inner Higher Highs trend-line, we first target 1.3850 (+3.43% rise).
-------------------------------------------------------------------------------
** Please LIKE 👍, FOLLOW ✅, SHARE 🙌 and COMMENT ✍ if you enjoy this idea! Also share your ideas and charts in the comments section below! This is best way to keep it relevant, support us, keep the content here free and allow the idea to reach as many people as possible. **
-------------------------------------------------------------------------------
💸💸💸💸💸💸
👇 👇 👇 👇 👇 👇

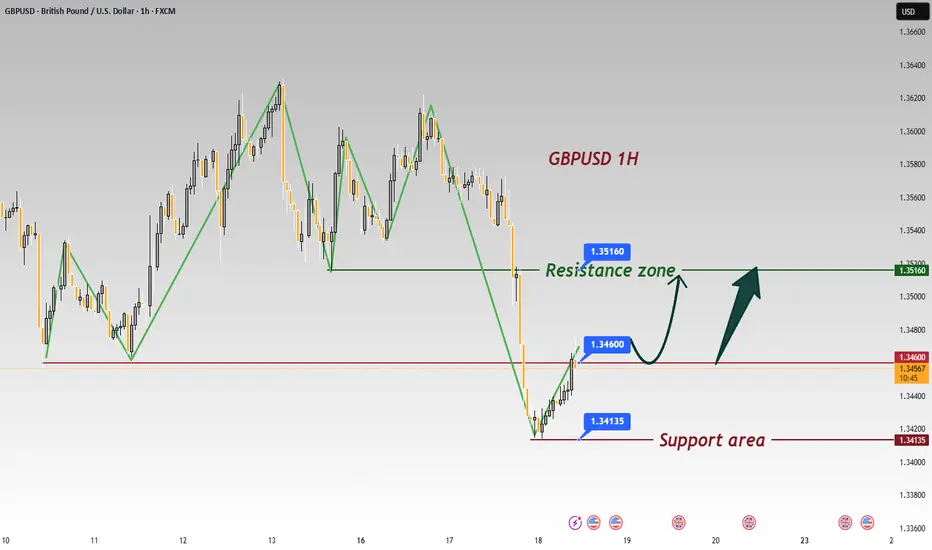
Analysis of GBPUSD 1-Hour Chart Signaling Bullish TrendAnalysis of GBP/USD 1-Hour Chart Signaling Bullish Trend 📈
I. Support Levels & Chart Patterns
Support Confirmation
After testing the 1.34135 support zone, price rebounded sharply with consecutive bullish candles 🚀, forming a potential "double bottom" pattern (or wave low). This successful defense of support reinforces the foundation for upward movement 🏗️.
Resistance Breakout Potential
Price is currently advancing from the 1.34600 short-term support. The key resistance lies at 1.35160. A decisive breakout above this level would validate the bullish projection indicated by the upward arrows on the chart 🎯
⚡️⚡️⚡️ GBPUSD ⚡️⚡️⚡️
🚀 Buy@ 1.33500 - 1.34000
🚀 TP 1.35000 - 1.35500
Accurate signals are updated every day 📈 If you encounter any problems during trading, these signals can serve as your reliable guide 🧭 Feel free to refer to them! I sincerely hope they'll be of great help to you 🌟 👇
#GBPUSD: Smaller Time-Frame Tells A Different Story! GBPUSD has exhibited strong bullish sentiment in shorter timeframes. However, an analysis of shorter timeframes reveals a different picture. The current price trend is upward, and it is anticipated to continue. Nevertheless, we anticipate a price correction around 1.3470, followed by a continuation of the bullish move. We strongly recommend conducting your own analysis before making any investment decisions.
Best of luck in your trading endeavours, and please remember to prioritise safety.
Kindly consider liking, commenting, and sharing this analysis for further insights.
Team Setupsfx_
GBPUSD Trade IdeaThe GBPUSD pair is showing a strong bullish trend on the 4-hour chart. However, the price currently looks overextended. This suggests the market may be due for a corrective pullback.
I’m watching for a pullback into a discounted zone near the fair value gap.
If the price moves back into this zone, I’ll look for a bullish break of market structure as a signal to enter long.
This plan emphasizes patience and the importance of waiting for a favorable entry rather than chasing an extended move. As always, this is my personal strategy and not financial advice. Proper risk management and discretion are essential.

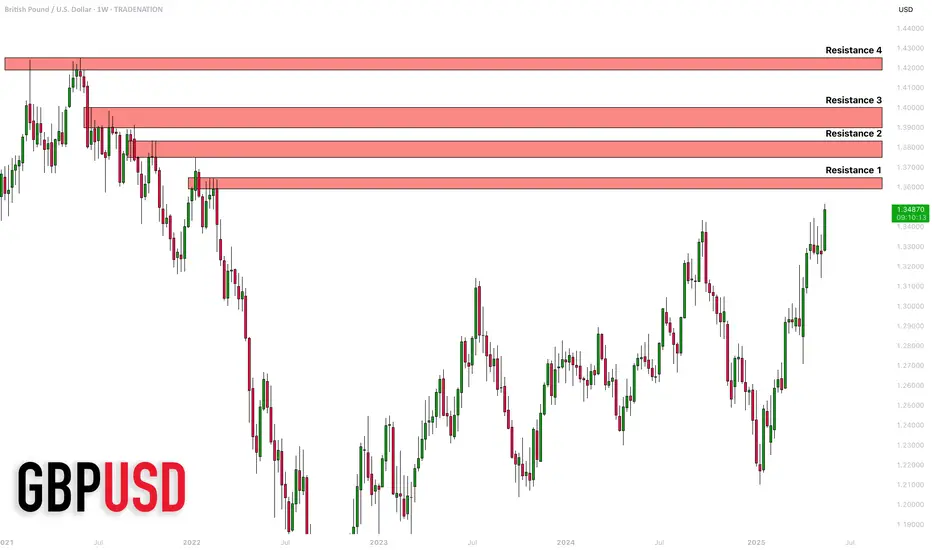
GBPUSD: The Next Historic Resistances 🇬🇧🇺🇸
GBPUSD keeps rising.
Here are the next historic resistance that the price
may head towards.
Resistance 1: 1.359 - 1.365 area
Resistance 2: 1.375 - 1.383 area
Resistance 3: 1.390 - 1.400 area
Resistance 4: 1.419 - 1.425 area
Resistance 1 is most likely going to be the next goal for the bulls for now.
❤️Please, support my work with like, thank you!❤️
I am part of Trade Nation's Influencer program and receive a monthly fee for using their TradingView charts in my analysis.
GBPUSD: Will DXY Bounce Back? |GBPUSD Swing Sell|The GBPUSD pair is currently rallying towards a potential selling zone, where sellers could push the price down. However, the main concern is the current state of the DXY, which clearly indicates another sell-off and could lead to another lower low. Please remember to use risk management while trading forex pairs.
There are three take-profit targets that can be set according to your trading plan. This analysis doesn’t guarantee that the price will move as described.
Good luck and trade safely!
Thank you for your unwavering support! 😊
If you’d like to contribute, here are a few ways you can help us:
- Like our ideas
- Comment on our ideas
- Share our ideas
Team Setupsfx_
❤️🚀
GBPUSD: Bulls Are Gearing Up For The Next RallyBullish Confirmations:
- Double bottom formed at QP at end of last week
- Creating HLs and HHs
- Bullish Choch
- Multiple bullish FVGs (showing bullish momentum)
- Multiple bullish breaker blocks
🟢ENTRY 1.33578
SL 1.331
TP1 1.33778
TP2 1.34078
TP3 1.34578
There's a chance we may get a deeper pullback. If so no big deal, we'll just catch a better entry.

GBPUSD pullbackOANDA:GBPUSD
As shown in our pinned analysis, this level was previously considered for a short trade. But after being broken, according to our plan, it has now turned into a buy zone.
We are ready to enter a long position,
but if the price drops below and holds, this level will lose its validity and the analysis will be invalid.
Follow us for more trades analysis!
For detailed entry points, trade management, and high-probability setups, follow the channel:
ForexCSP
#GBPUSD: Risk Entry Vs Safe Entry, Which One Would You Chose? The GBPUSD currency pair presents two promising opportunities for entry, potentially generating gains exceeding 500 pips. However, entering these markets carries a substantial risk of stop-loss hunting during the commencement of the week. Conversely, adopting a safe entry strategy offers a favourable chance for a bullish position.
We encourage you to share your thoughts and feedback on our ideas. ❤️🚀
Team Setupsfx_
