GBPUSD: Eyeing a Bullish Structure Shift - A Wyckoffian ApproachGBPUSD 🚦 Technical Analysis & Trade Plan
📊 Current Market Structure
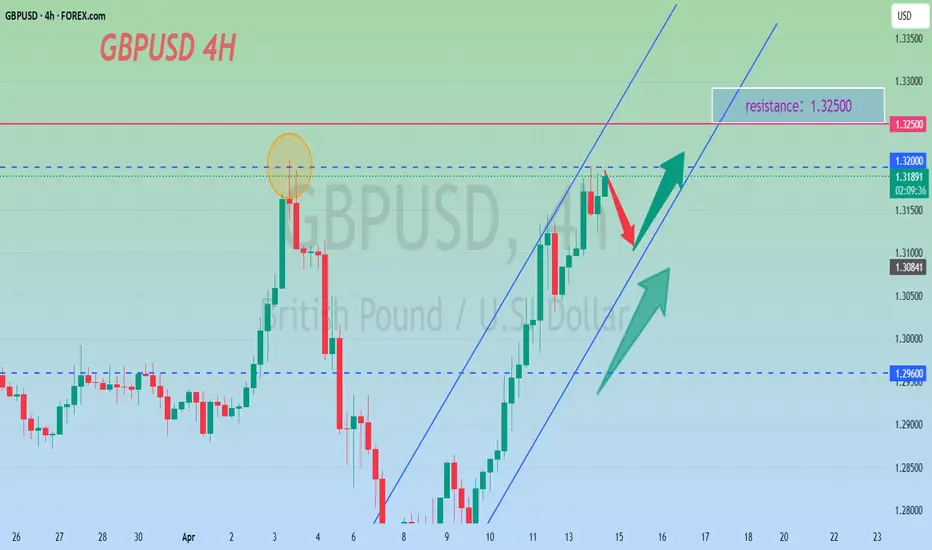
The GBPUSD 4-hour chart is currently consolidating just below a set of equal highs, indicating a potential liquidity pool above. Price action has shown a series of higher lows, suggesting underlying bullish pressure. The market is in a range, with buyers and sellers in equilibrium, but the clustering of highs signals a likely stop-hunt or breakout scenario.
🧠 Wyckoff Perspective
From a Wyckoff standpoint, the market appears to be in the late stages of accumulation. The equal highs represent a classic “creek” or resistance, where smart money may engineer a breakout to trigger stops and induce breakout traders. A successful breakout, followed by a retrace to retest the broken highs (now support), and a subsequent bullish structure break, would confirm the presence of strong demand and the start of a mark-up phase.
🌍 Fundamental Backdrop
Fundamentally, GBP has been supported by resilient UK economic data and a slightly hawkish tone from the Bank of England, while the USD faces headwinds from softer inflation prints and dovish Fed rhetoric. However, geopolitical risks and global risk sentiment remain key drivers, so any sudden shifts could impact the pair.
📰 Current Sentiment
Market sentiment is cautiously optimistic for GBPUSD. CFTC positioning shows a reduction in net GBP shorts, and recent price action reflects a willingness to buy dips. However, the presence of equal highs suggests that many traders are watching for a breakout, increasing the likelihood of a stop-run before a genuine move higher.
🏦 Trade Idea
Entry: Buy on a confirmed break above the current equal highs (around 1.3340), wait for a retrace to retest the broken highs, and enter long on a bullish structure break (e.g., a higher low and bullish engulfing candle).
Stop Loss: Place stops below the retracement low (e.g., below 1.3300).
Take Profit: Target the next significant resistance zone (e.g., 1.3400–1.3450), scaling out as price approaches these levels.
Risk Management: Risk no more than 1–2% of your trading capital on this setup.
⚠️ Disclaimer
Trading forex involves significant risk and may not be suitable for all investors. The analysis and trade idea provided are for educational purposes only and do not constitute financial advice. Always conduct your own research and consult with a licensed financial advisor before making trading decisions.
Gbpusdtrade

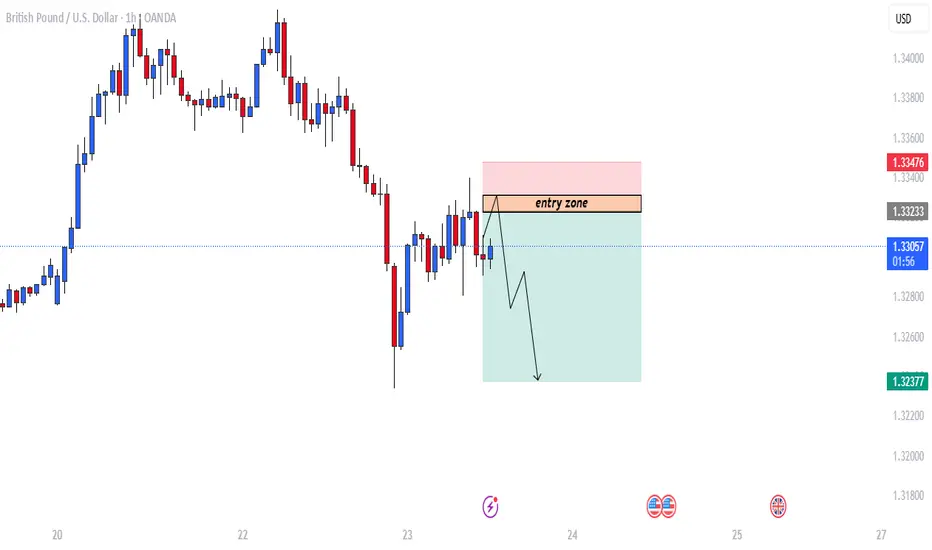
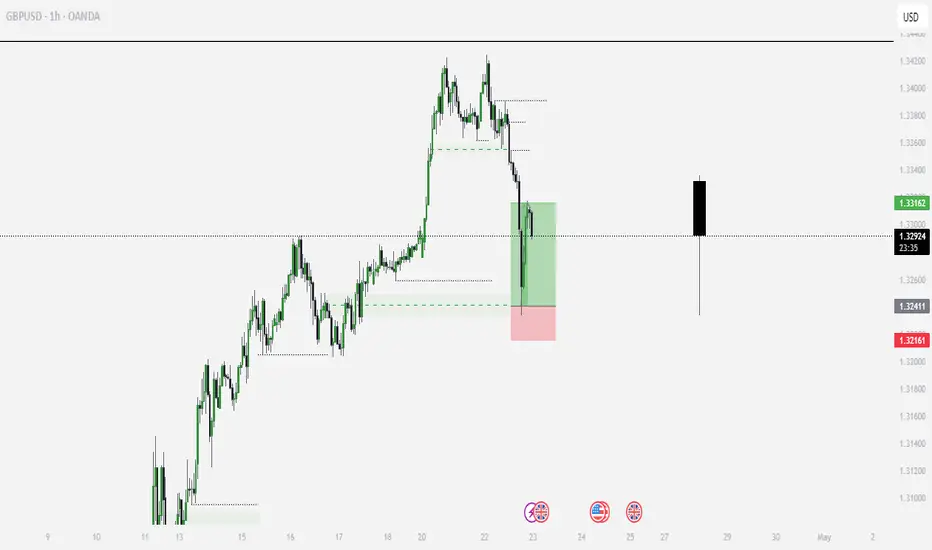
GBPUSD trade setup.This chart shows a GBP/USD (British Pound / U.S. Dollar) trading setup on the 1-hour timeframe, with a bearish outlook.
📊 Chart Analysis
Trend: Recently bearish after a previous uptrend.
Entry Zone: Area between approximately 1.33233 and 1.33317.
Setup Type: Sell/Short Trade Setup
🔍 Key Zones
Entry Zone (Supply/Resistance Area):
Marked as "entry zone".
This is the expected area where price might retrace to before dropping again.
Target Zone:
Arrow points down towards 1.32377, suggesting this is the Take Profit (TP) level.
Stop Loss (SL):
Slightly above the entry zone, near 1.33476, indicating risk management in case price continues upward.
🧠 Trade Idea Summary
Type: Short/Sell
Entry: Wait for price to re-enter the marked "entry zone" (~1.33233 - 1.33317).
Stop Loss: Above 1.33476.
Take Profit: Around 1.32377.
Risk/Reward Ratio: Favorable, as the potential profit zone (green area) is larger than the risk (red area).
#GBPUSD: Major Swing Sell Coming On GU, What's your views? OANDA:GBPUSD , as discussed in our previous analysis, where we predicted price would reach our target area and then reject it. The price has almost reached this area, and we are now waiting for it to fully complete the move so that we can take a swing sell on the GBP. Currently, the British pound is stronger and bullish due to the UK’s strong economic growth. However, this is not the case for the US dollar. The dollar is struggling to keep up with other currencies and is currently the worst-performing currency of the month of April.
While focusing on GBPUSD as a pair, it has been extremely bullish since the start of April. However, we are now at a point where there are no strong reasons for the pair to remain bullish and continue its uptrend. There are fundamental signs that will eventually reverse the bearish trend.
Our advice to all is to wait for the price to do its thing. Once it reaches our target area, it may show strong bearish dominance. However, this is not a guarantee that it will behave as we expect. There are two targets that you can focus on once you trade is activated.
Good luck and trade safely!
Thank you for your unwavering support! 😊
If you’d like to contribute, here are a few ways you can help us:
- Like our ideas
- Comment on our ideas
- Share our ideas
Team Setupsfx_
❤️🚀
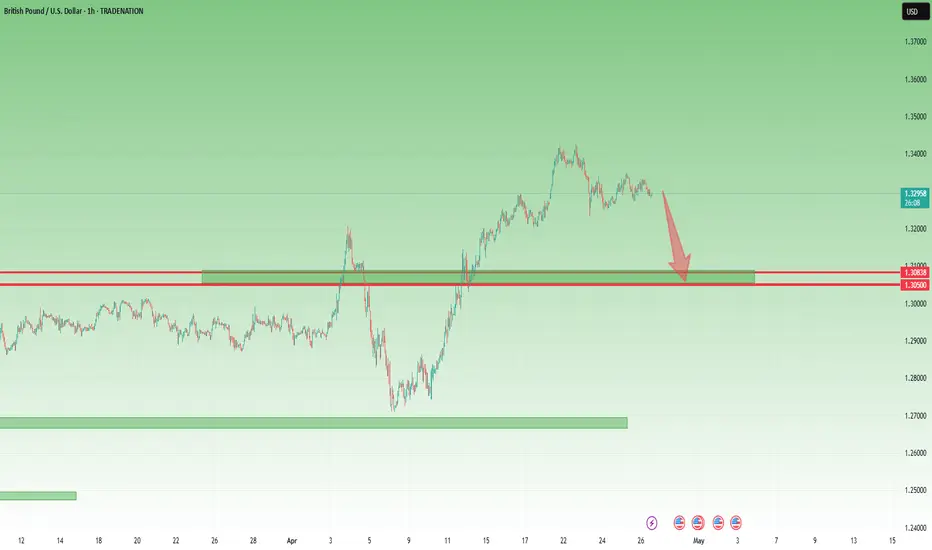
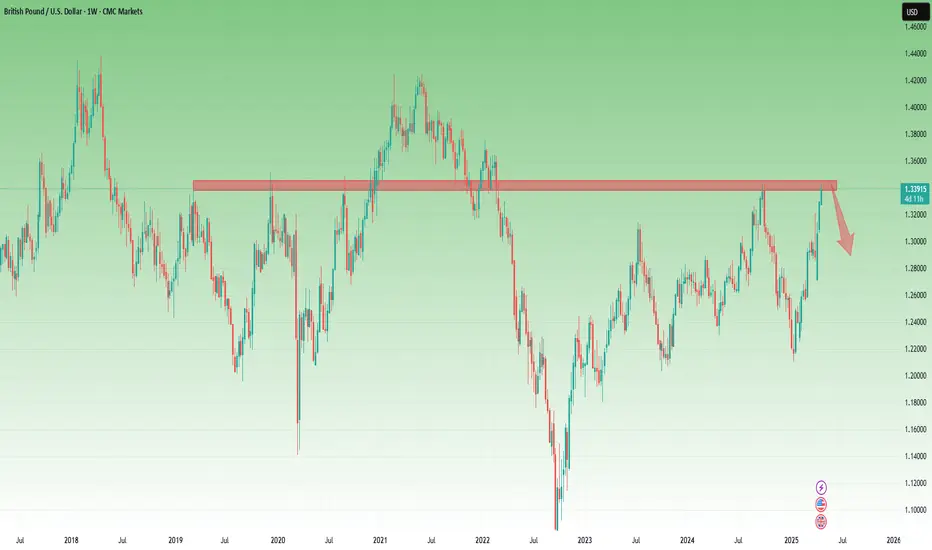
GBPUSD Rejected at Key Resistance – Bearish Outlook StaysLast week, in my GBPUSD analysis, I highlighted that the pair had reached a major resistance area – a level that has acted as both support and resistance over the past few years. I mentioned that a correction from this zone was very likely.
The market reacted perfectly: GBPUSD dropped from that resistance, and after the initial move, it entered into a consolidation phase.
The key question now: Is the correction finished or will the downside continue?
My outlook remains the same – I still expect further downside towards the 1.3000 level.
Here’s why I stay bearish:
- Strong historical resistance rejected the price.
- No real bullish momentum above 1.34 zone.
- Consolidation after the drop looks more like a pause, not a reversal.
Trading Plan:
I will look to sell rallies, staying bearish as long as the 1.3400 area (recent high) is not broken.
Disclosure: I am part of Trade Nation's Influencer program and receive a monthly fee for using their TradingView charts in my analyses and educational articles.
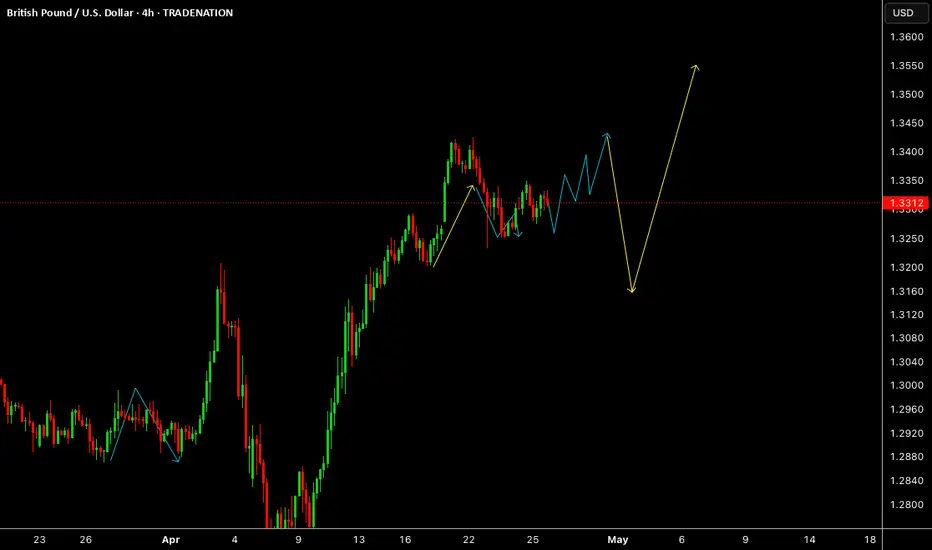
GBPUSDGBPUSD needs some more messy structure before going to 1.35 level.
Disclosure: We are part of Trade Nation's Influencer program and receive a monthly fee for using their TradingView charts in our analysis.
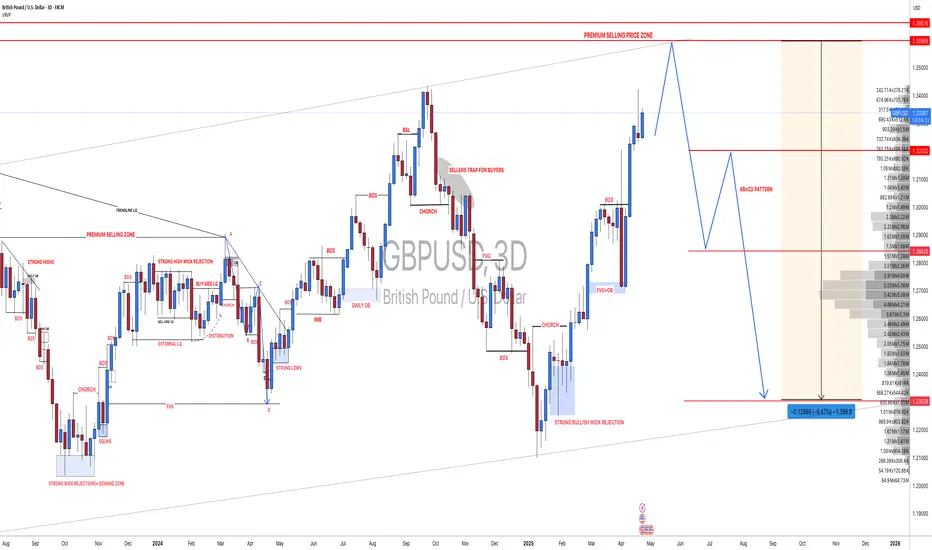
GBPUSD SHORT FORECAST Q2 W18 D28 Y25GBPUSD SHORT FORECAST Q2 W18 D28 Y25
Professional Risk Managers👋
Welcome back to another FRGNT chart update📈
Diving into some Forex setups using predominantly higher time frame order blocks alongside confirmation breaks of structure.
Let’s see what price action is telling us today!
💡Here are some trade confluences📝
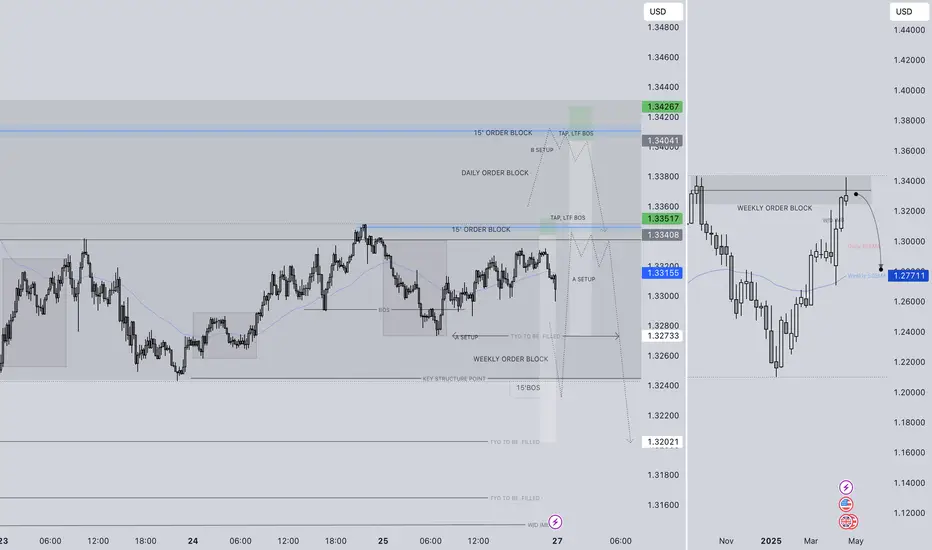
✅Weekly order block rejection
✅Daily order block rejection
✅Weekly imbalance to fill short
✅15’ order block
🔑 Remember, to participate in trading comes always with a degree of risk, therefore as professional risk managers it remains vital that we stick to our risk management plan as well as our trading strategies.
📈The rest, we leave to the balance of probabilities.
💡Fail to plan. Plan to fail.
🏆It has always been that simple.
❤️Good luck with your trading journey, I shall see you at the very top.
🎯Trade consistent, FRGNT X
GBPUSD SHORT FORECAST Q2 W17 D25 Y25GBPUSD SHORT FORECAST Q2 W17 D25 Y25
Professional Risk Managers👋
Welcome back to another FRGNT chart update📈
Diving into some Forex setups using predominantly higher time frame order blocks alongside confirmation breaks of structure.
Let’s see what price action is telling us today!
💡Here are some trade confluences📝
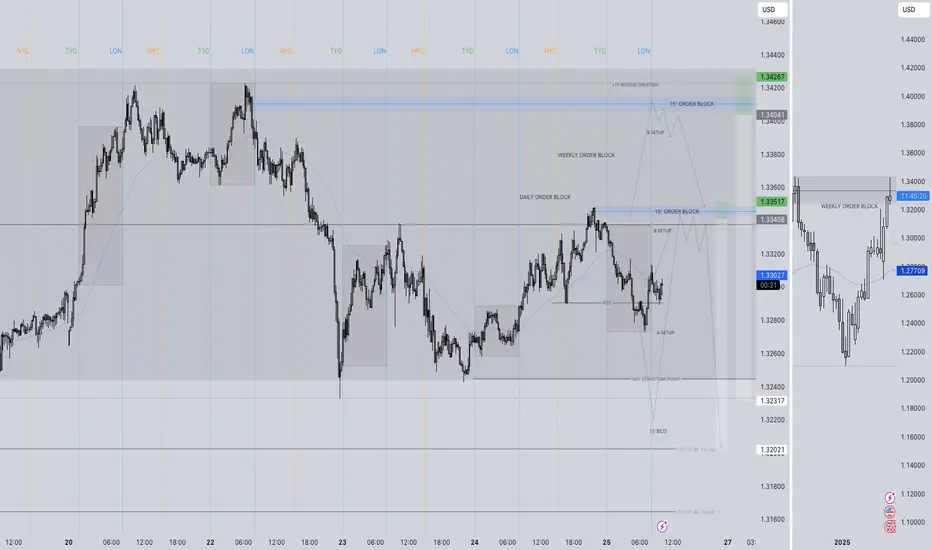
✅Weekly order block rejection
✅Daily order block rejection
✅15’ order block
✅Tokyo ranges to be filled
🔑 Remember, to participate in trading comes always with a degree of risk, therefore as professional risk managers it remains vital that we stick to our risk management plan as well as our trading strategies.
📈The rest, we leave to the balance of probabilities.
💡Fail to plan. Plan to fail.
🏆It has always been that simple.
❤️Good luck with your trading journey, I shall see you at the very top.
🎯Trade consistent, FRGNT X
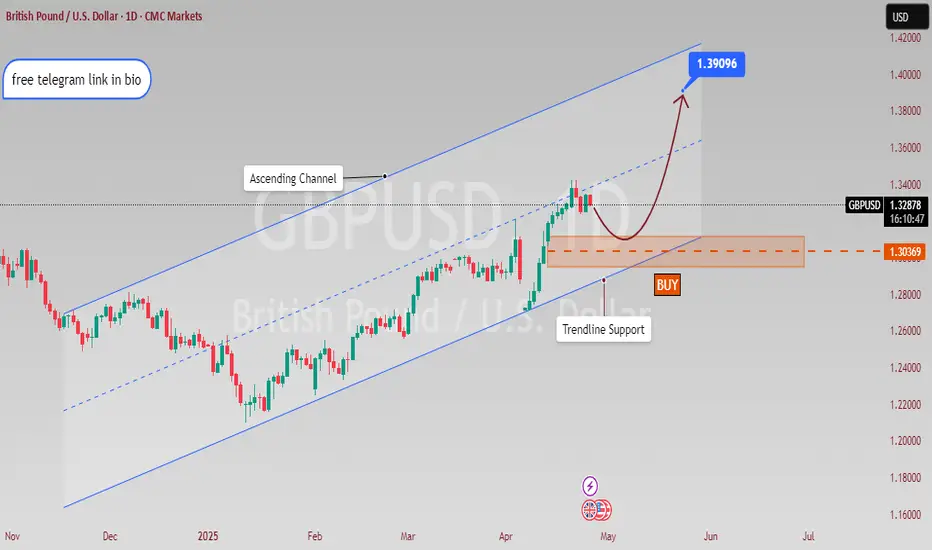
GBPUSD Trade SetupA buy position has been placed on the GBP/USD pair at 1.30369, targeting an ambitious level of 1.39096.
This setup reflects a bullish sentiment, anticipating a strong recovery in the British Pound against the US Dollar.
Recent macroeconomic indicators suggest improving conditions in the UK economy, which could support further upward movement.
Technical analysis shows that the pair is holding above key support levels, indicating sustained buying interest.
If momentum continues, the price may gradually ascend toward the 1.39096 target in the coming weeks.
A potential breakout above intermediate resistance zones could further confirm the bullish trend.
Market sentiment also favors the Pound, especially amid speculation about a more cautious approach by the Federal Reserve.
Volatility remains a factor, so proper risk management and stop-loss placement are essential.
Traders should closely monitor upcoming data releases, such as GDP figures and central bank announcements.
Overall, this trade setup offers a promising risk-to-reward ratio, backed by both technical strength and a supportive macroeconomic backdrop.
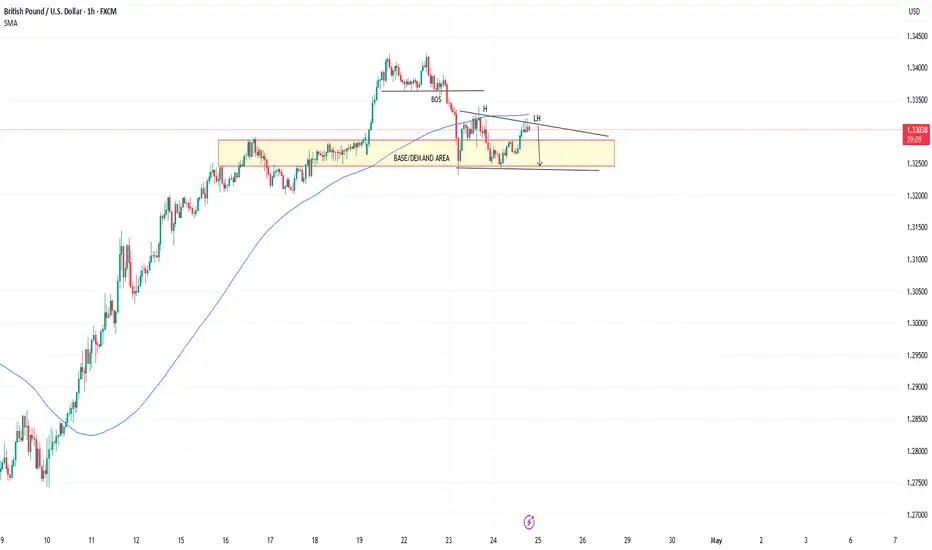
GBPUSD TRADE PLAN H1GBPUSD TF H1
SELL/SHORT PLAN
cancel if price break ma100(blue),or price break structure
take profit max 1.32000
GBPUSD SHORT FORECAST Q2 W17 D23 Y25 1' ENTRY MODEL EDUCATIONGBPUSD SHORT FORECAST Q2 W17 D23 Y25 1' ENTRY MODEL EDUCATION
Professional Risk Managers👋
Welcome back to another FRGNT chart update📈
Diving into some Forex setups using predominantly higher time frame order blocks alongside confirmation breaks of structure.
Let’s see what price action is telling us today!
💡Trade confluences📝
✅Weekly Order block rejection
✅15’ order block created
✅15’ wick rejections via order block
✅Intraday bearish breaks of structure
✅Tokyo ranges to be filled
✅1’ break of structure
✅1’ bearish engulfing candle fill
✅Sell limit order on the 1’ candle fill
✅Sell limit order via 1' order block created upon 1' break of structure
🔑 Remember, to participate in trading comes always with a degree of risk, therefore as professional risk managers it remains vital that we stick to our risk management plan as well as our trading strategies.
📈The rest, we leave to the balance of probabilities.
💡Fail to plan. Plan to fail.
🏆It has always been that simple.
❤️Good luck with your trading journey, shall see you at the very top.
🎯Trade consistent, FRGNT X

GBPUSD – Rejected at Multi-Month Resistance Amid Weak UK DataGBPUSD has clearly rejected the 1.3413–1.3443 resistance zone—a key area that previously acted as strong supply in September 2024. The pair has formed a bearish rejection candle and is now showing signs of downward momentum.
Key Levels:
Resistance: 1.3413 – 1.3443 (major rejection zone)
TP1: 1.3176 (minor structure)
TP2: 1.3014 (key demand zone)
TP3: 1.2890 (deeper support target)
Bearish Confluences:
Price rejected from major resistance
Bearish candle formation
Previous similar reaction from the same level
Momentum indicators favor downside
📰 Fundamental Analysis:
🔻 UK Data Weakens Further:
According to the latest S&P Global Flash UK PMI (Apr 23):
Composite Output Index: 48.2 (vs 51.5 in March) – 29-month low
Services PMI: 48.9 – 27-month low
Manufacturing PMI: 44.0 – 20-month low
This shows UK private sector activity contracting, led by a steep fall in new export orders, the worst since May 2020.
🔺 Inflation Still High:
Despite falling activity, input and output prices surged, driven by National Insurance hikes and wage growth. This makes it harder for the BoE to justify a cut, despite recession signs.
📌 Conclusion:
The bearish rejection at 1.3413 resistance, combined with deteriorating UK fundamentals, suggests a strong downside setup for GBPUSD. A break below 1.3176 would confirm the bearish move, targeting 1.3014 and potentially 1.2890.

GBPUSD - NEXT STOP @1.34343? [UPDATE]TRADE UPDATE
As planned for the week price traded to my POI just as i'd anticipated (without getting to my DOL first) so i took my Long Position and it got to my TP for a quick 1:3RR.
KEY TAKEAWAY
I followed my plan and waited for price to come to my level without chasing it(even after the quick spike up to begin the week).
Patience Pays!
Massive Rally, Massive Resistance – Time to Sell GBPUSD?The last two weeks felt like a rollercoaster for GBPUSD. It all started with a gap down on Monday, April 7, but that weakness didn’t last. The pair filled the gap and then rallied hard – over 700 pips!
🤔 Key Question – Is the move sustainable, or are we topping out?
Now the pair is approaching a massive resistance zone, one that dates back to 2019. While the bullish sentiment and USD weakness could push it toward 1.3500, this isn’t a breakout I’d blindly chase.
📉 Why I'm expecting a reversal:
Price is entering a long-term resistance area – a major barrier.
700 pips of upside happened fast – a pullback is likely.
USD weakness might fade, creating downward pressure.
1.3450–1.3500 is my key sell zone.
📊 My Trading Plan:
I’ll be watching for clear signs of weakness near 1.3450 – such as rejection candles or slowing momentum. If the market confirms, I’m looking for a 500 pip move down, with 1.3000 as the first major target.
Disclosure: I am part of Trade Nation's Influencer program and receive a monthly fee for using their TradingView charts in my analyses and educational articles.
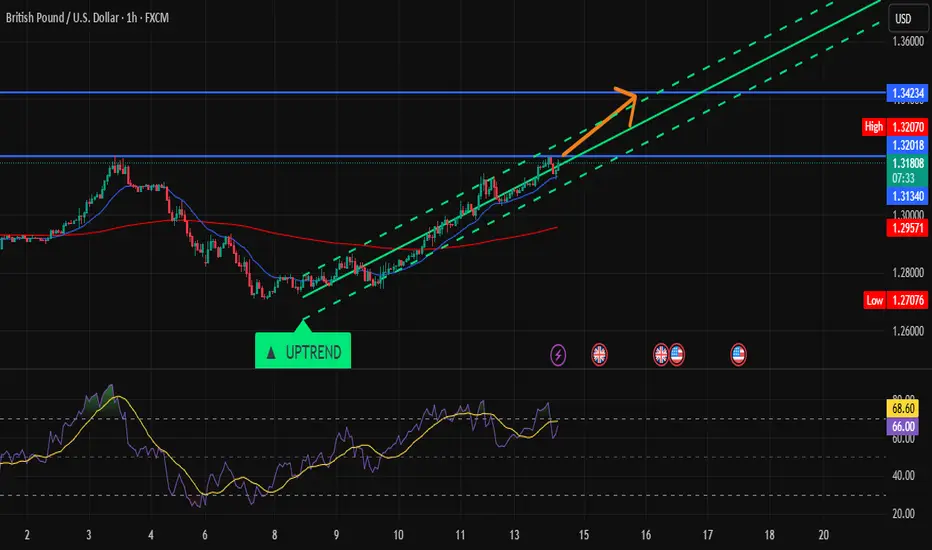
GBP/USD Ready for Takeoff!Hi Traders ! Price action remains strong within the uptrend channel, supported by the 20 EMA, while the 200 EMA stays well below—confirming bullish momentum.
Target zone: 1.34234
RSI shows strength with more room to rise.
Stay sharp, traders! If the price continues to respect the channel, we might see a strong bullish push soon.
📌 Disclaimer:
This content is for educational and informational purposes only and does not constitute financial advice. Always do your own analysis and consult with a professional before making trading decisions.
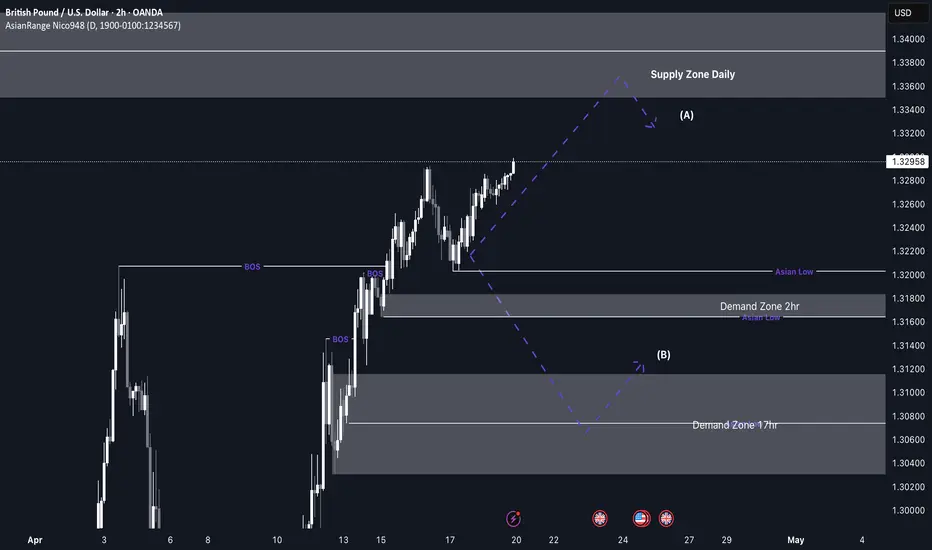
GBP/USD upcoming shorts from 1.33600 back down to demandMy focus this week for GU is around a key daily supply zone that price is currently approaching. As we near this level, I expect price to slow down and begin distributing, potentially leading to a deeper retracement. I anticipate the short setup to form around Tuesday, depending on how price reacts.
If price does retrace, I’ll be watching the 2-hour and 17-hour demand zones, where we could see a bullish reaction and a potential rally from those levels. Since GU has been overall bullish, this would be a counter-trend short, followed by a possible continuation to the upside.
Confluences for GBP/USD Shorts:
- Price is overbought, indicating a potential correction to clear liquidity and fill imbalances.
- Plenty of downside liquidity and imbalances that price could target.
- Approaching a strong daily supply zone, which could act as a key reversal point.
- Unmitigated demand zones below, which may need to be tapped before price continues higher.
P.S. If price doesn’t reach the daily supply zone, I’ll remain patient and look for a buy opportunity to ride price up toward that supply level.
Wishing everyone a great trading week ahead!
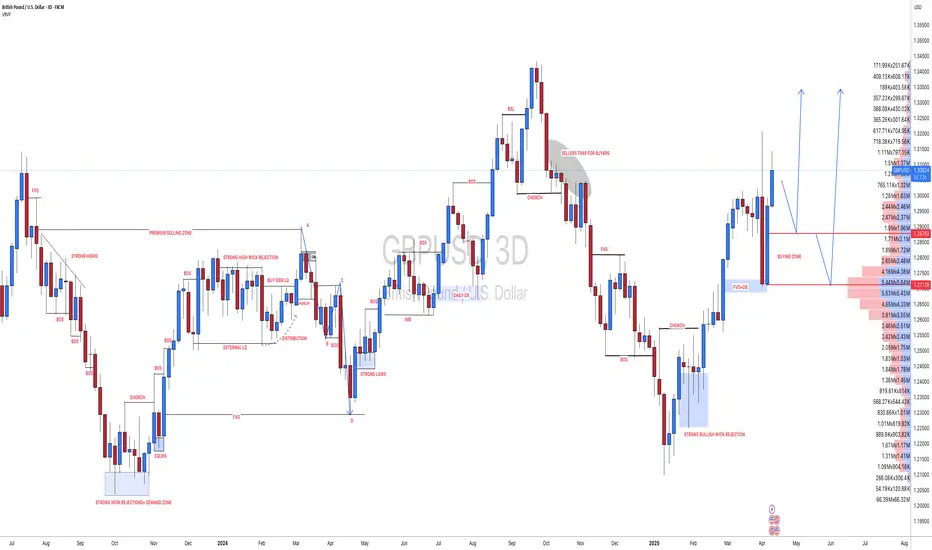
#GBPUSD: Two Prominent Buying Points! Will Dxy Bounce Back? Due to strong economic data supporting GBP, its price has been bullish throughout the week, especially since DXY plunged. Given ongoing trade tensions, we may see another higher high. This is risky, so please analyse it yourself.
Like and comment to support us in bringing more analysis.
Have a great weekend! ❤️
Team Setupsfx_
GBPUSD SHORT FORECAST Q2 W16 D18 Y25GBPUSD SHORT FORECAST Q2 W16 D18 Y25
Fun Coupon Friday!
Summary
- Weekly order block short set up
- Awaiting clear shift in price action to downside
- C setup - Short from 5' order block with confluence of daily high wick fill prior turn over in price.
- B Setup - 15' break of structure anticipating 15' creation order block creation. Solid point of interest to short from
A Setup - Multiple 15' break of structure plus all of the above
FRGNT X

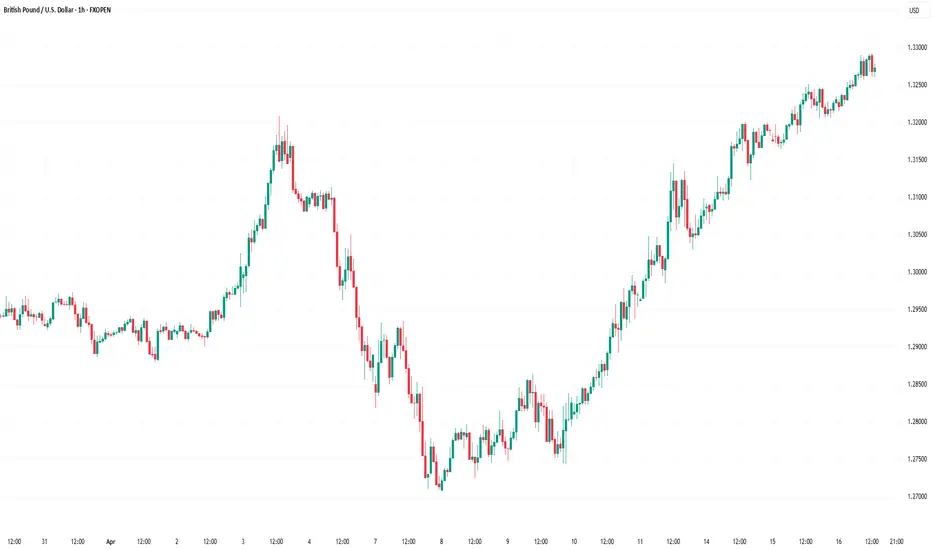
Market Analysis: GBP/USD Rockets HigherMarket Analysis: GBP/USD Rockets Higher
GBP/USD is gaining pace above the 1.3220 resistance.
Important Takeaways for GBP/USD Analysis Today
- The British Pound is attempting a fresh increase above 1.3220.
- There is a key bullish trend line forming with support near 1.3245 on the hourly chart of GBP/USD at FXOpen.
GBP/USD Technical Analysis
On the hourly chart of GBP/USD at FXOpen, the pair remained well-bid above the 1.2850 level. The British Pound started a decent increase above the 1.3000 zone against the US Dollar.
The bulls were able to push the pair above the 50-hour simple moving average and 1.3150. The pair even climbed above 1.3200 and traded as high as 1.3263. It is now consolidating gains and trading well above the 23.6% Fib retracement level of the upward move from the 1.3030 swing low to the 1.3263 high.
On the upside, the GBP/USD chart indicates that the pair is facing resistance near 1.3260. The next major resistance is near 1.3320. A close above the 1.3320 resistance zone could open the doors for a move toward 1.3450.
Any more gains might send GBP/USD toward 1.3500. On the downside, there is a key support forming near a bullish trend line at 1.3245.
If there is a downside break below 1.3245, the pair could accelerate lower. The next major support is at 1.3145. It is close to the 50% Fib retracement level of the upward move from the 1.3030 swing low to the 1.3263 high.
The next key support is seen near 1.3030, below which the pair could test 1.2860. Any more losses could lead the pair toward the 1.2745 support.
This article represents the opinion of the Companies operating under the FXOpen brand only. It is not to be construed as an offer, solicitation, or recommendation with respect to products and services provided by the Companies operating under the FXOpen brand, nor is it to be considered financial advice.
Inflation in the UK Has FallenInflation in the UK Has Fallen
According to Forex Factory, the Consumer Price Index (CPI) reading came in below expectations: while analysts had forecast a decline to 2.7% year-on-year from the previous 2.8%, the actual CPI figure was 2.6%.
Following the release of this news, the GBP/USD exchange rate rose to 1.3280 – the highest level in seven months.
On the one hand, falling inflation is a sign of a healthy economy and a relief for the Bank of England, especially considering that CPI stood in double digits just two years ago. As a result, analysts may now predict that interest rates could be cut at the meeting scheduled for 8 May.
On the other hand, demand for the dollar remains volatile due to Trump’s tariff policies, fears of a US recession, and a wave of bond sell-offs.
Technical Analysis of the GBP/USD Chart
In just one week, the pound-to-dollar rate has risen by approximately 4.2%, with the RSI indicator now hovering near extreme overbought levels. Furthermore, the price is approaching the upper boundary of the ascending channel, which has been in play since the beginning of 2025.
In such conditions, a correction (with a bearish breakout of the ascending trendline, shown in blue) appears a logical development. However, a key factor in sustaining the current trend of dollar weakness could be the speech by Federal Reserve Chair Jerome Powell, scheduled for today at 20:30 GMT+3.
This article represents the opinion of the Companies operating under the FXOpen brand only. It is not to be construed as an offer, solicitation, or recommendation with respect to products and services provided by the Companies operating under the FXOpen brand, nor is it to be considered financial advice.

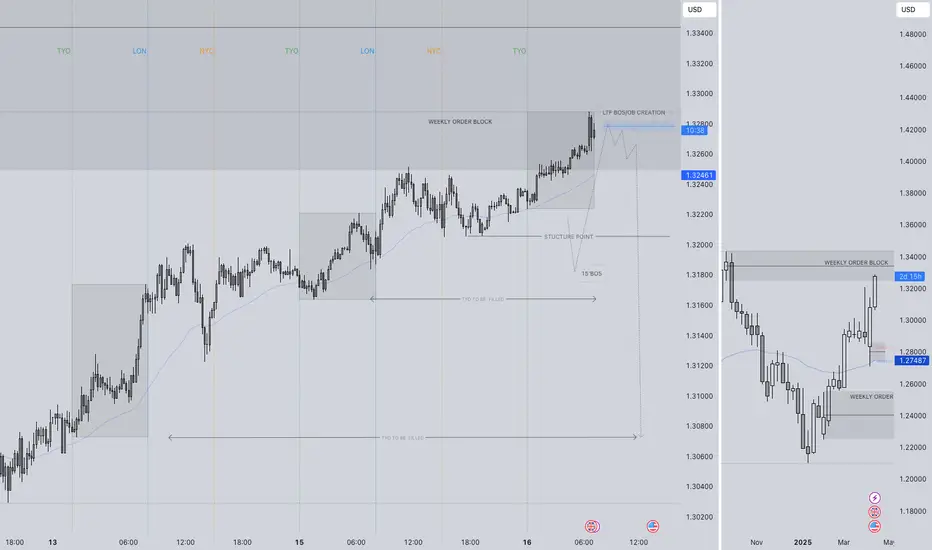
GBPUSD SHORT FORECAST Q2 W16 D16 Y25GBPUSD SHORT FORECAST Q2 W16 D16 Y25
Thoughts- It's not if, it's WHEN !
All longs are null until the weekly order block has been breached or price drops considerably. In the here and now the short seems to be closing in.
It is as always important to stack confluences in favour of the short prior risking capital.
15' break of structure is an absolute requirement as this point of price action.
Within the higher time frame order block- looking for a lower time frame order block is not enough to short from therefore scrolling back months to find is pointless in our opinion.
We will let price show us, we will reaction with price.
What are your thoughts...
Are we dropping today?
FRGNT X
GBPUSD SHORT FORECAST Q2 W16 D15 Y25GBPUSD SHORT FORECAST Q2 W16 D15 Y25
Morning Traders!
Let's await price action to tap into the weekly order block!
From then on, eyes open for 15' breaks of structure. Ensure that key higher low areas and double doubles for potential longs are broken before looking to short a fairly strong looking pound!
We simply await the pull back into s 15' order block that should be created post bearish move we have spoken of above. Upon the turn around in price action, we can be satisfied the bullish trend has exhaust somewhat.
Let's await the setup. No positions on GBPUSD until the above.
FRGNT X

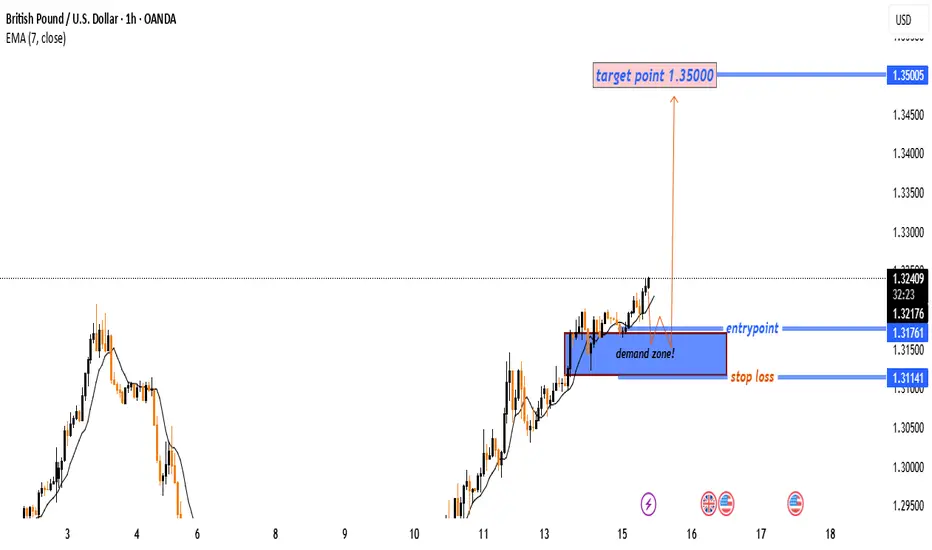
“GBP/USD Long Setup: Demand Zone Bounce Toward 1.35000 Target ”🔍 Trade Setup
🟦 Entry Point: 1.32171
➤ Price is near the 7 EMA – good for a possible bounce.
🟩 Demand Zone: 1.31761 - 1.31500
➤ This is where buyers previously stepped in.
➤ Strong support area – watch for bullish reversal candles here.
🔻 Stop Loss: 1.31141
➤ Below the demand zone to protect against a fakeout.
🎯 Target Point: 1.35000
➤ Big upside target – aiming for a strong rally.
⚖️ Risk to Reward
❌ Risk: 1.32171 → 1.31141 = ~103 pips
✅ Reward: 1.32171 → 1.35000 = ~283 pips
⚖️ R:R Ratio: ≈ 1:2.75 – very favorable!
✅ Summary
🔸 Trend is bullish with strong momentum
🔸 EMA is acting as dynamic support
🔸 Demand zone is clearly respected
🔸 Great R:R setup for a long trade
GBPUSD: Continue to riseFor GBP/USD, we still mainly choose to go long during the pullback and go short as a supplement.
GBPUSD trading strategy
buy @:1.31900-1.32100
sl 1.31000
tp 1.32750-1.32850
Today, the trend of GBPUSD basically coincides with what I predicted yesterday. You can click on my personal profile to view the previously published content.