GOLD decreased slightly after the session set a new recordWorld gold price decreased by 3.7 USD to 2,247.8 USD/ounce. After rising sharply to a new record high in the first trading session of April, thanks to expectations of US interest rate cuts and the appeal of gold as a safe-haven asset, metal prices This quarter has slightly adjusted this morning.
Market watchers are currently expecting the FED to cut interest rates in May or June. However, many investors are still cautious about the pace of interest rate cuts by the US Federal Reserve (FED) in the coming months. this year and how long it will take for the FED to bring inflation to its target level of 2%. On March 29, Fed Chairman Jerome Powell said that economic growth is still strong and inflation is still higher than the target level.
By June, the gold market will see gold prices increase due to expectations of interest rate cuts by the FED. Experts believe that, no matter how quickly or slowly the US Central Bank cuts interest rates, the agency will still reduce interest rates this year.
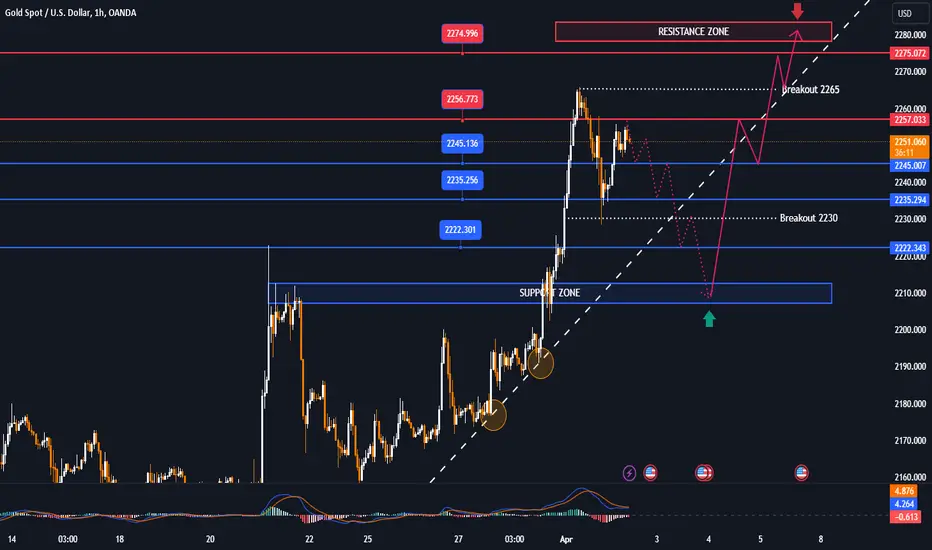
Breakout: 2265 - 2230
Resistance: 2257 - 2175 - 2280
Support: 2245 - 2235 - 2222 - 2212
Gc1!!
GOLD continuously set new recordsWorld gold price stood at 2,282 USD/ounce, a sharp increase of 33 USD/ounce compared to the same hour yesterday morning. This continues to be the highest price in world gold trading history.
Gold prices continue to increase sharply due to the need for a safe haven amid increasing tensions in the Middle East. The increase in strength of the USD and expectations of US interest rate cuts have almost no impact on the rise in gold prices.
Gold has increased steeply, reaching a new record, although at the same time some overbought conditions appeared, leading to a slight correction. However, gold's recent declines have been insignificant in nature, as potential investors are willing to wait for better entry points.
In addition, strong demand from retail investors and central banks around the world is also a factor that helps prolong the rise of this precious metal. The combination of factors has helped gold bullion prices increase nearly 10% from the beginning of the year until now.
🖥 GOLD MARKET ANALYSIS AND COMMENTARY - [April 01 - April 05]This week, international gold prices rose sharply from 2,163 USD/oz to 2,236 USD/oz, closing at 2,233 USD/oz. The increase is attributed to positive US economic growth in Q4 2023, although it slowed compared to previous quarters. Inflation is also decreasing, leading investors to anticipate interest rate cuts by the FED from June onwards.
The forecast for March 2024 non-agricultural employment (NFP) is 198,000 jobs, down from the previous period's 275,000. If this forecast is accurate, it will support the expectation of an interest rate cut by the FED, causing gold prices to rise. However, if NFP exceeds expectations, it could negatively impact gold prices. Additionally, the tone of the Fed Chairman's speech next week is uncertain.
Gold prices are expected to rise in the long term due to the slowdown of the US economy and the potential recession risks. The inverted bond yield curve indicates that the FED will likely implement three interest rate cuts this year. Central banks buying gold will also support its long-term prices. However, there is a short-term risk of profit-taking by investors, particularly ETFs.
📌According to technical analysis, gold prices are still in an uptrend and may reach $2,300/oz. If economic data is negative, prices may face profit-taking pressure with support levels at $2,150-2,100-2,080/oz. Trading plan: sell at $2,300 and buy at $2,150.
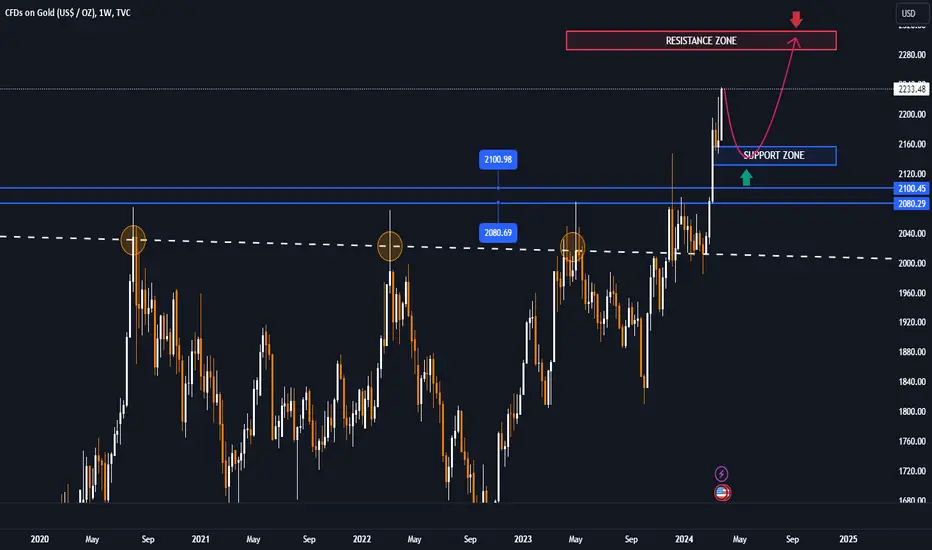
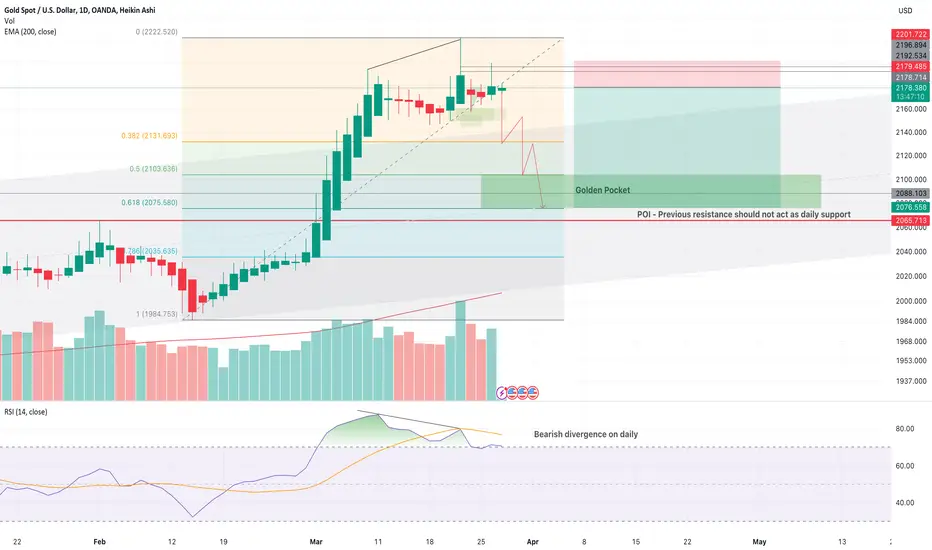
Chart Idea on Gold XAUUSD - 3/27/2024 - Short SetupOn Daily TF - XAUUSD looks bearish
Confirmations:
- Low Volume
- Bearish Divergence
- MACD crossing downwards
Swing short setup:
Entry - 2178.50
SL - 2202
TP - 2088
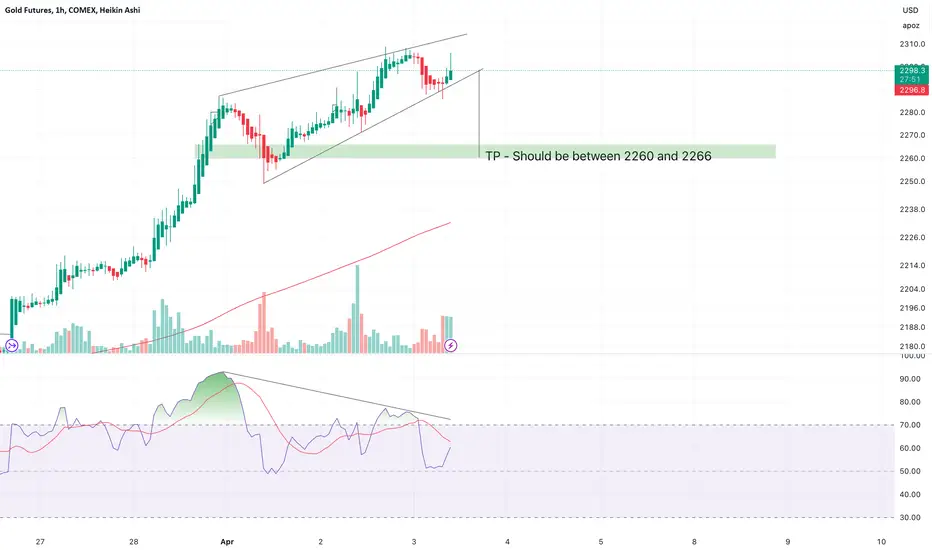
GC1! ! Chart Idea - Short SetupSwing short setup on GC1!
Confirmations:
- Bearish Divergence
- Rising Wedge
If rising wedge breaks to the downside, TP should be around 2266 - 2260
GOLD → Could NFP cause a counter-trend correction?FX:XAUUSD within a strong rally stops and forms a flat before the publication of NFP. Relative to 2288 a false breakout is formed, bringing sellers into the market.
The dollar is in a correction phase, as is gold. The price is testing the local low of 2267.67 but still does not reach the strong liquidity zones of 2265, 2228, 2222. There is still a strong buyer in the market, but after the correction and the false breakdown of 2288 a seller appears. NFP is ahead, a rather important news, which can both turn the market and strengthen the current movement. It is worth paying attention to the resistance at 2288 and 2305. There is a chance to see the continuation of counter-trend correction, but before that there is a chance that a big player will drive the price to ATH before further decline to the specified liquidity areas: 2265, 2228 or to the support of the formal channel.
Resistance levels: 2288, 2305
Support levels: 2265, 2228, 2222
Technical factors are not enough now to specify the key areas for opening sales or purchases, so it is worth to base on the fundamental reasons and strong resistance and support areas.
TVC:DXY COMEX:GC1! COMEX_MINI:MGC1!
Regards R. Linda!

GOLD → Reached 2300. What's next, going higher or correction?FX:XAUUSD breaks records and updates the high to 2305, but technically, the implied target is still not reached. Today Initial Jobless Claims before NFP is published and the market may go into a consolidation phase.
On D1 we see the dollar declining after a false break of the resistance at 104.94 as well as the downside resistance. Ahead of Initial Jobless Claims, in general, traders are waiting for neutral-negative data, the situation is still complicated, but Powell is trying to keep the market from Panic with his statements.
Obviously, after the release of PMI and JOLTS data the Fed will not change the policy based on Q1 data. What is happening in the market now is emotion, but many people take it seriously. Still, we should wait for more important and factual data than just words in the air.
The inflation rate in January-February was higher than in 2023, which was the reason for the panic "inflation will be even higher and rates will be held for longer". But, the latest data doesn't change the situation significantly.
2300 may become a key psychological level for gold and cool down the market a bit, which may form a correction. There are still some areas of imbalance that the market maker may test before resuming the rise to the resistance level formed on the monthly timeframe.
Support levels: 2288, 2265, 2253
Resistance levels: 2300, 2325, 2337
Technically, a small correction to liquidity zones may start before further rsoot towards psychological levels
COMEX:GC1! COMEX_MINI:MGC1! TVC:DXY
Regards R. linda!

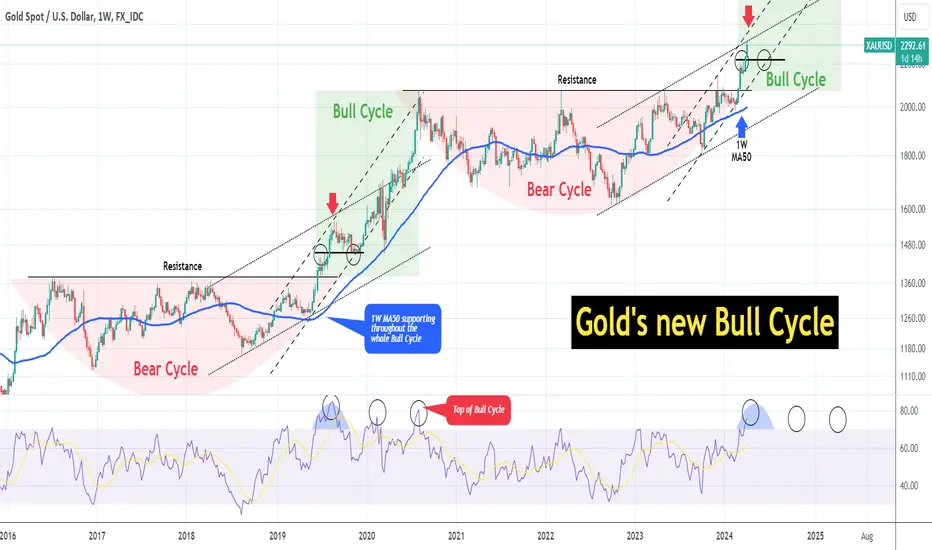
XAUUSD New Bull Cycle mapped! Approaching first Resistance Zone?Gold (XAUUSD) has technically started its new Bull Cycle after breaking above the Resistance and previous All Time High (ATH) into green overbought territory. Being overbought in such instances isn't necessarily bearish but suggests that even though the long-term trend is now heavily bullish (and should be for the next year or so), we should look for key Resistances to offer relief pull-backs.
As you can see on this 1W chart, there are strong similarities of the current Cycle (both Bear and Bull) with the previous one (June 2016 - August 2020). The Bear Cycle's come in the form of Cup patterns, while the Bull Cycles start on Channel Up patterns at the bottom of the Bear ones. During the previous Bull Cycle, the 1W MA50 (blue trend-line) has supported all the way from its bullish break-out (December 24 2018) until deep into the next Bear (February 01 2021).
Right now the 1W MA50 has been supporting since October 09 2023, which is shortly after the dashed Channel Up started. That is an important pattern as it currently has a maximum upside to 2350 for a Higher High. The dotted Channel Up on the contrary, which was initiated at the bottom of the Bear Cycle has already touched its Higher High.
This means that Gold's new Bull Cycle is facing its first significant Resistance Zone of the current run: 2300 - 2350. Relative to the previous Bull Cycle, Gold had it's first Resistance rejection on August 26 2019, making a Higher High and started to pull-back for almost 100 days (3 months). As the current bullish trend is significantly stronger than the 2019 one, the dashed Channel Up being narrower, I doubt that Gold will correct for that long, but on the next red 1W candle, we have to consider the possibility for a short-term correction.
The August 2019 one pulled as low as the previous High before the rejection (bold black line). This suggests that 2220 - 2200 is Gold's floor at the moment and shouldn't be broken. Back to its overbought status, the 1W RSI gives a clear indication of that. Once it starts reversing inside an Arc pattern, we will confirm the correction we're discussing now. And after it forms systematically Lower Highs on quarterly intervals, we can expect by the 3rd Lower High to be close to the Top of the Bull Cycle.
-------------------------------------------------------------------------------
** Please LIKE 👍, FOLLOW ✅, SHARE 🙌 and COMMENT ✍ if you enjoy this idea! Also share your ideas and charts in the comments section below! This is best way to keep it relevant, support us, keep the content here free and allow the idea to reach as many people as possible. **
-------------------------------------------------------------------------------
💸💸💸💸💸💸
👇 👇 👇 👇 👇 👇
GOLD → A correction before further growth?FX:XAUUSD has been forming a small correction towards liquidity zones since the opening of the session. On the background of strong bullish trend it is quite logical scenario before the news publication.
The dollar index is testing a strong resistance before the news and a correction is possible, which will only strengthen the growth of gold. But, it is impossible to determine in advance what kind of news it will be (bullish or bearish for the dollar). Traders expect bullish: ADP NonFarm, ISM PMI, and bearish: SP PMI. Also, the big question is what Powell will say tonight....
Technically, gold is still in a bullish trend. And it may continue after a correction.
Resistance levels: 2288, 2300
Support levels: 2265, 2253, 2228
Technically, the market is bullish. A retest and false breakout of one of the above areas could strengthen the price again. But, the structure may break when the channel resistance (as support) or 2228 is broken, in which case the correction will be prolonged to lower zones.
Regards R. Linda!

GOLD solid gains, extending positive momentumOANDA:XAUUSD Q2 TECHNICAL OUTLOOK
Gold kicked off the first quarter of 2024 with solid gains, extending the positive momentum established in the latter part of 2023. During this upturn, XAU/USD soared to new all-time highs, decisively breaking past the $2,150 mark, and eventually reaching a peak of $2,235.
While bullion’s technical profile continues to be bullish, with a clear pattern of higher highs and higher lows, caution is advised, with the 10-week RSI indicator signaling possible overbought conditions. When markets become overextended in a short period of time, corrective pullbacks often follow, even if they turn out to be temporary or relatively minor.
In the event of a bearish shift, support can be identified at $2,145, followed by $2,070, as displayed in the weekly chart attached. Bulls will need to vigorously defend this technical floor; failure to do so may result in a retracement towards the 200-day simple moving average near $1,985. Further down, attention will turn to channel support at $1,920, then to $1,810.
On the other hand, if the bulls maintain control of the steering wheel and look to push prices higher in the coming days and weeks, a successful breakout could add further bullish pressure, paving the way for a move towards resistance. channel at $2,255.
Gold approaches all-time highsIn the previous post on gold, we expressed our fears about the shiny metal amid a sudden spike in volatility and a slight drop in the U.S. market indices (accompanying the spike in VIX). Nevertheless, it did not take long for the volatility to falter and the fear to disappear among market participants. Quickly, the market leaped higher, and gold followed in tandem, breaking above $2,100. The overall picture improved at a fast pace, and now, gold trades merely $20 away from its all-time highs. However, as stocks and cryptocurrencies are reaching the euphoria phase, the case for a significant pullback in the two markets is growing, which could (temporarily) negatively affect gold’s performance; in our opinion, the stock market weakness is one of the biggest potential foes to gold going forward. Yet, this does not change our view of the big picture. We remain highly bullish on gold in the long term and maintain the price target of $2,300.
Illustration 1.01
Volume increases alongside the price, which is normally a positive development.
Technical analysis
Daily timeframe = Bullish
Weekly timeframe = Bullish
Please feel free to express your ideas and thoughts in the comment section.
DISCLAIMER: This analysis is not intended to encourage any buying or selling of any particular securities. Furthermore, it should not serve as a basis for taking any trade action by an individual investor or any other entity. Your own due diligence is highly advised before entering a trade.

XAUUSD: Can it really target 2,850 by the end of the year??Gold is vastly overbought on its 1D technical outlook (RSI = 80.447, MACD = 42.840, ADX = 50.847) and the reason is that since last month's (March) breakout and monthly closing above the 2020 Resistance, it started a new bullish hyper Cycle. It is overbought on the 1W RSI also (74.802) while the monthly (1M) is only a fraction away too (RSI = 69.871). This is a heavily aggressive long term trend that until its peak won't offer many pullbacks and those will be limited.
This 1M chart shows that according to the 1M RSI we're where Gold was on the August 2019 breakout on the previous Cycle. Before that both patterns pulled back and held the 1M MA50 and 0.5 Fibonacci level. The rally that followed the breakout, peaked at +98.09% from the bottom (Fib extension 3.0). The current pattern is at +25% since the 1M MA50 and 0.5 Fib rebound and another +25% until the end of the year would also complete +98.09% from the bottom. Our end of year Target is exactly on that level (TP = 2,850).
See how our prior idea has worked out:
## If you like our free content follow our profile to get more daily ideas. ##
## Comments and likes are greatly appreciated. ##

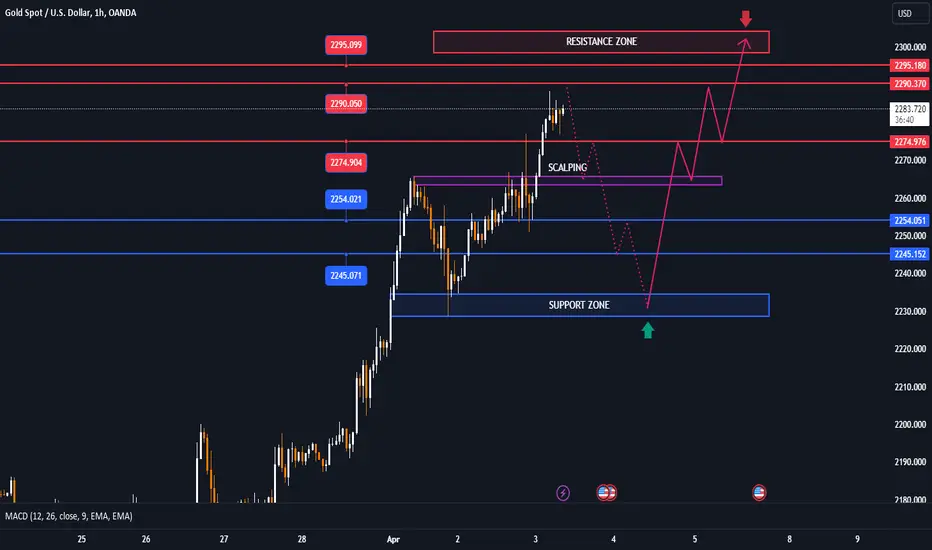
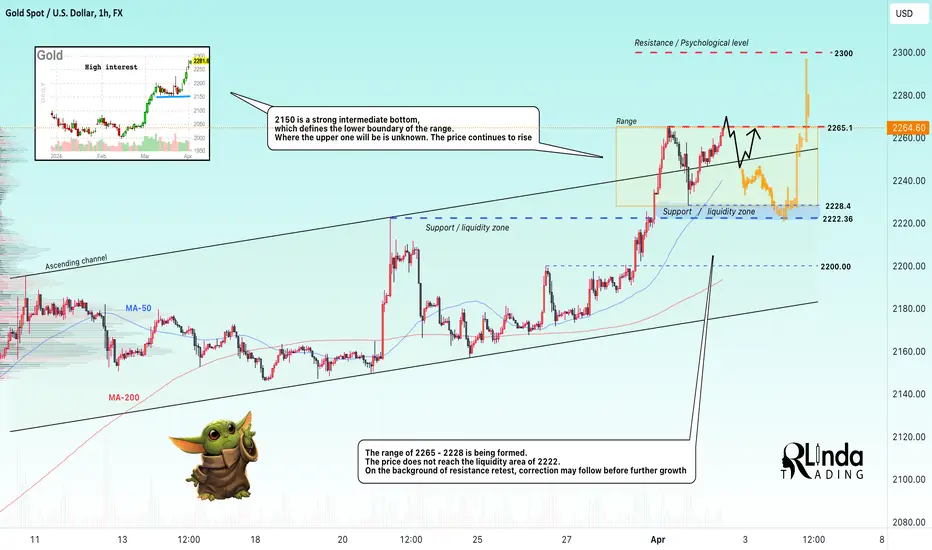
GOLD → The market's buying back the fall. Next up, 2300?FX:XAUUSD is still very strong. The price does not react to the news properly, only as a short-term reaction. The market is quickly buying back the decline and testing resistance.
Buying potential is quite strong, the probable area of the first stop could be the zone 2300-2325. On H1, an intermediate sideways range is formed after a false breakdown of channel resistance. The price defines the lower boundary as 2228 without reaching the strong support at 2222, which indicates that the bulls are very much keeping the price away from risk zones. A retest of the resistance is formed and there is a high chance to see a false breakout or a bounce followed by a correction, which may become a consolidation phase before further growth.
Resistance levels: 2265
Support levels: 2228
High interest to the metal from investors, central banks favorably affect the strengthening of the metal, besides the role of hedge asset is now more than ever manifested in the market. Gold will try to break the resistance for further growth, as there is no hint of a change in the global trend
COMEX:GC1! COMEX_MINI:MGC1! TVC:DXY
Regards R. Linda!
GOLD skyrocketed, the world reached a new peakThe world gold spot price is around 2,233 USD/ounce, a spike of 42 USD/ounce compared to the transaction at the same time yesterday morning. Closing last night's session, the world gold spot price in the US market stood at 2,233 USD/ounce, a sharp increase of more than 38 USD/ounce, equivalent to an increase of 1.74% compared to the previous session's close.
Yesterday, the global financial market received more positive economic information in the US, the USD increased well but the price of gold - a capital security asset still increased too strongly to an unprecedented high.
Specifically, the US announced that its gross domestic product (GDP) in the fourth quarter of 2023 increased by 3.4% over the same period, higher than the previous forecast of 3.2%. First-time applications for unemployment benefits in the US last week were at 210,000 applications, lower than the 212,000 applications forecast previously and last week.
PCE price is an index measuring the price change of consumer goods and services exchanged in the US economy in the fourth quarter of 2023, increasing by 1.8% over the same period, much lower than the level achieved in the previous quarter. 2.6%.
Thus, closing data on US gross domestic product increased compared to the same period last year, initial applications for unemployment benefits decreased, showing that the US economy is recovering positively. The decrease in PCE prices shows that the price of personal consumption goods has decreased, which will contribute to reducing inflation in the US.
According to market rules, the USD enjoyed a very good increase in the session last night - early this morning. Specifically, the Dollar-Index - measuring the strength of the greenback compared to 6 major currencies, increased quite well by 0.28% to 104,217 points.
Normally, positive economic information and the USD will cause gold prices to drop sharply. However, investors believe that when factors related to inflation decline deeply, such as PCE, it will promote the process of reducing interest rates by the US Federal Reserve (Fed) soon.
Tonight, the US will announce the PCE price index for February. Current forecasts are that all indicators of PCE in February are higher than last month. In particular, Fed Chairman Jerome Powell will give a speech. Investors will look for more clues about when to cut interest rates, as well as the health of the US economy from Mr. Jerome Powell.
Currently, 71% of market forecasts are that the Fed will cut interest rates for the first time in a series of high interest rate days in June this year. Experts say that if the PCE price index falls, it could be gold. prices will increase sharply. Because it is predicted that the Fed will cut interest rates soon to support the economy. If PCE increases, the Fed may delay cutting interest rates after June as forecast.

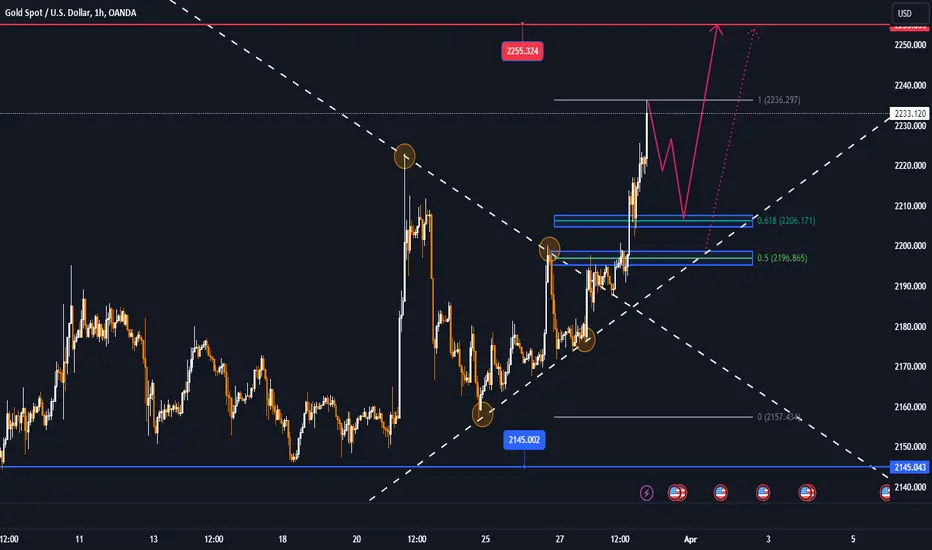
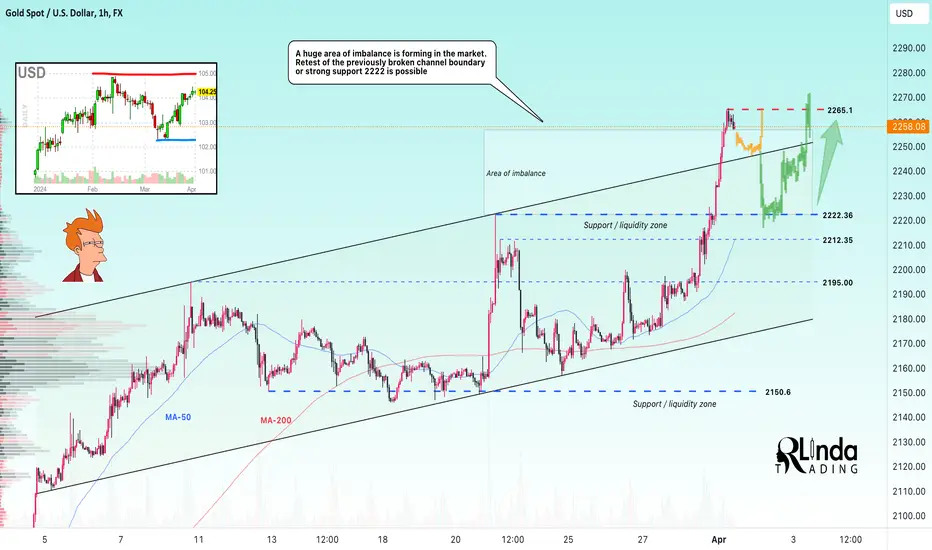
GOLD → A false break of $2265 will lead to a retest of support FX:XAUUSD has been reaching 2265 since the open. The price is moving out of the ascending price channel, which indicates a strong bull market. But, there is a huge imbalance area forming below, which can be liquidated before further growth.
The dollar is also strengthening and the market is waiting for bullish news on the index today. In this case it may give a small correction wave for the gold market. Moreover, there is a huge area of imbalance at 2265-2222, in which case it would be logical to expect a retest of the previously broken channel resistance or even key support before a further rise.
Resistance levels: 2265
Support levels: channel resistance 2245, 2222
Technically, we can expect a correction after the rally. The trend may continue from these support zones.
Regards R. Linda!
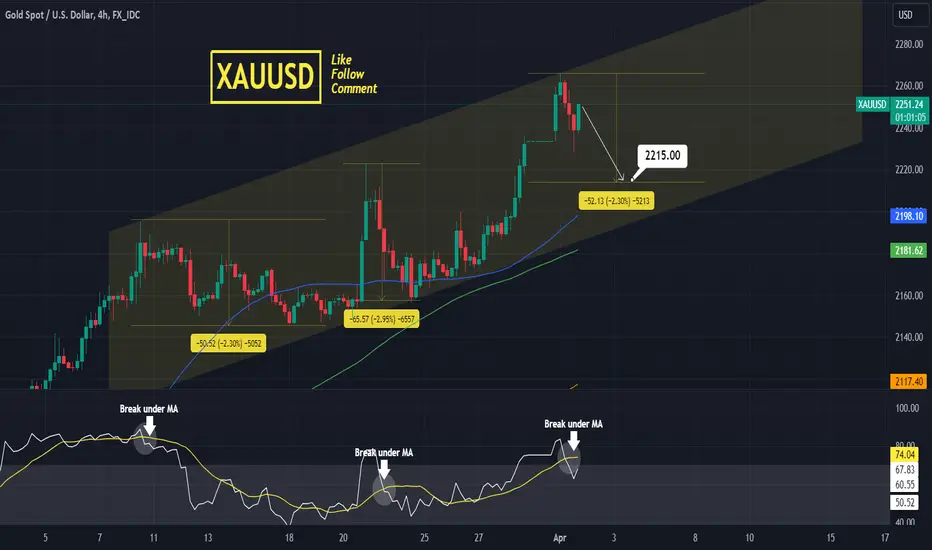
XAUUSD Short term sell signal.Gold is trading inside a Channel Up, making today a new Higher High.
This is a sell signal, as long as the price doesn't break higher.
The minimum decline/ Bearish Leg inside this pattern has been -2.30%.
Trading Plan:
1. Sell on the current market price.
Targets:
1. 2215 (-2.30% from the top).
Tips:
1. The RSI (4h) crossed under the MA trendline. This has been the strongest sell signal on the previous two Higher Highs.
Please like, follow and comment!!