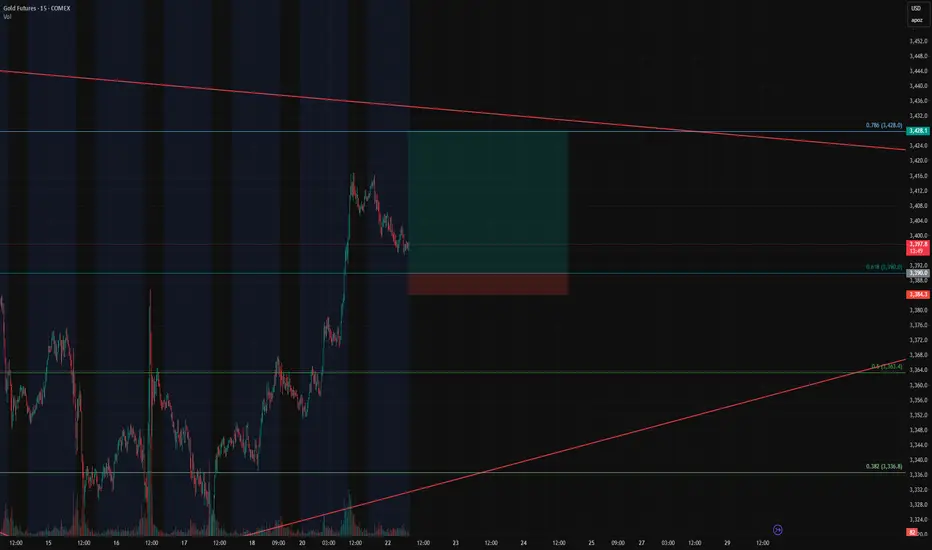
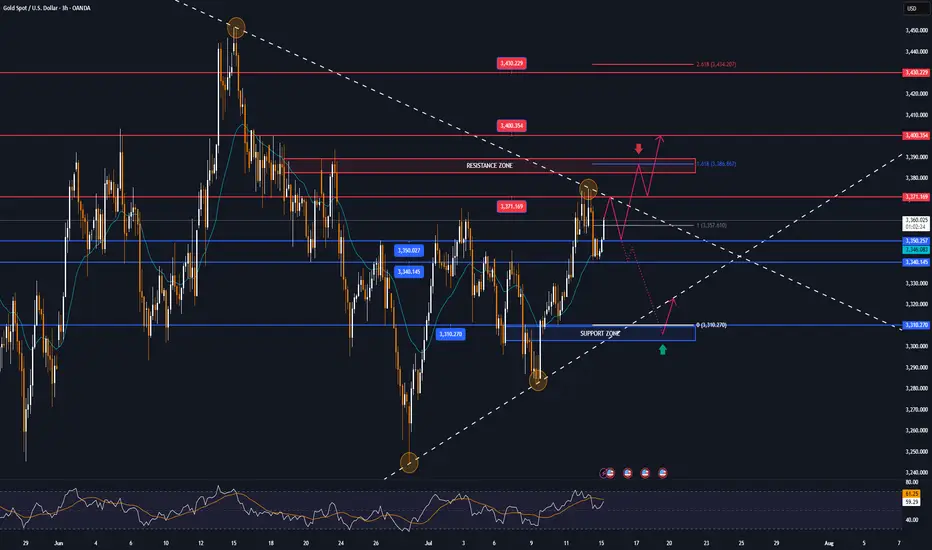
Gold Futures Long Setup – Breakout Continuation off the 0.618 FiGold Futures Long Setup – Breakout Continuation off the 0.618 Fib
Instrument: Gold Futures – COMEX ( COMEX:GC1! )
Timeframe: 15-Minute
Trade Type: Long – Breakout Continuation
Entry Zone: 3390 (0.618 Fibonacci retracement)
Take Profit: 3428 (0.786 Fib)
Stop Loss: 3384
Risk/Reward Ratio: 6.68
Setup: Bullish Flag on Retest
🔍 Trade Thesis
This trade is part of an ongoing breakout continuation strategy we've been trading, and now we're eyeing a pullback entry as price returns to a key retracement level.
Price nearly exploded through the 0.618 Fibonacci level (3390) during the prior breakout.
Now it's pulling back in a textbook bullish flag formation, suggesting healthy consolidation before the next leg.
The 0.618 retracement is aligning with previous intraday structure and trendline support — making this an ideal level to scale in.
This is a high R:R continuation play, with targets set at the 0.786 Fib level (3428) — right before macro resistance kicks in.
🎯 Entry & Exit Strategy
Entry: As price touches 3390 or forms bullish confirmation at the level.
Stop Loss: 3384 – tight and below key fib/flag structure.
Target: 3428 – based on 0.786 Fib extension and breakout continuation projection.
📊 Why This Works
Breakout behavior: Price respected the breakout impulse and retraced cleanly into a bull flag.
Fib confluence: 0.618 pullbacks are a classic entry in trending markets.
R/R of 6.68: Excellent reward profile vs. limited risk.
Gc1
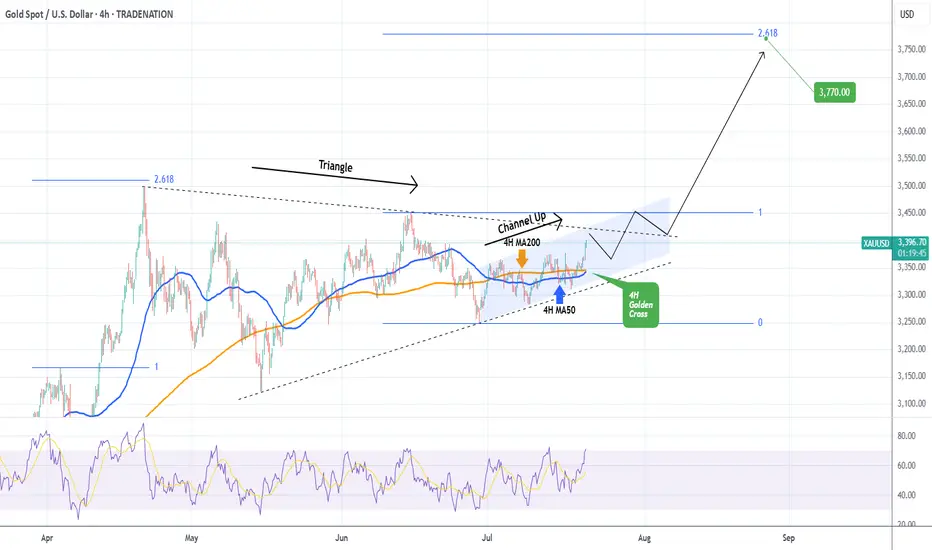
XAUUSD 4H Golden Cross preparing a massive break-out.Gold (XAUUSD) has been trading on a 3-week Channel Up, which is approaching its top but at the same time, it's been trading within a 3-month Triangle, which is also approaching its top.
The key here is the formation today of a Golden Cross on the 4H time-frame, the first since May 28. Being at the end of the long-term Triangle pattern is technically translated to the structure's tendency to look for a decisive break-out above its top that attracts volume (buyers).
It is possible to see an initial rejection followed by a break-out that will re-test the top of the Triangle as Support and then follow the long-term trend dynamics. Those are technically bullish and previous break-out in April targeted the 2.618 Fibonacci extension. Our Target remains a little below it at $3770.
-------------------------------------------------------------------------------
** Please LIKE 👍, FOLLOW ✅, SHARE 🙌 and COMMENT ✍ if you enjoy this idea! Also share your ideas and charts in the comments section below! This is best way to keep it relevant, support us, keep the content here free and allow the idea to reach as many people as possible. **
-------------------------------------------------------------------------------
Disclosure: I am part of Trade Nation's Influencer program and receive a monthly fee for using their TradingView charts in my analysis.
💸💸💸💸💸💸
👇 👇 👇 👇 👇 👇
Time to invest in JPY and TN/bond? Hello FX/futures traders!
Market is at a pivotal point. Not in a bad way, but in a good way!
Chart 2: TVC:DXY
Let's start with the US Dollar . A declining USD was just well defended the last few days. If this is true, then the stock up, dollar down scenario is likely to continue. This is good for equities.
Chart 4: COMEX:GC1!
Gold defends its trendline as well. It seems like gold wants to go up more. A raising gold in the current scenario suggests declining USD TVC:DXY . This isn't always true, but we have to look at the current correlation and makes the best educated guess on this.
Logical Deduction 1:
Chart 1: CBOT:TN1!
A consolidation phase has been going on for almost 2 years now. This is definitely
a good sign to long bond, as at least we know the likely bottom for stoploss. With dollar leaning down and gold up, I think TN will defend its current level around 110-113.
Logical Deduction 2:
Chart 3: CME:6J1!
JPY is defending its first key level since May 2025. A wedge is forming, and the breakout is about to take place later this year. Likely the consolidation phase will take more time (with likelihood to breakout to either side). But with a declining USD side by side, I consider now a good entry point to long JPY with controllable risk.
Let me know what you think!

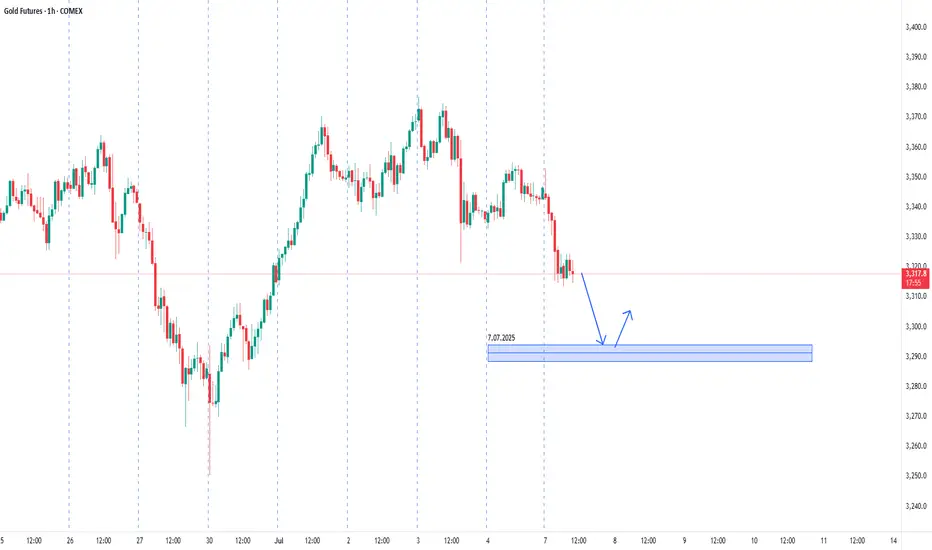
GOLD (GC) Weekly Recap & Game Plan 20/07/2025🪙 GOLD (GC) Weekly Recap & Game Plan
📊 Market Context:
Price is currently forming an accumulation pattern.
The purple zone marks a key weekly demand zone, and I expect a potential bounce from that level.
I'm closely watching for trendline deviations to determine the directional bias.
🎯 Game Plan:
If price drops below the trendline and bounces from the weekly demand, I’ll look for longs targeting the bearish trendline.
If price taps the bearish trendline and shows clear rejection, I’ll look for shorts targeting the bullish trendline.
I'll wait for LTF confirmations before entering any position.
✅ Follow for weekly recaps & actionable game plans.
GOLD ( XAUUSD ): Watching For A Short Term Buy ConfirmationIn this Weekly Market Forecast, we will analyze the Gold (XAUUSD) for the week of July 21-25th
Gold has been in consolidation for a couple of weeks now. The price action hasn't allowed for very many FVGs... until last week. There is a +FVG I am keeping an eye on, as it will be very telling how price reacts to it upon contacting this POI.
If it holds, higher prices will ensue.
If it fails, to the lows of the consolidation we go.
We'll soon see how it plays out.
Enjoy!
May profits be upon you.
Leave any questions or comments in the comment section.
I appreciate any feedback from my viewers!
Like and/or subscribe if you want more accurate analysis.
Thank you so much!
Disclaimer:
I do not provide personal investment advice and I am not a qualified licensed investment advisor.
All information found here, including any ideas, opinions, views, predictions, forecasts, commentaries, suggestions, expressed or implied herein, are for informational, entertainment or educational purposes only and should not be construed as personal investment advice. While the information provided is believed to be accurate, it may include errors or inaccuracies.
I will not and cannot be held liable for any actions you take as a result of anything you read here.
Conduct your own due diligence, or consult a licensed financial advisor or broker before making any and all investment decisions. Any investments, trades, speculations, or decisions made on the basis of any information found on this channel, expressed or implied herein, are committed at your own risk, financial or otherwise.

Trapped orderflow. Gold Weekly Outlook. 19.07.2025,SaturdayExpecting a range bound market condition until any one of the VI on the weekly inverse. Trapped Orderflow

GOLD! Pre-Market Analysis For Friday July 18th!In this video, we'll present pre-market analysis and best setups for Friday July 18th.
Enjoy!
May profits be upon you.
Leave any questions or comments in the comment section.
I appreciate any feedback from my viewers!
Like and/or subscribe if you want more accurate analysis.
Thank you so much!
Disclaimer:
I do not provide personal investment advice and I am not a qualified licensed investment advisor.
All information found here, including any ideas, opinions, views, predictions, forecasts, commentaries, suggestions, expressed or implied herein, are for informational, entertainment or educational purposes only and should not be construed as personal investment advice. While the information provided is believed to be accurate, it may include errors or inaccuracies.
I will not and cannot be held liable for any actions you take as a result of anything you read here.
Conduct your own due diligence, or consult a licensed financial advisor or broker before making any and all investment decisions. Any investments, trades, speculations, or decisions made on the basis of any information found on this channel, expressed or implied herein, are committed at your own risk, financial or otherwise.

GOLD tests $3,310 then recovers, continues sidewaysInternational OANDA:XAUUSD fell to the support level of 3,310 USD, then recovered and continued to stabilize sideways due to the stronger US Dollar and market tensions eased after US President Trump said it was "extremely unlikely" to fire Federal Reserve Chairman Powell.
As of the time of writing, spot OANDA:XAUUSD was trading at 3,339 USD/oz.
Reuters reported on Wednesday that Trump is still open to the possibility of firing Powell. However, Trump said on Wednesday that he has no intention of firing Powell at this time, but did not completely rule out the possibility and reiterated his criticism of the Fed chairman for not lowering interest rates.
Data showed US producer prices unexpectedly held steady in June, as the impact of higher import tariffs on goods was offset by weakness in the services sector.
The unchanged US PPI in June showed wholesale prices were stabilising, suggesting the economic impact of tariffs may be smaller than initially feared.
The lower-than-expected core CPI and core PPI data did not provide the boost that was expected, which could mean that the market is focusing on other aspects. More broadly, as the Fed gradually eases policy, real yields could continue to fall, and gold will maintain its upward trend. However, if the market continues to reprice expectations for a hawkish rate cut, this could trigger a short-term correction.
SPDR Gold Trust, the world's largest gold-backed exchange-traded fund (ETF), said its holdings rose 0.33% to 950.79 tonnes on Wednesday from 947.64 tonnes in the previous session.
Technical Outlook Analysis OANDA:XAUUSD
On the daily chart, gold rebounded after falling and tested the support level noted by readers in yesterday's edition at 3,310 USD. The recovery brought gold prices back to work around the EMA21, continuing the sideways accumulation trend.
Structurally there is no change, as for gold to qualify for an upside move it needs to break resistance at the 0.236% Fibonacci retracement level then the short term target is the raw price point of $3,400. Meanwhile for gold to complete its bearish cycle it needs to sell below the 0.382% Fibonacci retracement level then the short term target would be around $3,246, more than the 0.50% Fibonacci retracement level.
The relative strength index (RSI) is also unchanged with the RSI activity around 50, indicating a hesitant market sentiment without leaning towards any particular trend.
Intraday, the technical outlook for gold prices continues to be a sideways accumulation trend, and the notable positions will be listed as follows.
Support: 3,310 – 3,300 – 3,292 USD
Resistance: 3,350 – 3,371 USD
SELL XAUUSD PRICE 3386 - 3384⚡️
↠↠ Stop Loss 3390
→Take Profit 1 3378
↨
→Take Profit 2 3372
BUY XAUUSD PRICE 3276 - 3278⚡️
↠↠ Stop Loss 3272
→Take Profit 1 3284
↨
→Take Profit 2 3290

GOLD's narrowing range, tariffs, Trump's political dramaOANDA:XAUUSD is still trading in a narrowing range, affected by the tariff game and the political drama that Trump is building. Currently, the price of gold is trading around 3,339 USD/oz, equivalent to a small decrease of about 7 dollars on the day.
Tariff Game
On July 16, US President Donald Trump announced that he would send letters to more than 150 countries, with tariffs expected to be 10% or 15%, to promote trade. He said these countries are not major US partners and will be treated equally, but left open the possibility of negotiating exemptions. The tariffs are similar to those proposed in April but were postponed due to concerns about market volatility. The resumption of the tariffs continues to destabilize financial markets and surprised partners such as the European Union, as they hoped to reach an early agreement with the US.
Political Play
Also on July 16, global financial markets were shaken by rumors that President Trump intended to fire Federal Reserve Chairman Jerome Powell. Many major news agencies such as the New York Times, Bloomberg and Reuters reported that Trump had prepared a letter of dismissal and consulted with Republican lawmakers, receiving positive feedback. Removing Powell before his term was believed to undermine confidence in the US financial system and the safe haven status of the USD. Trump later denied the plan, saying it was unlikely to happen unless there was serious wrongdoing. Markets reacted strongly: the USD fell and then recovered after Trump's statement, while gold lost most of its previous gains by the end of the session.
The gold market in particular, and the financial economy in general, are being affected by the activities of Trump, the creator of the global trade war, and the plays of Trump and the FED leading the market. Therefore, the basic formula in the current market context is best to follow Trump, and make sure not to miss any of Trump's status lines.
Technical outlook analysis of OANDA:XAUUSD
On the daily chart, the technical structure has not changed with the trend not yet clear and the price action clinging to the EMA21.
The technical conditions do not favor an uptrend or a downtrend, typically the RSI moves around the 50 level, indicating a hesitant market sentiment.
On the upside, gold needs to achieve the condition of breaking above the 0.236% Fibonacci retracement level of the price point of 3,371 USD then the target level will be around 3,400 USD in the short term, more than 3,430 USD.
Meanwhile, on the downside, gold needs to break below the 0.382% Fibonacci retracement, which would confirm a loss of the $3,300 level, then target around $3,246 in the short term, more than the 0.50% Fibonacci retracement.
Intraday, the sideways trend of gold price accumulation will be noticed by the following technical positions.
Support: $3,310 – $3,300 – $3,292
Resistance: $3,350 – $3,371 – $3,400
SELL XAUUSD PRICE 3381 - 3379⚡️
↠↠ Stop Loss 3385
→Take Profit 1 3373
↨
→Take Profit 2 3387
BUY XAUUSD PRICE 3309 - 3311⚡️
↠↠ Stop Loss 3305
→Take Profit 1 3317
↨
→Take Profit 2 3323
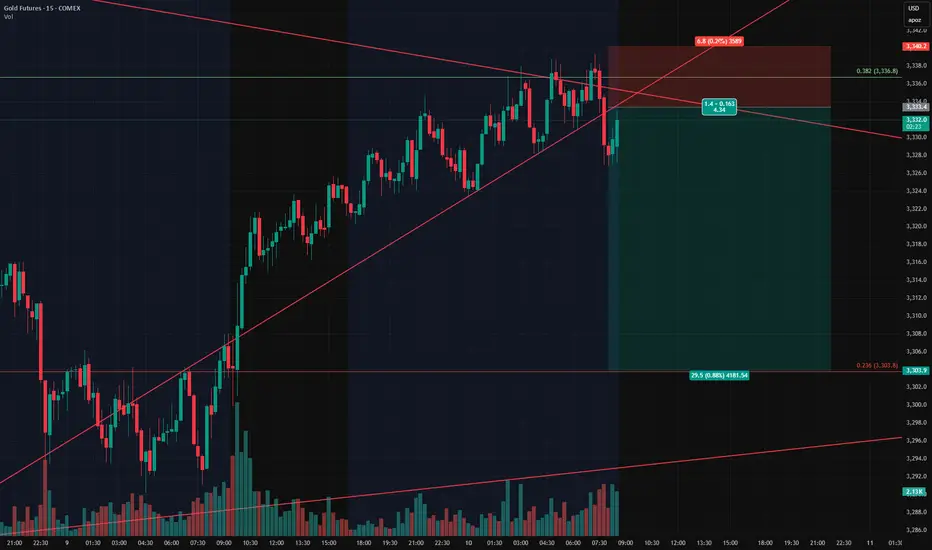
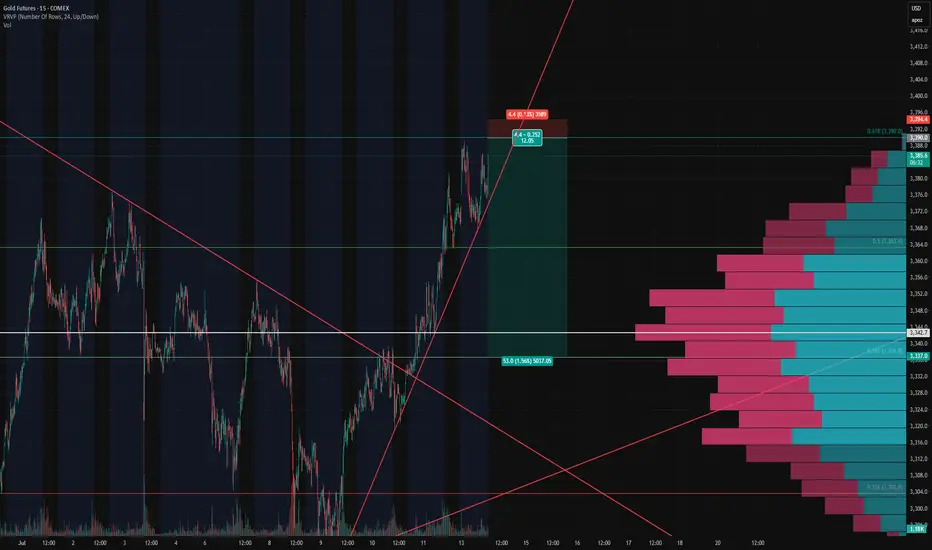
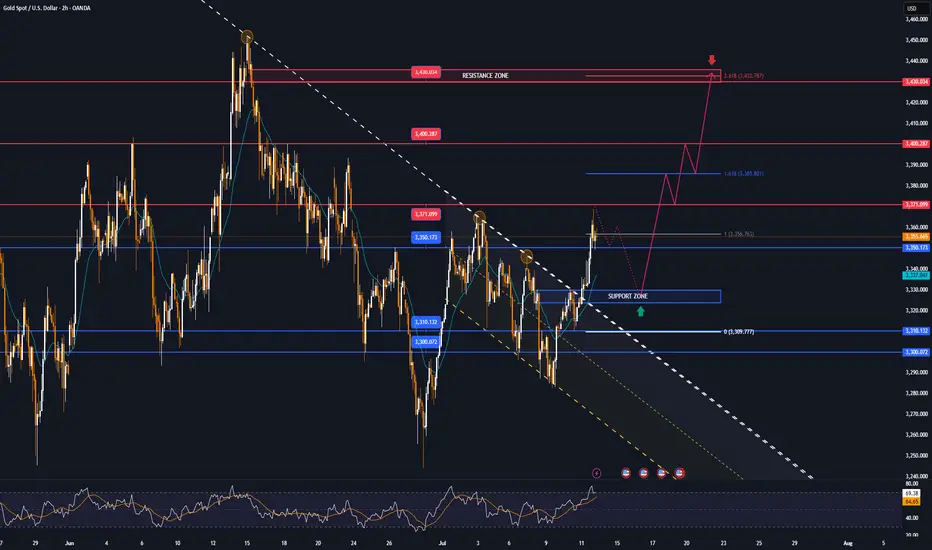
Gold Futures ($GC1!) — US Session Setup: Bearish Retest from 618🟡 Gold Futures ( COMEX:GC1! ) — US Session Setup: Bearish Retest from 0.618 Fib in Bullish Breakout Context
⏳ Pre-US Session Playbook
We're currently watching Gold Futures ( COMEX:GC1! ) for a potential short opportunity into the US session open. While the broader structure has broken bullish, we're anticipating a bearish retest scenario from a key Fibonacci level — aligning cleanly with last week’s breakout structure.
No positions have been taken yet — we are setting up for the US session — and are closely monitoring price action near the 0.618 retracement zone before committing.
📍 Setup Breakdown
• 0.618 Fib Retracement from the last bearish impulse aligns with:
○ Recent volume shelf resistance
○ Retest zone from prior breakout
○ An overextended local push into thin volume above 3380
• Bullish Context:
○ HTF breakout from descending wedge structure remains valid
○ Macro buyers still in control
○ Upside continuation risk is high if sellers don’t show up
• Short Bias Conditions:
○ Rejection or absorption in the 3385–3390 zone
○ Weak follow-through above 0.618 (failed breakout scenario)
○ Breakdown of LTF higher low structure post-test
🧠 Strategy Commentary
Although we’re in bullish breakout mode, this is a tactical short setup — a fade into prior structure with clear invalidation. We're not fighting trend, but looking to short into exhaustion at a defined level, with tight risk parameters.
Confluence Factors:
• 0.618 fib alignment
• VRVP volume shelf
• Prior breakout structure retest
• LTF divergence or absorption confirming the fade
🎯 Trade Parameters (Planned)
• Entry Zone: ~3385–3390
• Stop Loss: Tight, 3395–3400
• Target Zone: 3342–3337 (full structure retest)
📌 Patience is key — this remains a setup until confirmed. We'll post live if and when conditions are met.
Let the market come to you.
GOLD in narrow range, after sharp drop on US CPI dataOANDA:XAUUSD fell sharply on Tuesday (July 15) as the US Dollar TVC:DXY gained significantly after the US CPI report was released. As of now (July 16), gold is trading at 3,326 USD/oz, equivalent to an increase of only 2 USD in the day.
The US Consumer Price Index (CPI) in June was in line with expectations but higher than the previous value. The surge in the Dollar after the US released the June CPI is the main reason for the pressure on gold prices so far.
• Data released by the US on Tuesday showed that the US CPI increased by 2.7% compared to the same period last year in June, in line with expectations, but higher than the 2.4% in May.
• The US CPI rose 0.3% month-on-month in June, in line with market expectations but up from a 0.1% increase, the largest increase since January this year.
• In addition, the US core CPI rose 2.9% year-on-year in June, up from 2.8% in May, while the core CPI in June rose 0.2% month-on-month.
The market generally believes that US President Trump's tariff policies have increased price pressures, prompting the Federal Reserve to wait and see what further action to take. Federal Reserve Chairman Powell previously said he expected prices to rise in the summer.
The market is still expecting the first rate cut in September. Investors are looking ahead to Wednesday's U.S. producer price index data for more information on the Federal Reserve's move.
Since gold does not yield interest, it typically performs well in low-interest-rate environments, whereas high-interest-rate environments or expectations of future rate hikes put pressure on gold prices.
Technical Outlook Analysis OANDA:XAUUSD
On the daily chart, gold is trading in a fairly narrow range after 2 sessions of downward adjustment, but the specific trend is still unclear, as sent to readers throughout last week, the technical conditions mainly show a sideways accumulation movement. After testing the 0.236% Fibonacci retracement level, gold was unable to overcome this resistance, and the decline from this position brought the gold price close to the support of 3,310 USD and then the area of the original price point of 3,300 USD with the 0.382% Fibonacci retracement.
With the technical conditions not giving a specific trend as they are now, for gold to be able to have a new bullish cycle it needs to move the price action above the 0.236% Fibonacci retracement level, then the target would be around $3,400 in the short term, more than $3,430. On the other hand, if gold falls below the 0.382% Fibonacci retracement level again, it could be a good signal for an expectation of a bullish cycle, then the target would be around $3,246 in the short term, more than the 0.50% Fibonacci retracement level.
The relative strength index is hovering around 50, indicating that the market is hesitant in terms of momentum and is not leaning towards a specific trend.
During the day, with the current sideways accumulation, gold will be noticed by the following technical levels.
Support: 3,310 – 3,300 – 3,292 USD
Resistance: 3,240 – 3,250 – 3,371 USD
SELL XAUUSD PRICE 3383 - 3381⚡️
↠↠ Stop Loss 3387
→Take Profit 1 3375
↨
→Take Profit 2 3369
BUY XAUUSD PRICE 3304 - 3306⚡️
↠↠ Stop Loss 3300
→Take Profit 1 3312
↨
→Take Profit 2 3318
Daily Market Outlook. 16.07.2025, CPI dayGold Short and NQ order flow explained. Along with the Dollar Index

GOLD again targets $3,371, new bullish cycle conditionToday (Tuesday, July 15), in the Asian market, the spot OANDA:XAUUSD maintained a slight recovery trend, currently at around 3,360 USD/ounce.
The spot OANDA:XAUUSD rose to a 3-week high on Monday, but quickly fell back and finally closed lower. Trump's open attitude towards trade negotiations has improved the market's risk-on sentiment and negatively impacted gold, a safe-haven asset. But gold still has a lot of potential risks for price increases, and personally, the fundamental trend for gold has not changed.
The US Bureau of Labor Statistics will release its June Consumer Price Index (CPI) report today (Tuesday).
According to a Reuters survey, economists expect the US CPI to increase year-on-year in June to 2.7% from 2.4% the previous month, while the core CPI is expected to increase year-on-year to 3% from 2.8%.
The survey also showed that the US CPI is expected to increase 0.3% month-on-month in June, and the core CPI is also expected to increase 0.3% month-on-month.
According to the Chicago Mercantile Exchange's "FedWatch Tool", the market believes that the Fed is unlikely to cut interest rates in July and the probability of keeping interest rates unchanged in September is about 30%.
If the US core CPI rises by 0.4% or more in June, this could prompt market participants to reassess the possibility of a rate cut in September. In this case, the US Dollar could hold steady and push gold prices lower. On the other hand, if the data is lower than expected, gold will become more attractive while a weaker Dollar will be positive for gold prices.
Technical Outlook Analysis OANDA:XAUUSD
After gold reached the resistance target of attention to readers in the weekly publication at 3,371 USD, which is the location of the 0.236% Fibonacci retracement, it fell slightly but is now recovering positively.
Currently, gold is trading in the range of 3,360 USD, the price action above the lower edge of the long-term rising price channel with support from the EMA21, gold is now likely to continue to retest the 0.236% Fibonacci retracement level.
If gold breaks above $3,371 it will be eligible for a new bullish cycle, with the target then being around $3,400 in the short term, more so than $3,430.
On the other hand, the RSI is pointing up, maintaining activity above 50, and this should be considered a positive signal in terms of momentum. It shows that there is still a lot of room for growth ahead.
However, as of now, gold is still neutral in terms of trend, with conditions gradually tilting towards the possibility of price increase.
Along with that, the notable positions will be listed as follows.
Support: $3,350 – $3,340 – $3,310
Resistance: $3,371 – $3,400 – $3,430
SELL XAUUSD PRICE 3390 - 3388⚡️
↠↠ Stop Loss 3394
→Take Profit 1 3382
↨
→Take Profit 2 3376
BUY XAUUSD PRICE 3304 - 3306⚡️
↠↠ Stop Loss 3300
→Take Profit 1 3312
↨
→Take Profit 2 3318
Back above $3,300, GOLD may remain neutral, tax focusOANDA:XAUUSD reclaimed the psychologically important level of $3,300/ounce last week, but while gold is still receiving some support as a safe haven amid economic and geopolitical risks, its upside momentum may be limited as the market shifts its attention to other commodities.
Gold prices ended last week on a generally bullish note, rising back above $3,300 an ounce after US President Trump unexpectedly announced a series of new trade policies. Spot gold prices rose about 0.5% last week on Friday.
Although the market initially doubted Trump’s self-imposed July 9 deadline, the overall market reaction remained steady and the renewed risk appetite helped the S&P 500 hit a new record high, somewhat undermining gold’s safe-haven appeal. The July deadline has been pushed back to August 1, but the global trade conflict is far from over. Gold has regained support after initial pressure after Trump announced a new trade policy on copper imports, along with a series of news stories about the relationship between Trump and the FED sent to readers throughout the past week.
A sharp rise in copper prices will also add to inflationary pressures, exacerbate economic uncertainty and raise concerns about recession and stagflation. In this context, gold is expected to continue to receive support from potential risks.
In addition to fierce competition in the commodity market, gold may remain fundamentally neutral in the short term, as economic data will support the Fed's neutral monetary policy. The key market focus next week will be the June Consumer Price Index (CPI). The Fed has made it clear that it is in no rush to raise interest rates while inflation risks remain high.
However, traders still need to be cautious and closely monitor the situation surrounding the tariff war initiated by Trump, which will directly affect the price of gold. In case of negative news, the gold price will receive support and vice versa if positive news appears in the market.
Over the weekend, US President Trump once again used the tariff tactic, announcing that he would impose a 30% tax on imports from the EU and Mexico, causing a strong reaction from the international community. This move not only casts a shadow over the relationship between Europe and the United States, as well as between the United States and Mexico, but also adds further uncertainty to the global trade model. EU politicians, businesses and academics were quick to respond, calling for unity to protect their interests, while Mexico stressed the need to maintain national sovereignty and pledged to respond calmly.
Technical Outlook Analysis OANDA:XAUUSD
On the daily chart, gold has a 3-day rally, and the upside momentum has reached the important target resistance at the 0.236% Fibonacci retracement level. Gold's upside momentum is also limited by this Fibonacci retracement level, specifically it has slightly dropped to $3,355/oz.
But overall, gold is still not in a position to form a specific trend, and the indicators and positions are mainly showing the possibility of continuing to accumulate sideways.
For gold to have the conditions for a new bullish cycle, it needs to bring price activity above the 0.236% Fibonacci retracement level, then the target will be around $3,400 in the short term, more than $3,430.
Meanwhile, a pullback, which sees gold sell below the 0.382% Fibonacci retracement, would open the door to a bearish cycle, with a target of around $3,246 in the short term, rather than the 0.50% Fibonacci retracement.
RSI hovering around 50 also suggests a hesitant market sentiment, so the short-term bias for gold is neutral.
Along with that, notable positions will also be listed as follows.
Support: $3,350 – $3,310 – $3,300
Resistance: $3,371 – $3,400 – $3,430
SELL XAUUSD PRICE 3406 - 3404⚡️
↠↠ Stop Loss 3410
→Take Profit 1 3398
↨
→Take Profit 2 3392
BUY XAUUSD PRICE 3340 - 3342⚡️
↠↠ Stop Loss 3336
→Take Profit 1 3348
↨
→Take Profit 2 3354
Market Watch UPDATES! Stock Indices, Gold, Silver, US OILWelcome to the Market Watch Updates for Monday, July 14th.
In this video, we will give the forecast updates for the following markets:
S&P500, NASDAQ, DOW JONES, GOLD, SILVER and US OIL.
Enjoy!
May profits be upon you.
Leave any questions or comments in the comment section.
I appreciate any feedback from my viewers!
Like and/or subscribe if you want more accurate analysis.
Thank you so much!
Disclaimer:
I do not provide personal investment advice and I am not a qualified licensed investment advisor.
All information found here, including any ideas, opinions, views, predictions, forecasts, commentaries, suggestions, expressed or implied herein, are for informational, entertainment or educational purposes only and should not be construed as personal investment advice. While the information provided is believed to be accurate, it may include errors or inaccuracies.
I will not and cannot be held liable for any actions you take as a result of anything you read here.
Conduct your own due diligence, or consult a licensed financial advisor or broker before making any and all investment decisions. Any investments, trades, speculations, or decisions made on the basis of any information found on this channel, expressed or implied herein, are committed at your own risk, financial or otherwise.

Gold and DXY. Day before CPI 14.07.2025, MondayExplaining about the thoughts on CPI. Expect major movements on GOLD

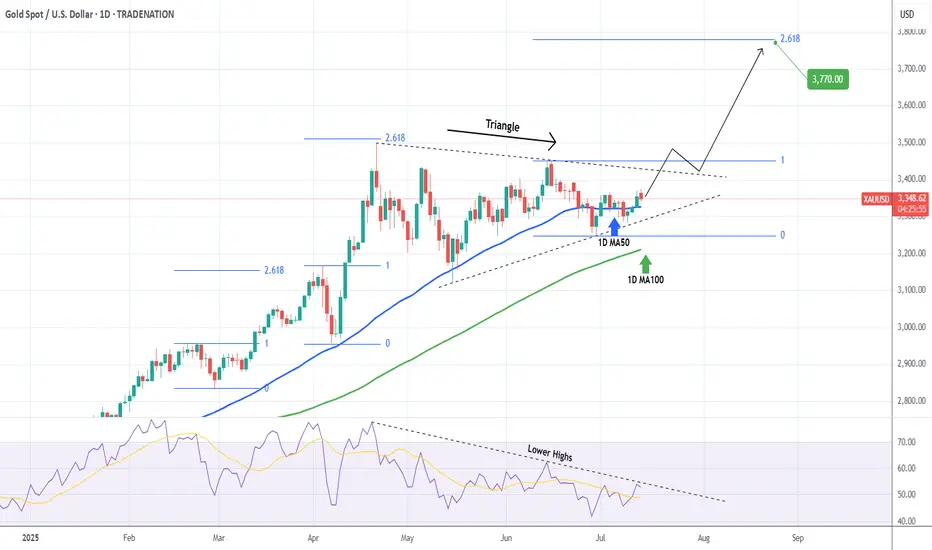
XAUUSD Triangle about to break upwards aggressively.Gold (XAUUSD) has been trading within a Triangle pattern since the April 22 High. It is now above its 1D MA50 (blue trend-line), which has been turned into its Pivot and technically it is about to break upwards as it is running out of space.
As long as the 1D MA100 (green trend-line) holds, the market technically targets the 2.618 Fibonacci extension, which is what the last two Bullish Legs hit, which currently sits at 3770. A 1D RSI break above its own Lower Highs trend-line, could be an early buy signal.
-------------------------------------------------------------------------------
** Please LIKE 👍, FOLLOW ✅, SHARE 🙌 and COMMENT ✍ if you enjoy this idea! Also share your ideas and charts in the comments section below! This is best way to keep it relevant, support us, keep the content here free and allow the idea to reach as many people as possible. **
-------------------------------------------------------------------------------
Disclosure: I am part of Trade Nation's Influencer program and receive a monthly fee for using their TradingView charts in my analysis.
💸💸💸💸💸💸
👇 👇 👇 👇 👇 👇
Gold | Oil | Dollar | Silver | Natural Gas July 2025 Forecast.Gold | Oil | Dollar | Silver | Natural Gas July 2025 Forecast.
NYMEX:NG1! COMEX:GC1! COMEX:SI1! NYMEX:CL1!

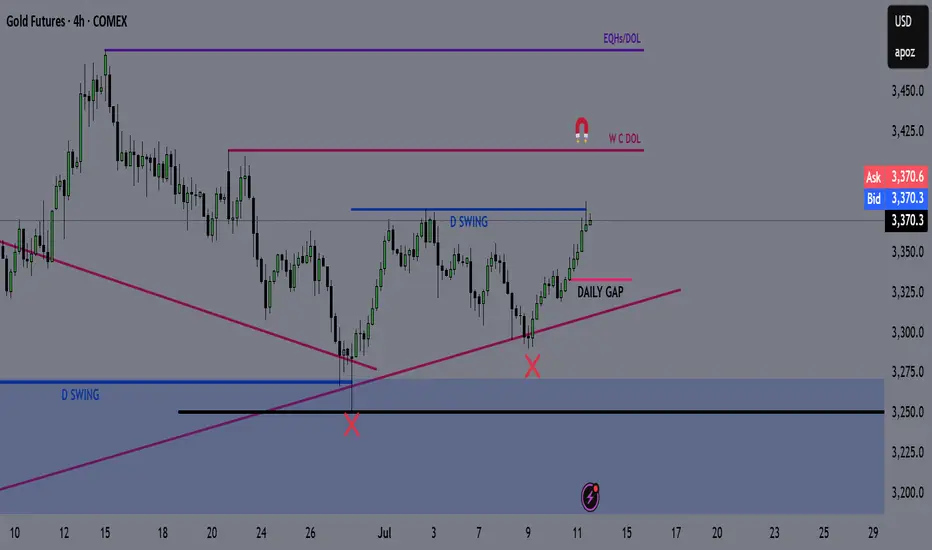
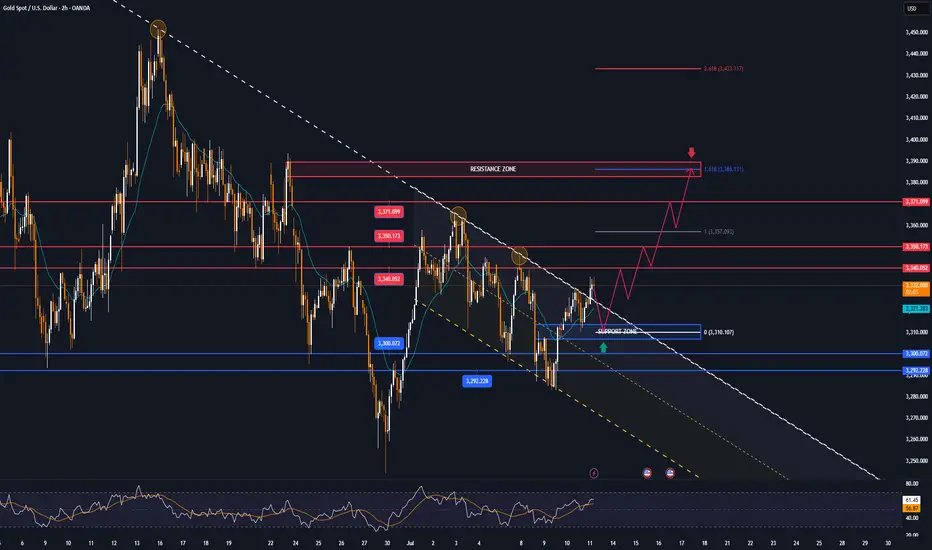
GOLD - GC | Weekly Recap & Plan 13.07.2025🟡 GOLD (GC) Weekly Recap & Outlook
Symbol: GC1!
Date: Week of July 8–12, 2025
Timeframes Used: 4H, Daily, Weekly, HTF structure
🔍 What Happened Last Week?
Gold saw a strong rejection from a confluence of two HTF trendlines, signaling resistance.
But that move was absorbed by:
🟦 Daily Demand (blue zone)
🔵 Daily Swing Liquidity (blue line)
This builds a bullish structure on the daily chart.
🧭 Scenarios I'm Watching
Scenario 1 — Minor Pullback:
🔹 Price may revisit the Daily Gap (pink line) and find support for continuation.
Scenario 2 — Deeper Pullback:
🟣 Price could retrace into the HTF bullish trendline (purple) before resuming upside.
🗞️ Bonus Macro Scenario: Powell Resignation?
There are growing rumors that Fed Chair Powell might resign this week.
📈 If that happens, I expect strong bullish momentum in Gold —
→ very limited retracement, and
→ potential straight breakout into new highs.
🎯 Targets for the Week:
✅ 1st Target:
W C DOL (purple line) → acts as a primary take profit area.
✅ 2nd Target (Expansion):
EQHs / DOL (extended purple levels)
Game Plan:
Watch for LTF confirmation on both retracement zones.
Maintain bullish bias unless Daily Demand fails.
If Powell resigns, be ready for breakout setups.
GOLD MARKET ANALYSIS AND COMMENTARY - [Jul 14 - Jul 18]This week, OANDA:XAUUSD opened at $3,342/oz, dropped to $3,282/oz, but then rebounded sharply to close at $3,355/oz. The recovery was mainly driven by former President Trump's announcement of new tariffs ranging from 20% to 50% on imports from 22 countries, effective August 1st. Particularly, a 35% tariff on Canadian goods — a key U.S. trading partner — raised concerns about global trade stability and supply chains.
Trump also proposed 15–20% tariffs on most other trading partners, reigniting fears of global trade disruptions. At the same time, ongoing conflict between Israel and Hamas continued to weigh on sentiment, despite U.S. diplomatic efforts showing little progress.
However, analysts note that gold still lacks strong momentum for a breakout. Trump's tariff threats may be more about negotiation leverage than triggering a full-blown trade war. Meanwhile, with the labor market recovering and inflation rising, the Fed is expected to maintain its neutral monetary policy, limiting short-term gold price movements.
Although geopolitical tensions remain (e.g., Russia-Ukraine, Israel-Hamas), the ceasefire between Israel and Iran has reduced gold’s geopolitical risk premium.
Looking ahead, key U.S. economic data next week — including CPI, PPI, and retail sales — will be closely watched. A strong June core CPI (0.4% or higher) could reduce the likelihood of a Fed rate cut in September, strengthening the USD and pushing gold lower. Conversely, weaker inflation data could boost expectations of a rate cut, supporting gold prices.
📌In terms of technical analysis, gold prices next week may continue to adjust and accumulate. Accordingly, if they surpass the 3,370 USD/oz mark, gold prices next week will challenge the 3,400-3,450 USD/oz range. On the contrary, gold prices next week will adjust down to 3,285 USD/oz, or even 3,245 USD/oz.
Notable technical levels are listed below.
Support: 3,350 – 3,310 – 3,300USD
Resistance: 3,371 – 3,400 – 3,430USD
SELL XAUUSD PRICE 3435 - 3433⚡️
↠↠ Stop Loss 3439
BUY XAUUSD PRICE 3329 - 3331⚡️
↠↠ Stop Loss 3326
Gold. The plan for the next few days.The nearest resistance zones are where it's interesting to look for purchases. We are waiting for a reaction and looking for an entry point.
The post will be adjusted if there are any changes.
Don't forget to click on the Rocket! =)
GOLD continues to recover, tariff war changes unpredictablyInternational OANDA:XAUUSD continued to rise, boosted by a slight decline in the US Dollar and US Treasury yields. At the same time, investors are closely monitoring the developments in trade negotiations as US President Trump expands the tariff war.
As of the time of writing, spot OANDA:XAUUSD increased by 0.3% to 3,333 USD/oz. The general weakness of the US Dollar, the decline in US Treasury yields and renewed concerns about the escalation of the trade war have helped stabilize gold prices.
On Thursday evening (July 10) local time, US President Donald Trump once again increased pressure on trading partners. He announced that he would impose a 35% tariff on imported goods from Canada, and the USD/CAD exchange rate rose sharply in the short term.
Trump posted on his social media platform Truth Social that a 35% tariff would be imposed on imported goods from Canada, effective from August 1, 2025.
It is still unclear whether the current exemptions for goods traded under the United States-Mexico-Canada Agreement (USMCA) will be extended or terminated.
Due to the impact of escalating trade tensions, spot gold prices also rose by more than 10 dollars in the short term at the beginning of the Asian trading session on Friday, and the current high price of gold has reached around 3,336 USD/ounce.
In an interview with NBC News on Thursday, Trump said he was also considering imposing a flat tariff of 15% to 20% on most of his trading partners, adding that the exact tariff rate was being worked out. The current flat tariff rate is 10%.
Trump sent letters to trading partners this week, announcing that the new tariffs would take effect on August 1 if they could not negotiate more favorable terms. He is expected to send letters to European Union member states soon.
Trump sent the first batch of tariff letters to 14 countries, including Japan and South Korea, on July 7, with tariffs ranging from 25% to 40%. He also said he would send more similar letters this week.
Minutes from the Fed's June 17-18 meeting showed that only a "few" Fed officials thought a rate cut was possible as early as this month, while most preferred to hold off until later in the year due to inflation concerns caused by Trump's tariffs.
The Federal Open Market Committee (FOMC) voted unanimously to leave interest rates unchanged at its June meeting. The next policy meeting is scheduled for July 29-30.
Markets will focus on progress in Trump's tariff negotiations, key US economic data and speeches by Federal Reserve officials later in the day for fresh trading direction for gold prices.
Technical Outlook Analysis OANDA:XAUUSD
Gold has had 2 sessions of recovery from the area around the 0.382% Fibonacci retracement, but the temporary upside momentum is still limited and does not qualify for a new bullish cycle.
In the short term, the EMA21 with the 0.236% Fibonacci retracement will act as the nearest resistance, if gold takes the price action to break above the 0.236% Fibonacci retracement level it will qualify for a new bullish cycle with the target then being around $3,400 in the short term, more so than $3,430.
On the other hand, with the current neutral trend, once gold is sold below the 0.382% Fibonacci retracement level again, it will have conditions to decline, and the target then is around 3,246 USD in the short term, more than the 0.50% Fibonacci retracement level.
The RSI index is hovering around 50, also showing that the market sentiment is still hesitant to have a specific direction.
During the day, the sideways trend of gold prices will be noticed by the following positions.
Support: 3,300 - 3,292 USD
Resistance: 3,340 - 3,350 - 3,371 USD
SELL XAUUSD PRICE 3388 - 3386⚡️
↠↠ Stop Loss 3392
→Take Profit 1 3380
↨
→Take Profit 2 3372
BUY XAUUSD PRICE 3296 - 3298⚡️
↠↠ Stop Loss 3292
→Take Profit 1 3304
↨
→Take Profit 2 3310
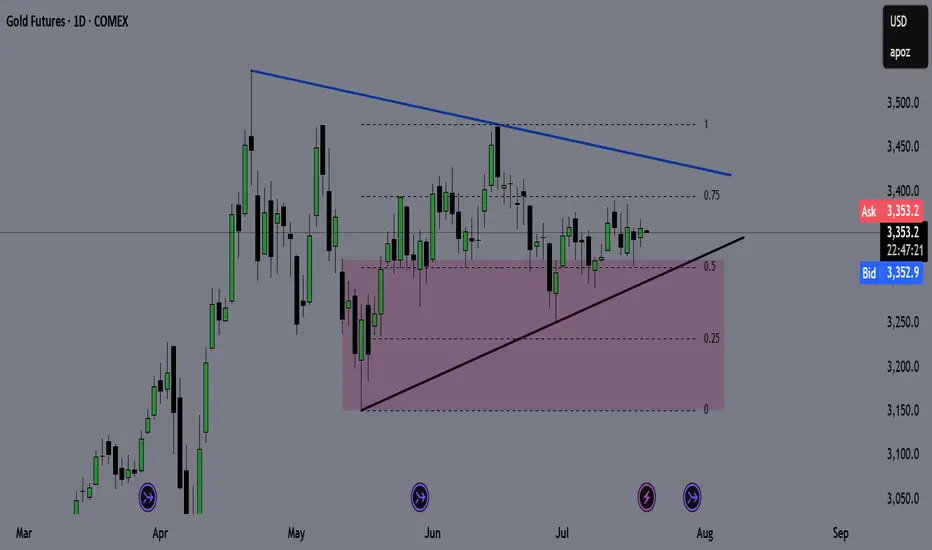
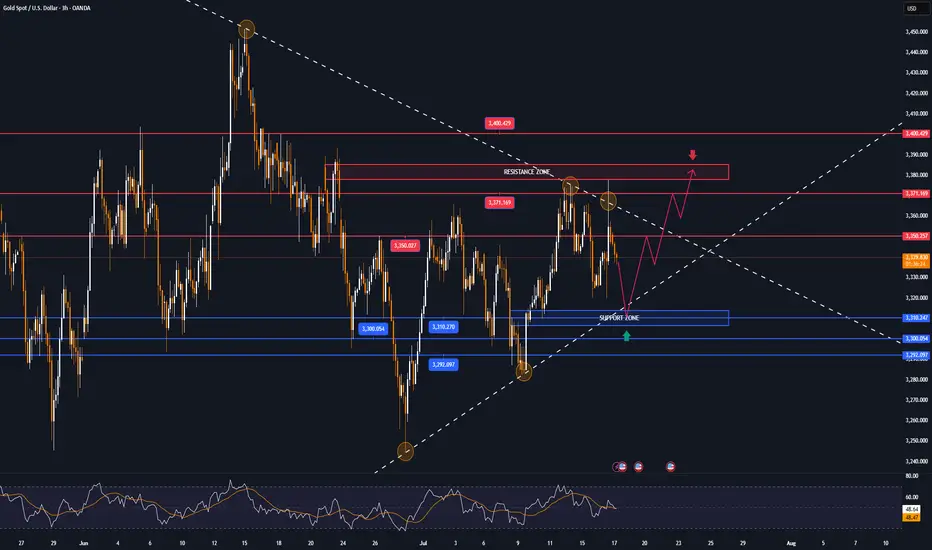
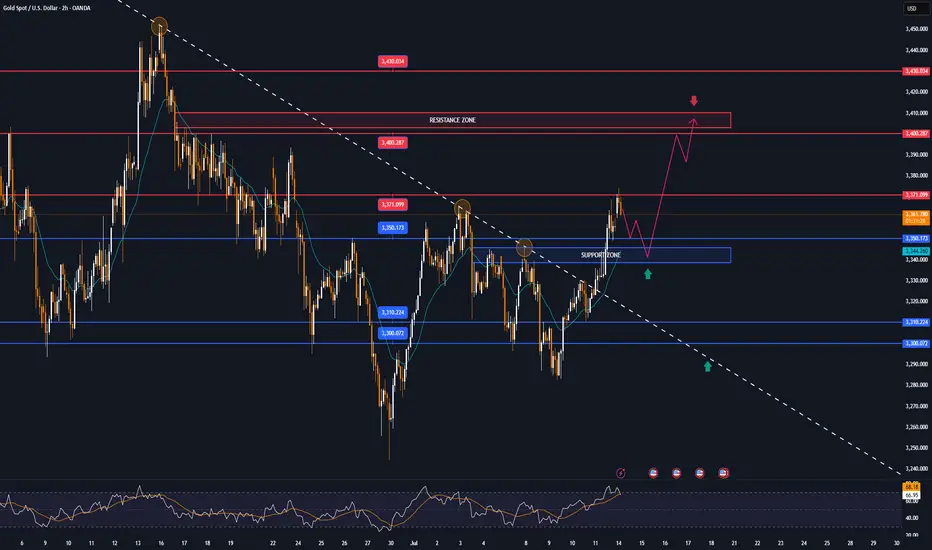
Gold Trade Setup – Long Invalidated, Watching Retest for ShortGold has been consolidating between $3,200 and $3,500, recently pressing against a descending resistance line that has rejected price several times. I was favoring the upside, but our long setup was invalidated — the stop loss at $3,330 was hit.
Price is now retesting ascending support, and I'm shifting focus to a short opportunity, using our previous long entry level (~$3,333) as a key area of interest for entries.
Here’s the updated plan:
Short Entry: Around $3,333
Stop Loss: $3,340
Take Profit: $3,303
Remaining cautious but opportunistic — the larger structure is vulnerable and could break further if support fails.