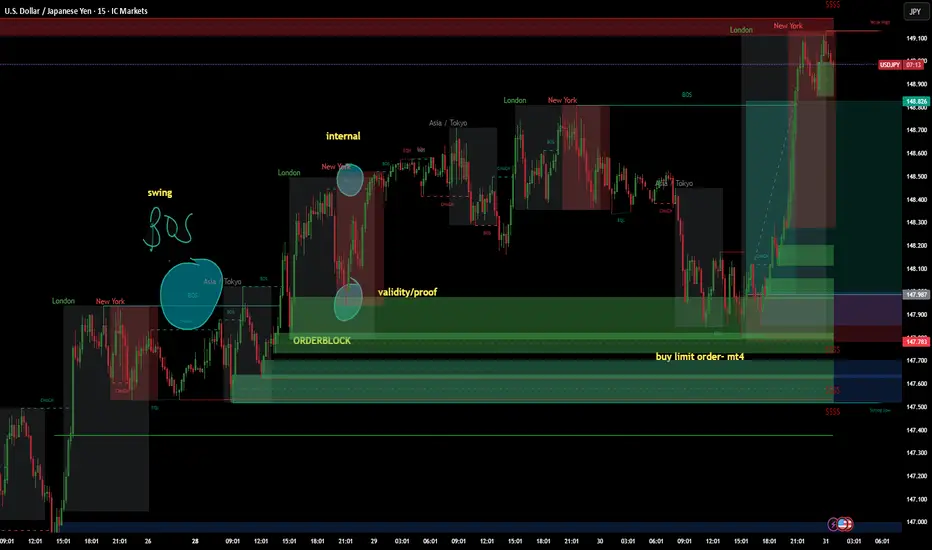
July 30 2025 USDJPY Buy Limit ActivatedGood day, folks!
Another trade today! This is a continuation trade before the USD fundamental news. I've got some useful schematics on my chart for trading continuation momentum patterns with positive confluence in your fundamentals. You can see a swing structure BOS with validity of an internal structure: another BOS. I waited for the price to tap again into that valid order block, which also had validity of internal structure - BOS. The risk-reward (RR) is 1:4. Check the chart for detailed annotations.
I hope you find value in this trade today. Until next time!
#proptrader
#wyckoff
#supplyanddemand
#riskmanagement
GDP
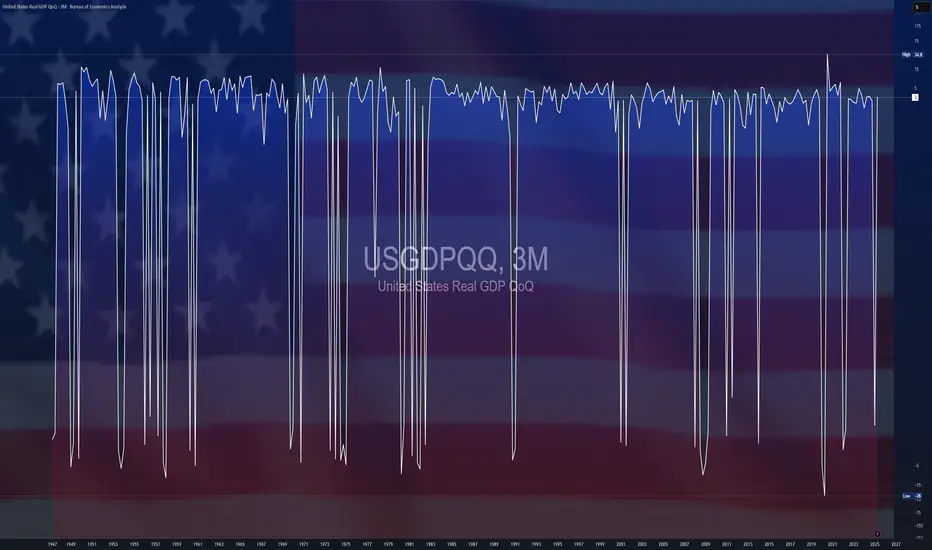
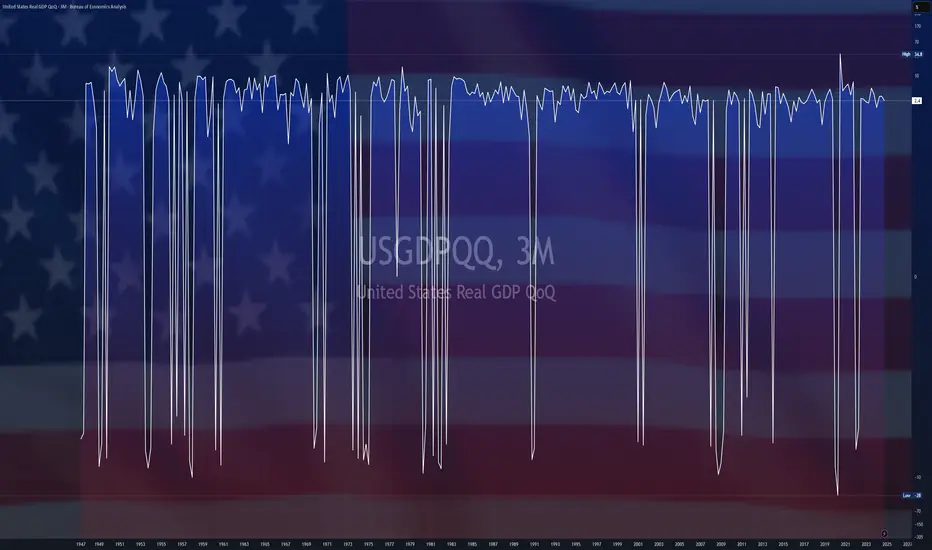
$USGDPQQ -U.S Economic Growth Outpaces Forecasts (Q2/2025)ECONOMICS:USGDPQQ 3%
Q2/2025
source: U.S. Bureau of Economic Analysis
- The US economy grew at an annualized rate of 3% in Q2 2025,
sharply rebounding from a 0.5% contraction in Q1 and exceeding market expectations of 2.4% growth, largely driven by a decline in imports and a solid increase in consumer spending.
However, the gains were partly offset by weaker investment and lower exports.
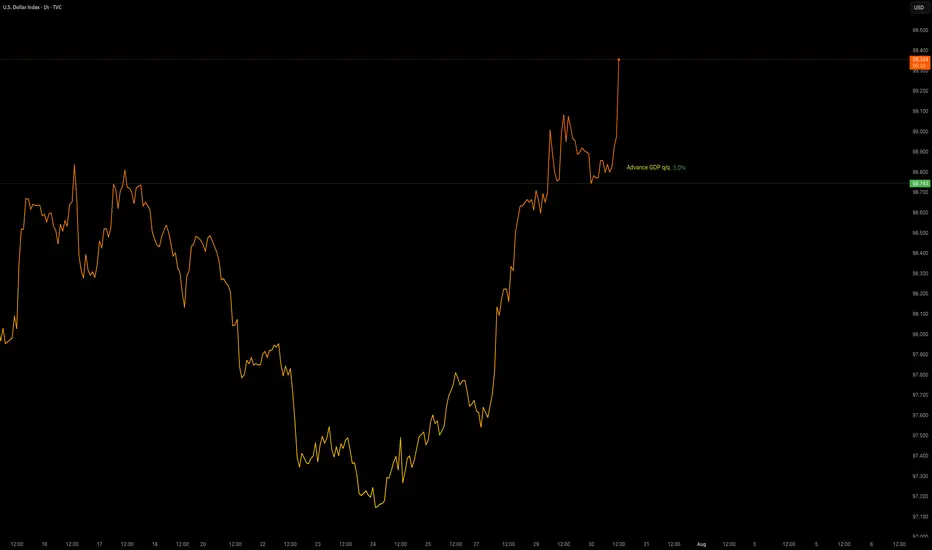
Data Release - Advance GDP q/q (3.0%)Jul 30 2025: ADVANCE GDP q/q (3.0%)
OANDA:XAUUSD sees some downside pressure with positive GDP data.
TVC:DXY gaining strength.
Volatility is increased. This data will be used with Interest Rate Decision later in the day to provide a XAUUSD insight.

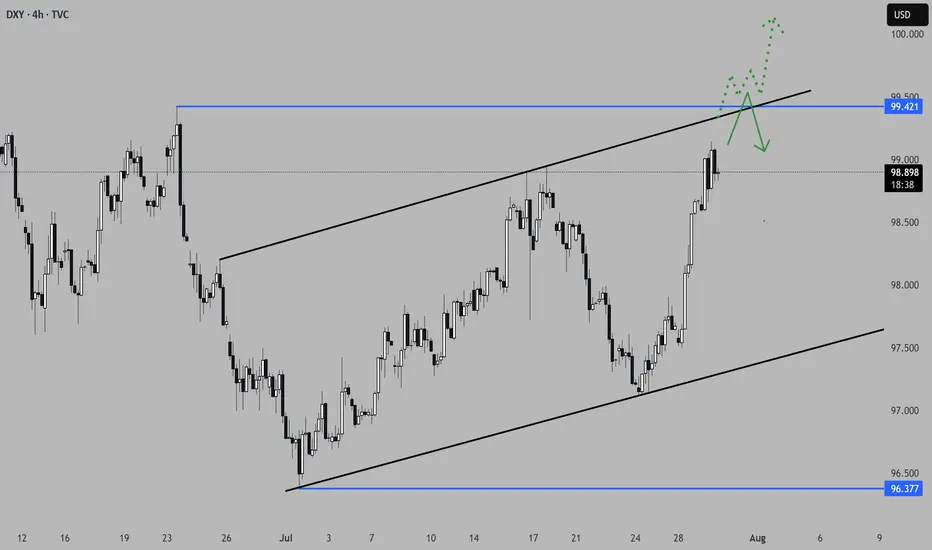
Interesting few days ahead... USD pairs approaching key levelsDXY is finishing a HTF consolidation and is approaching medium-term key areas. Other USD pairs are also in areas where they could aggressively turn around. EURUSD just finished a H4 3-touch continuation flag and is starting to stall on the 3rd touch, suggesting indecision in the markets.
Considering the news events in the next 3 days, starting today with USD advanced GDP data, we could see volatility kicking in on these key levels. We do need a catalyst to push price into a larger directional move, and we are prime positioned for the next leg. Technically, a breakout in both directions would make sense in these areas. Time to set alarms and be vigilant but not jump into trades too early, considering NFP on Friday as well.
*** **** ****
📈 Simplified Trading Rules:
> Follow a Valid Sequence
> Wait for Continuation
> Confirm Entry (valid candlestick pattern)
> Know When to Exit (SL placement)
Remember, technical analysis is subjective; develop your own approach. I use this format primarily to hold myself accountable and to share my personal market views.
The pairs I publish here are usually discussed in detail in my Weekly Forex Forecast (WFF) and are now showing further developments worth mentioning.
⚠ Ensure you have your own risk management in place and always stick to your trading plan.
*** **** ****
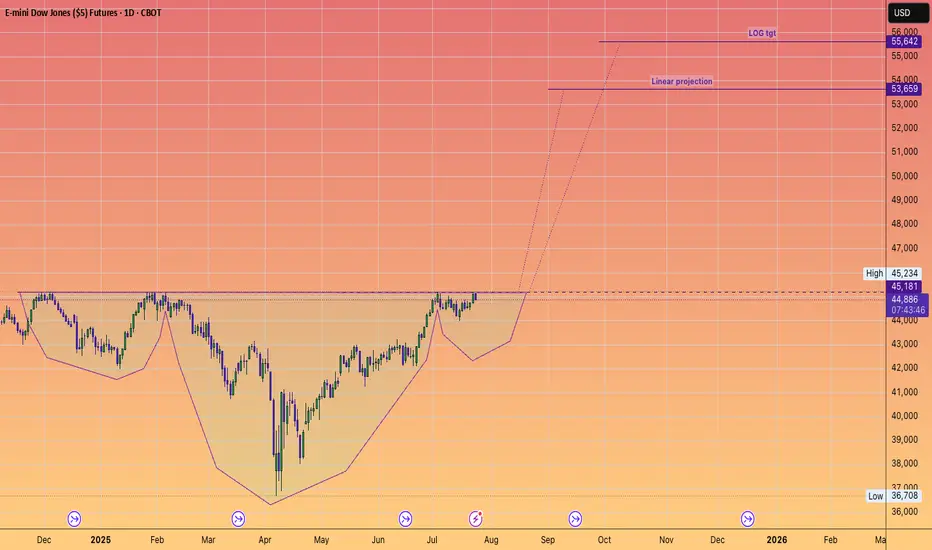
DOW JONES to 55,642#InverseHead&Shoulders
Projects record new highs.
Another stepping stone to our long held forecast of 64,000
Why?
Because AI will significantly contribute to an EXPANDING #GDP
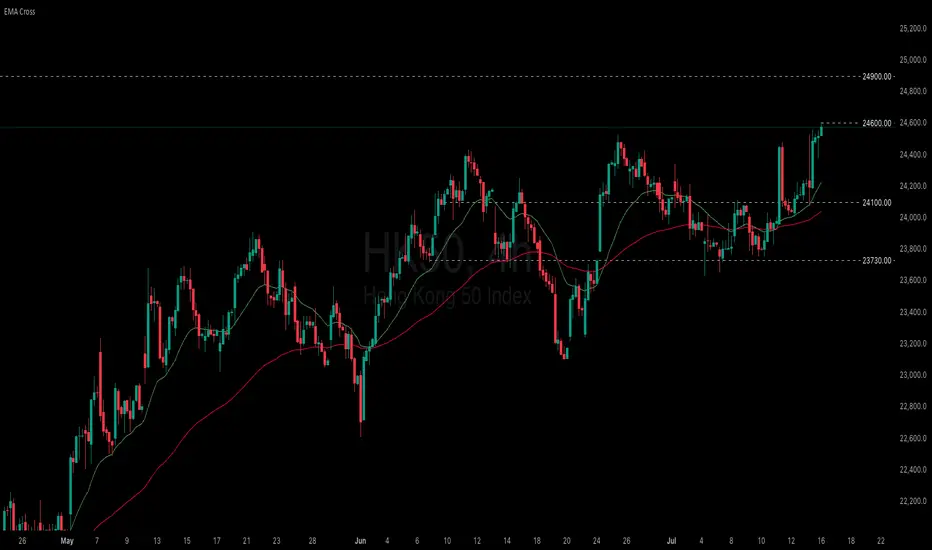
Will China's strong growth and ongoing stimulus lift the HK50?
Despite US-China trade tensions and weak domestic demand, China’s GDP growth has surpassed its 5% target for the first half of the year. According to the National Bureau of Statistics, Q2 GDP grew 5.2% YoY, with authorities noting that stimulus measures aimed at boosting consumption had some effect. Reflecting this momentum, Morgan Stanley raised its 2024 China growth forecast from 4.2% to 4.5%, while Deutsche Bank revised its outlook to 4.7%, a 0.2 percentage point increase.
HK50 maintained its steady uptrend, marking a new 4-month high. Both EMAs widen the gap, indicating the potential continuation of bullish momentum. If HK50 breaches above the recent high at 24600, the index could gain upward momentum toward the next resistance at 24900. Conversely, if HK50 breaks below the support at 24100, the index may retreat to 23730.
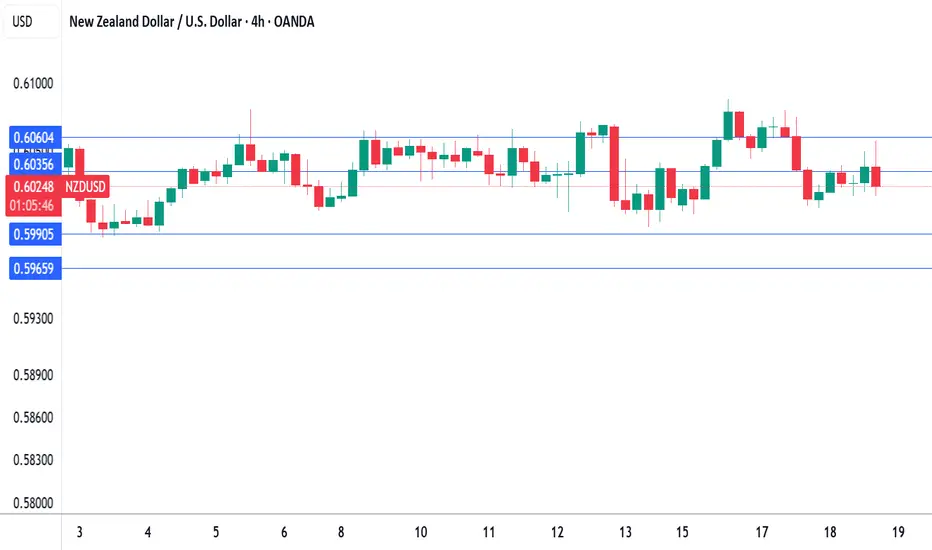
New Zealand GDP expected to contract, New Zealand dollar recoverThe New Zealand dollar has posted gains on Wednesday. In the North American session, NZD/USD is trading at 0.6042, up 0.45% on the day. The New Zealand dollar sustained sharp losses a day earlier, declining 0.75%.
The New Zealand economy is in recession and the markets are bracing for a contraction in first-quarter GDP of 0.8%. The economy declined in Q4 2024 by 1.1%.
A weak GDP report would put pressure on the Reserve Bank of New Zealand to reduce interest rates at the next meeting on July 9. The Reserve Bank has been aggressive and lowered rates for a sixth straight time in May to 3.25%, for a total of 225 basis points.
Is the resilient US consumer showing cracks?
US retail sales slumped in May, falling 0.9% m/m. This was well below the revised -0.1% reading in April and worse than the market estimate of -0.7%. Annually, retail sales fell to 3.3%, down sharply from a revised 5.0%.
The monthly retail sales is particularly concerning because it marked a second straight decline. The pre-tariff spike in consumer spending has fizzled as the tariffs have taken effect. Consumers are wary that the tariffs will boost inflation and dampen consumer spending power and concerns about hiring have risen, prompting consumers to batten down the hatches in anticipation of tougher times ahead.
If additional key US data heads lower, this will increase pressure on the Federal Reserve to lower interest rates. The markets have priced in a hold at Wednesday's meeting at practically 100%, with little chance of a rate cut before September.
NZD/USD is testing resistance at 0.6035. Above, there is resistance at 0.6060
0.5990 and 0.5965 and providing support
US & Global Market Breakdown | Profits, Losses & Bearish TradesIn this video, I break down the current state of the US and global economy, and why I believe we’re heading into a bearish phase.
📉 Fundamentals:
I cover the key macroeconomic factors influencing the markets — including Trump’s proposed new tariffs, slowing GDP growth, and ongoing supply chain constraints. These all point toward increasing pressure on the global economy.
📊 Technical Analysis:
I go over the major indexes and highlight their recent behavior. We’ve seen reactions from resistance levels, contraction patterns forming, and a significant volume dry-up — followed by today’s spike in volume, which occurred right at resistance. These are potential signs that the market may be shifting toward a bearish trend.
That said, we could still just be witnessing a deeper pullback within a longer-term uptrend. Markets are unpredictable, and no one knows for sure — which is why it’s important to always do your due diligence.
💰 I also review the profits and losses I’ve taken on recent bullish trades, and why I’ve now positioned myself in select short opportunities based on what I’m seeing.
If I’m sharing this, it’s because I’m personally investing my capital based on my conviction — so always use your own judgment and risk management when making decisions.
If you found value in the breakdown, leave a like, comment, and subscribe for more timely updates.

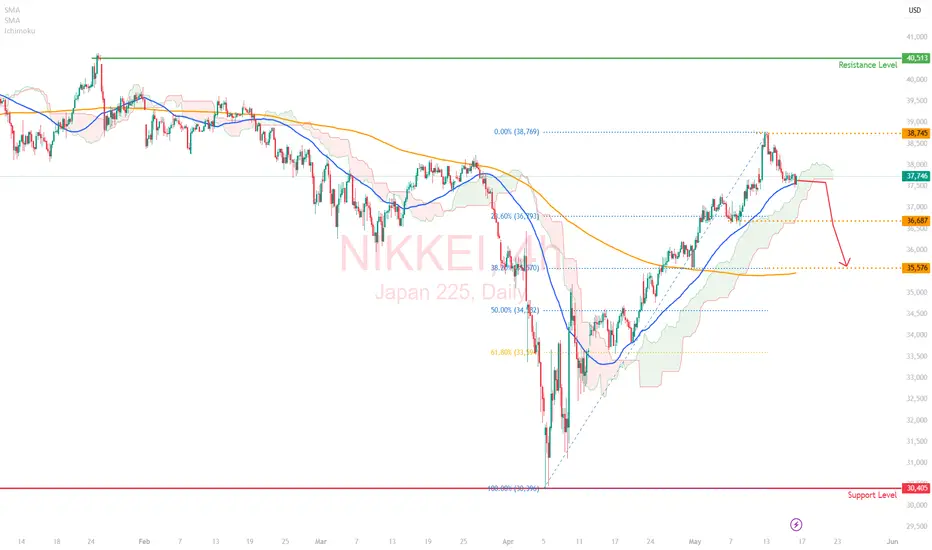
Are you shorting the bounce or waiting for confirmation?Japan’s Q1 GDP came in worse than expected: -0.2% QoQ (-0.7% annualized). Weak consumption, soft exports, and a fading external boost despite a weak yen isn't a great combo for Asia’s largest export economy.
The Nikkei 225 reacted immediately, and the H4 chart is starting to reflect deeper structural pressure.
🔍 Technical Outlook:
- Price reversed from the high of 38,745.
- Price is testing the 50 SMA and could enter the Ichimoku cloud.
- The cloud is signalling a twist, which could be a sign of momentum fading and the trend weakening or reversing.
📊 Projection:
If the price closes below the 50 SMA and breaks through the cloud, further downside could be expected, with the target levels at
- 36,800 (last consolidation zone), and
- 35,570 (38.2% fibonacci retracement level and 200 SMA).
Alternatively, if the bulls defend the cloud, we could see the price climb to the resistance level of 40,500
This is a classic macro meets technicals moment. A weak data print is lining up against the possibility of a technical rollover.
$GBGDPQQ -UK GDP Growth Above Expectations (Q1/2025)ECONOMICS:GBGDPQQ
Q1/2025
source: Office for National Statistics
- The British economy expanded 0.7% on quarter in Q1 2025, compared to 0.1% in Q4 and forecasts of 0.6%, preliminary figures showed. It is the strongest growth rate in 3 quarters, with the largest contribution coming from the services sector, gross fixed capital formation and net trade. Year-on-year, the GDP expanded 1.3%.

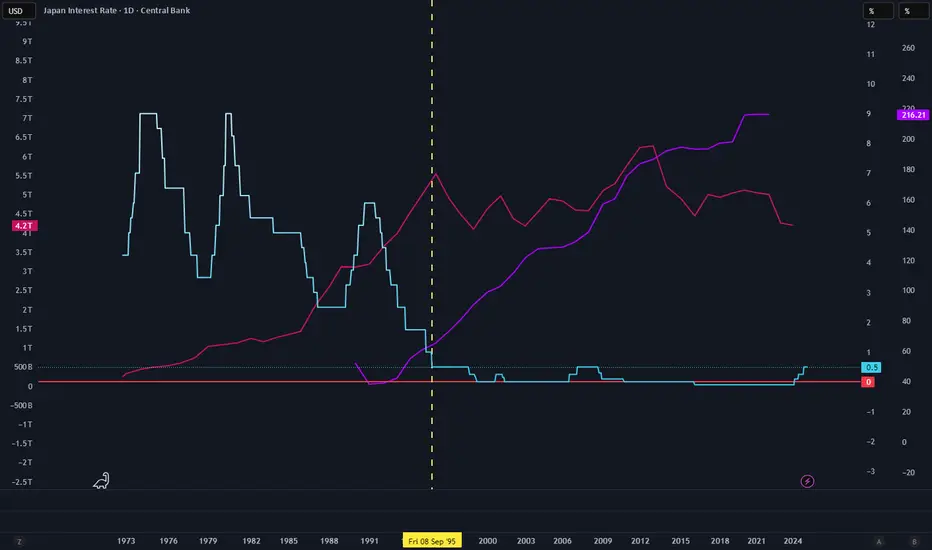
JAPAN IS DOOMED!It's been 30 years since the Central Bank of Japan has maintained ECONOMICS:JPINTR near or even below 0% - WTF!
In combination with weak (or negative) GDP growth rates in the same period, the Japanese Government seems to be in a debt death spiral which will likely come to an end soon. See ECONOMICS:JPGDP and ECONOMICS:JPGDG
Default is inevitable!
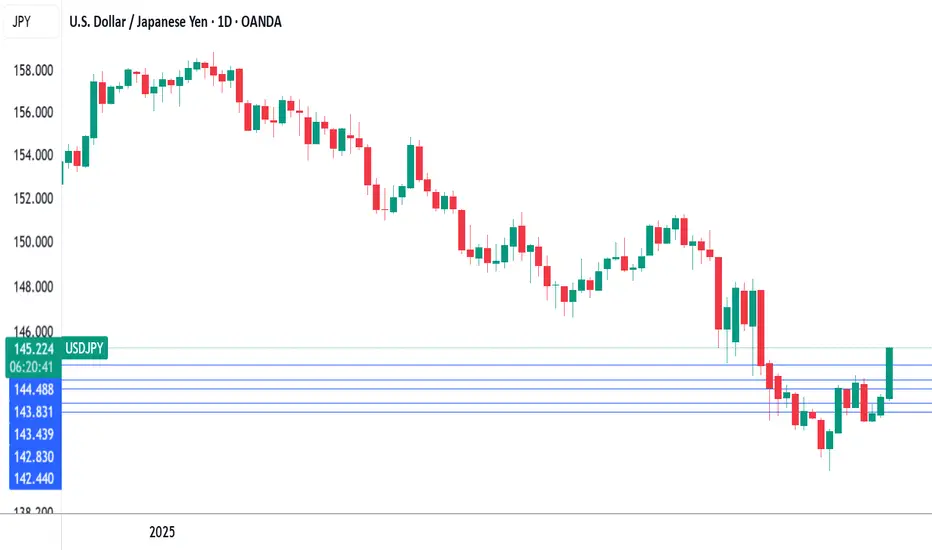
Yen slides as BoJ cuts growth forecastThe Japanese yen continues to lose ground and is sharply lower on Thursday. In the European session, USD/JPY is trading at 144.36, up 0.92% on the day. Earlier, the yen weakened to 144.74, its weakest level since April 10.
There were no surprises from the Bank of Japan, which maintained its key interest rate at 0.5% in a unanimous vote. The BoJ has signaled that it plans to continue hiking rates and normalize policy, but the turmoil caused by US President Trump's tariff policy may delay the next rate increase until after the summer.
The BoJ board cut its growth and inflation forecasts in its quarterly outlook report. The growth forecast for the fiscal year ending March 2026 was slashed to 0.5% from 1.1% in January and inflation is not expected to remain sustainable at 2% until the second half of 2026, a year later than in the January forecast.
The forecast noted that US tariffs would dampen Japan's economy by weighing on global trade and consumer and businesses confidence would be impacted due to the "heightened uncertainties" over the tariffs.
The markets expected a soft US GDP release for Q1 but the 0.3% q/q decline was well below the market estimate of 0.2%. This followed a strong 2.4% gain in the fourth quarter of 2024. The surprise decline was driven by Trump's tariffs, as imports surged ahead of the tariffs taking effect and consumer spending declined.
The weak GDP figure raised the probability of further rate cuts and the markets are looking for up to four rate cuts before the end of the year. The Fed is in a wait-and-see mode, with little chance of a cut in May, but further economic deterioration could force the Fed to cut in June.
German inflation higher than expected, Euro dipsThe euro is calm on Wednesday. In the North American session, EUR/USD is trading at 1.1334, down 0.45% on the day.
Germany's inflation rate dropped to 2.1% y/y in April, down from 2.2% in March but above the market estimate of 2.0%. This was the lowest level in seven months, largely driven by lower energy prices.
The more significant story was that core CPI, which excludes energy and food and is a more reliable indicator of inflation trends, rose to 2.9% from 2.6%. This will be of concern to policymakers at the European Central Bank, as will the increase in services inflation. The ECB has to balance the new environment of US tariffs and counter-tariffs against the US, which will raise inflation, along with the strong rise in the euro and fiscal stimulus which will boost upward inflationary pressures.
The ECB will be keeping a close look at Friday's eurozone inflation report, which is expected to follow the German numbers. Headline CPI is projected to drop to 2.1% from 2.2%, while the core rate is expected to rise to 2.5% from 2.4%. The central bank would prefer to continue delivering gradual rate cuts in order to boost anemic growth, but this will be contingent on inflation remaining contained.
The markets were braced for soft US numbers but the data was worse than expected. ADP employment change declined to 62 thousand, down from a revised 147 thousand and below the market estimate of 115 thousand.
This was followed by first-estimate GDP for Q1, which declined by 0.3% q/q, down sharply from 2.4% in Q4 and lower than the market estimate of 0.3%. This marked the first quarterly decline in the economy since Q1 2022. The weak GDP reading was driven by a surge in imports ahead of US tariffs taking effect and a drop in consumer spending.
EUR/USD has pushed below support at 1.1362 and is testing support at 1.1338. Below, there is support at 1.1306
There is resistance at 1.1394 and 1.1418

German inflation higher than expected, Euro dipsThe euro is calm on Wednesday. In the North American session, EUR/USD is trading at 1.1334, down 0.45% on the day.
Germany's inflation rate dropped to 2.1% y/y in April, down from 2.2% in March but above the market estimate of 2.0%. This was the lowest level in seven months, largely driven by lower energy prices. The more significant story was that core CPI, which excludes energy and food and is a more reliable indicator of inflation trends, rose to 2.9% from 2.6%. This will be of concern to policymakers at the European Central Bank, as will the increase in services inflation.
The ECB has to balance the new environment of US tariffs and counter-tariffs against the US, which will raise inflation, along with the strong rise in the euro and fiscal stimulus which will boost upward inflationary pressures. The ECB will be keeping a close look at Friday's eurozone inflation report, which is expected to follow the German numbers. Headline CPI is projected to drop to 2.1% from 2.2%, while the core rate is expected to rise to 2.5% from 2.4%.
The central bank would prefer to continue delivering gradual rate cuts in order to boost anemic growth, but this will be contingent on inflation remaining contained.
The markets were braced for soft US numbers but the data was worse than expected. ADP employment change declined to 62 thousand, down from a revised 147 thousand and below the market estimate of 115 thousand.
This was followed by first-estimate GDP for Q1, which declined by 0.3% q/q, down sharply from 2.4% in Q4 and lower than the market estimate of 0.3%. This marked the first quarterly decline in the economy since Q1 2022. The weak GDP reading was driven by a surge in imports ahead of US tariffs taking effect and a drop in consumer spending.

$EUGDPQQ -Eurozone GDP Growth Rate Beats Forecasts (Q1/2025)ECONOMICS:EUGDPQQ
Q1/2025
source: EUROSTAT
-The Eurozone economy grew by 0.4% in the first quarter of 2025,
accelerating from 0.2% in the previous quarter and exceeding market expectations of 0.2%.

$USGDPQQ -U.S Economy Unexpectedly Contracts in Q1/2025ECONOMICS:USGDPQQ
Q1/2025
source: U.S. Bureau of Economic Analysis
-U.S economy shrank 0.3% in Q1 2025, the first contraction since Q1 2022,
versus 2.4% growth in Q4 and expectations of 0.3% expansion, as rising trade tensions weighed on the economy.
Net exports cut nearly 5 percentage points from GDP as imports jumped over 40%. Consumer spending rose just 1.8%,
the weakest since mid-2023, while federal government outlays fell 5.1%, the most since Q1 2022.
Australian core CPI falls within the RBA target, Aussie shrugsThe Australian dollar has been showing strong movement this week but is calm on Wednesday. In the European session, AUD/USD is trading at 0.6391, up 0.14% on the day.
Australia released the CPI report for the first quarter. The Australian dollar didn't show much reaction, but the data could point to another rate cut from the Reserve Bank of Australia.
Headline CPI remained unchanged at 2.4% y/y, just above the market estimate of 2.3%. The significant news was that RBA Trimmed Mean CPI, the key core inflation indicator, dropped to 2.9% y/y from a revised 3.3% gain in Q4 2024. This is the first time in three years that core CPI is back within the RBA's target band of between 1-3%.
The drop in core inflation is good news for the government, with the national election on Saturday. Australian Treasurer Jim Chalmers jumped on the news, stating that the market expects four or five rate additional rate cuts this year, which would save households with mortgages "hundreds of dollars".
The Reserve Bank is expected to lower rates at its next meeting on May 20, which would mark only the second rate cut this year. After cutting rates in February, the central bank has stayed on the sidelines as US President Trump's tariffs have escalated trade tensions and sent the financial markets on a roller-coaster ride.
In the US, the markets are bracing for some weak data later today. ADP employment is expected to slip to 108 thousand, compared to 155 thousand in the previous release. ADP is not considered a reliable gauge for Friday's nonfarm payrolls, but a weak reading will only increase the anxiety of the nervous markets. US first-estimate GDP for Q1 is expected to slide to just 0.4% q/q, after a 2.4% gain in Q3. If there is a surprise reading from GDP, we could see a strong reaction from the US dollar after the release.
AUD/USD is testing resistance at 0.6403. Above, there is resistance at 0.6431
0.6357 and 0.6329 are the next support levels

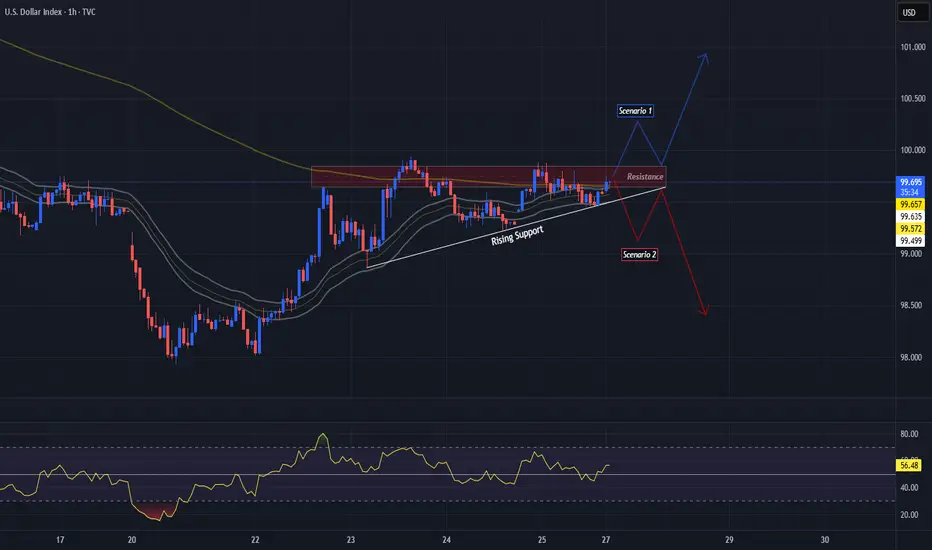
DXY Printing a Bullish Triangle??The DXY on the 1 Hr Chart is forming a potential continuation pattern, the Bullish Triangle!
Currently Price is testing the 99.6 - 99.8 Resistance Area and battling with the 200 EMA and 34 EMA Band. The reaction to this conjunction could be pivotal in who overcomes: Buyers or Sellers.
Now during the formation of the potential pattern, Price on the RSI has stayed relatively Above the 50 mark being Bullish Territory suggesting Buyers could win the Bull-Bear battle.
Until Price breaks either the Resistance Area or the Rising Support, we will not have a definitive direction in which USD will strengthen or weaken.
*Wait For The Break*
-If Price breaks the Resistance Area, USD will strength possibly heading to the 100.8 - 101 Area
-If Price breaks the Rising Support, USD will weaken possibly heading to the 98.5 - 98.3 Area
Fundamentally, it is said China and USA are possibly getting closer to potentially ending the Reciprocal Tariff War going on with both sides willing to negotiate.
With the USA being the #1 Consumer of Goods globally, other economies can not afford us to not buy their things so I continue to see the Tariff War more as a Strong-Arm for the USA to be able to negotiate better terms!
USD News:
JOLTS - Tuesday, Apr. 29th
GDP - Wednesday, Apr. 30th
Unemployment Claims / ISM Manu. PMI - Thursday, May 1st
Non-Farm Employment Change / Avg Hourly Earnings / Unemployment Rate - Friday, May 2nd
For all things Currency,
Keep it Current,
With Novi_Fibonacci
British pound keeps rolling as UK GDP shinesThe British pound is up sharply on Friday, extending its rally for a fourth straight day. In the European session, GBP/USD is trading at 1.3088, up 0.94% on the day. The pound has surged 2.9% since Monday.
UK GDP higher than expected February with a gain of 0.5% m/m. This followed a revised 0% reading in January and beat the market estimate of 0.1%. This was the fastest pace of growth since March 2024. Services, manufacturing and construction all recorded gains. For the three months to January, GDP expanded 0.6%, above the revised 0.3% gain in January and higher than the market estimate of 0.4%.
The strong GDP data is welcome news amid all the uncertainty created by US President Trump's tariff policy. The UK's largest trading partner is the US and the 10% tariffs on UK products will hurt the UK export sector (Trump has suspended an additional 10% tariff for 90 days).
Bank of England expected to lower rates in May
The turmoil in the financial markets and escalating trade tensions has the Bank of England worried. The markets have priced in a rate cut in May, betting that the BoE will ease policy in order to support the weak economy, even with inflation above the 2% target. The BoE kept rates unchanged in March and meets next on May 8.
The US-China trade war rose up a notch on Friday, as China announced it would raise tariffs on US goods to 125% from 84%. This move was in response to the US lifting tariffs on China by 125% this week, for a total tariff rate at 145%. The trade war will dampen China's economy and Goldman Sachs has lowered its 2025 GDP forecast for China to 4.0% from 4.5%.

India, USA, China - Government Debt to GDP PerformanceIndia’s Fiscal Discipline Stands Out in a High-Debt Global Economy
Government Debt to GDP Performance Over the Last 20 Years:
China: +217%
USA: +99%
India: +3%
Over the last 2 decades, global economies have increasingly relied on debt to stimulate growth and manage crises.
However, a closer look at long-term Debt-to-GDP trends reveals a stark contrast in fiscal discipline among major economies:
-----------------------------------------------------------------------
India: A Beacon of Fiscal Stability
India has maintained remarkable fiscal discipline, with government debt increasing by just +3% relative to its GDP over the past 20 years.
This demonstrates India’s conservative borrowing strategy, especially notable given the country’s ambitious development goals, infrastructure push, and welfare programs.
This level of restraint positions India well in the face of rising global interest rates and inflation risks.
-----------------------------------------------------------------------
USA: Steady Climb Amid Stimulus Spending
The United States has seen a +99% increase in its debt-to-GDP ratio over the same period, driven by successive rounds of stimulus, defense spending, and entitlement obligations.
While the U.S. enjoys the unique advantage of issuing the world’s reserve currency, the long-term implications of rising debt—especially as interest payments rise—pose potential challenges to fiscal sustainability.
-----------------------------------------------------------------------
China: Debt-Fueled Expansion
China’s debt-to-GDP has surged +217% over the past two decades, reflecting its aggressive infrastructure-led growth model and significant off-balance-sheet local government borrowing.
While this has powered China's rapid urbanization and industrial growth, the mounting debt burden raises questions about long-term efficiency, default risks in the shadow banking sector, and the need for deleveraging.
-----------------------------------------------------------------------
🔍 Key Insights:
1) India’s 3% debt growth over 20 years highlights an underleveraged economy, offering headroom for targeted fiscal expansion if needed.
2) In a world where debt sustainability is becoming a key investment theme, India stands out as a relatively safer macro environment.
3) This fiscal prudence complements India’s improving trade metrics and strengthens its position in global economic leadership.
-----------------------------------------------------------------------
📈 Conclusion:
As the global economy grapples with inflation, rising interest rates, and debt concerns, India’s modest rise in government debt is a key macro strength.
While China and the USA have seen significant increases in their debt burdens, India’s fiscal balance provides confidence to both investors and policymakers for future growth cycles.
This makes India an attractive long-term investment destination in a world of rising uncertainty.

GBP/USD shrugs as UK GDP unexpectedly declineshe British pound has edged lower against the US dollar on Friday. GBP/USD is trading at 1.2928 in the European session, down 0.13% on the day.
The UK economy barely registered any growth in the second half of 2024, rising 0.1% in the third quarter and flatlining in the third quarter. The New Year hasn't seen any improvement, as GDP contracted 0.1% m/m in January, after a 0.4% gain in December and missing the market estimate of 0.1%. The surprise contraction was driven by declines in the production and manufacturing sectors. The economy expanded 0.2% in the three months to January, up from 0.1% in the three months to December but shy of the market estimate of 0.3%.
The weak GDP report won't make things any easier for Finance Minister Rachel Reeves, who will announce the Treasury's "Spring Statement" on March 26. Reeves is expected to outline plans for higher taxes and spending cuts. The tax hikes on British businesses are expected to weigh on investment, hiring and growth.
The Bank of England meets on March 20 and is widely expected to maintain rates at 4.5%. The BoE trimmed rates by a quarter-point in February. Inflation rose sharply in January to 3.0% y/y, up from 2.5% in December. The rise in inflation and weak GDP has raised concerns about stagflation, which is characterized by persistent inflation and weak growth.
Another headache for BoE policymakers is US President Donald Trump's tariff policy. The UK had hoped to avoid the tariffs, but this week the US slapped 25% tariffs on all steel and aluminum imports, including on UK products. That could hurt UK growth and boost inflation.
GBP/USD tested resistance at 1.2949 earlier. Above, there is resistance at 1.2978
1.2923 and 1.2894 are the next support levels

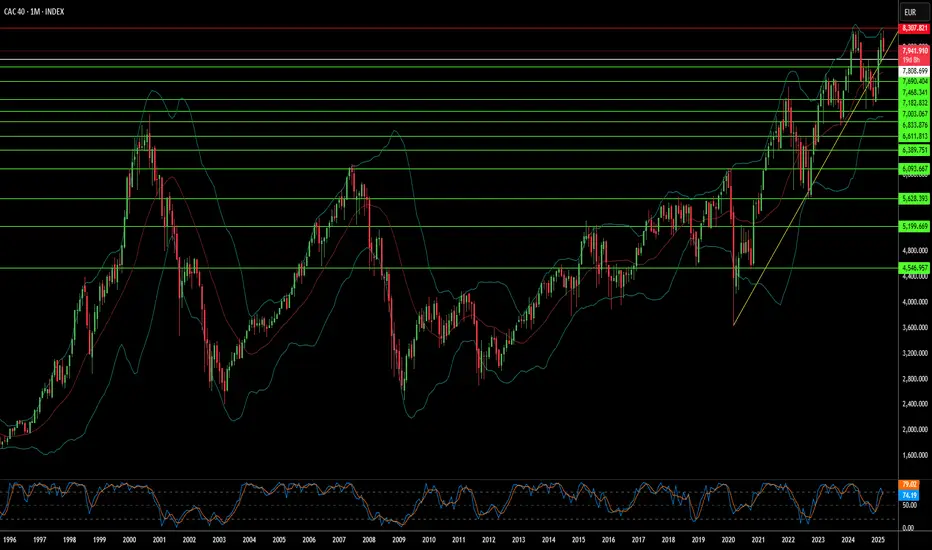
Can France’s Economy Defy Gravity?The CAC 40, France’s flagship stock index, showcases the nation’s economic strength, driven by global giants like LVMH and TotalEnergies. With their vast international presence, these multinational corporations provide the index with notable resilience, allowing it to endure domestic challenges. However, this apparent stability masks a deeper, more intricate reality. Beneath the surface, the French economy grapples with significant structural issues that could undermine its long-term success, making the CAC 40’s performance both a symbol of hope and a point of vulnerability.
France confronts multiple internal pressures that threaten its economic stability. An aging population, with a median age of 40—among the highest in developed nations—shrinks the workforce, increasing the burden of healthcare and pension costs. Public debt, projected to hit 112% of GDP by 2027, restricts fiscal flexibility, while political instability, such as a recent government collapse, hampers essential reforms. Compounding these issues is the challenge of immigration. France’s immigrant population, particularly from Africa and the Middle East, faces difficulties integrating into a rigid labor market shaped by strict regulations and strong unions. This struggle limits the nation’s ability to leverage immigrant labor to offset workforce shortages while straining social unity, adding further complexity to France’s economic challenges.
Looking forward, France’s economic future hangs in the balance. The CAC 40’s resilience offers a buffer, but lasting prosperity depends on tackling these entrenched problems—demographic decline, fiscal constraints, political gridlock, and the effective integration of immigrants. To maintain its global standing, France must pursue bold reforms and innovative solutions, a daunting task requiring determination and foresight. As the nation strives to reconcile its rich traditions with the demands of a modern economy, a critical question looms: can France overcome these obstacles to secure a thriving future? The outcome will resonate well beyond its borders, offering lessons for a watching world.