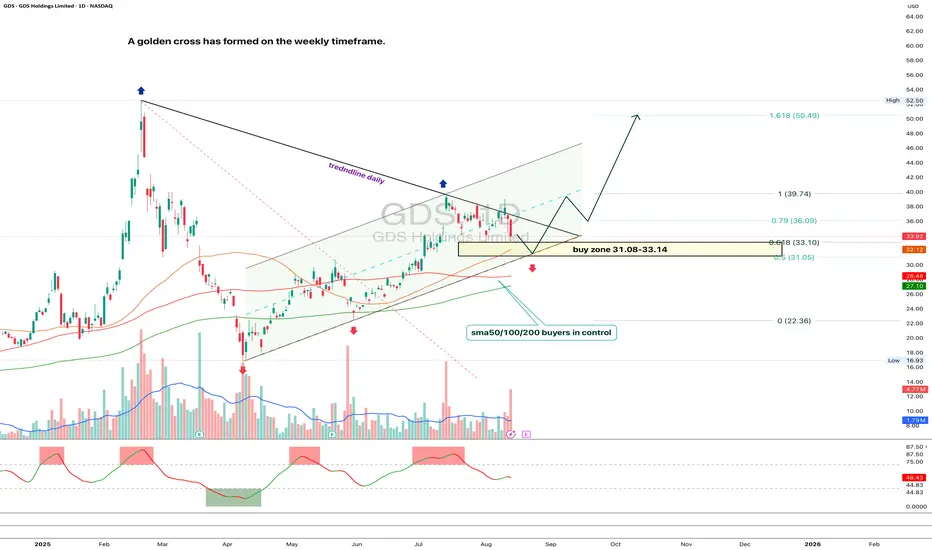
GDS 1D - golden cross and key buying zoneOn the daily chart of GDS, price is moving within a steady ascending channel and is now correcting toward the key support zone at 31.08–33.14. This zone is reinforced by the 0.618 Fibo level (33.10), the lower channel boundary, and the cluster of SMA50/100/200 averages, which remain under buyers’ control. On the weekly timeframe, a golden cross has formed, signaling a long-term bullish momentum.
The current structure suggests a pullback into 31.08–33.14, followed by a potential bounce. If demand confirms in this area, the technical target lies at 39.74, with an extended bullish scenario aiming for the 1.618 Fibo at 50.49. A break below 31.00 would invalidate the bullish outlook.
Fundamentally , GDS continues to benefit from rising demand for data centers in China and active infrastructure expansion. The long-term trend is supported by strong capital inflows into the tech sector, though short-term corrections within the channel remain part of the normal cycle.
Tactical plan: watch for reaction in the 31.08–33.14 zone; a confirmed buy signal could trigger entries targeting 39.74 and 50.49. Strong setup, but requires disciplined execution.
GDS
GDS Holdings (GDS) AnalysisCompany Overview:
GDS Holdings NASDAQ:GDS , a leading provider of high-performance data center solutions in China and Southeast Asia, is well-positioned to benefit from the exploding demand for data centers driven by cloud adoption, AI proliferation, and digital transformation across the region.
Key Catalysts:
Capital Injection to Fuel Growth:
GDS secured an upsized Series B equity raise of $1.2 billion, led by key backers like SoftBank Vision Fund and Kenneth Griffin, reflecting significant investor confidence.
The capital will enable GDS to develop over 1 GW of new data center capacity, fast-tracking its expansion plans across its key markets.
Strong Regional Demand:
Rising data consumption and the rapid digitalization in China and Southeast Asia position GDS to capitalize on surging regional demand for premium data centers.
GDS’s established expertise and strategic partnerships further solidify its leadership in these high-growth regions.
Long-Term Revenue Growth:
The investment supports GDS’s long-term ambitions to increase scale and market share, enabling sustainable revenue and margin growth.
Investment Outlook:
Bullish Outlook: We are bullish on GDS above the $17.50-$18.00 range, driven by its strong expansion strategy, favorable market conditions, and robust investor backing.
Upside Potential: Our upside target for GDS is $34.00-$35.00, reflecting substantial growth opportunities in data center infrastructure and the company’s ability to execute its large-scale development plans.
🚀 GDS—Expanding Capacity to Meet Surging Data Center Demand in Asia. #DataCenters #TechInfrastructure #GrowthMarkets

GDS Holdings Limited Options Ahead of EarningsLooking at the GDS Holdings Limited options chain ahead of earnings , i would buy the $20 strike price Calls with
2022-12-16 expiration date for about
$0.90 premium.
If the options turn out to be profitable Before the earnings release, i would sell at least 50%.
Looking forward to read your opinion about it.

GDS loss 10 Day Moving AverageGDS (9698.HK) losses 10 day moving average. As Google's 2Q cloud business loss form consensus, the whole cloud sector is deteriorating. GDS should be a SELL.
GDS, MACD Histogram just turned positiveThis is a Bullish indicator signaling GDS's price could rise from here. Traders may explore going long the stock or buying call options. Tickeron A.I. dvisor identified 39 similar cases where GDS's MACD histogram became positive, and 32 of them led to successful outcomes. Odds of Success: 82%. Current price $86.17 is above $85.61 the highest resistance line found by Tickeron A.I. Throughout the month of 09/24/20 - 10/26/20, the price experienced a +10% Uptrend. During the week of 10/19/20 - 10/26/20, the stock enjoyed a +5% Uptrend growth.
Bullish Trend Analysis
The Moving Average Convergence Divergence (MACD) for GDS just turned positive on October 26, 2020. Looking at past instances where GDS's MACD turned positive, the stock continued to rise, Tickeron A.I. shows that in 32 of 39 cases over the following month. The odds of a continued upward trend are 82%.
GDS moved above its 50-day Moving Average on September 25, 2020 date and that indicates a change from a downward trend to an upward trend.
The 10-day Moving Average for GDS crossed bullishly above the 50-day moving average on October 01, 2020. This indicates that the trend has shifted higher and could be considered a buy signal. Tickeron A.I. detected that in 8 of 11 past instances when the 10-day crossed above the 50-day, the stock continued to move higher over the following month. The odds of a continued upward trend are 73%.
Following a +1.71% 3-day Advance, the price is estimated to grow further. Considering data from situations where GDS advanced for three days, in 231 of 261 cases, the price rose further within the following month. The odds of a continued upward trend are 89%.
The Aroon Indicator entered an Uptrend today. Tickeron A.I. detected that in 219 of 247 cases where GDS Aroon's Indicator entered an Uptrend, the price rose further within the following month. The odds of a continued Uptrend are 89%.

GDS Back to school Lost some knowledge during summer, but getting back to it. Continue uptrend push past the 20 SMA and you'll be golden for gains!
