GE
LONG GE Electric GEThis is good opportunity to take LONG position in GE.
This Analysis is educational purpose only.
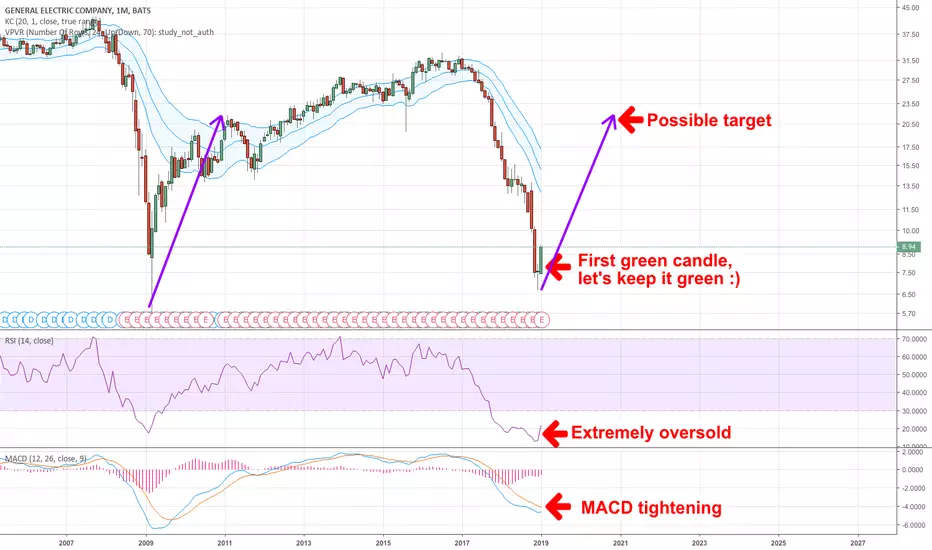
General Electric: really going up soon?Hi all, Tolyan online.
First of all, Happy New Year and Merry Christmas all.
During the New Year holidays there are often trend reversals, hope this year the rule will also apply.
Now I want to talk about General Electric. GE is pindoses who make locomotives :)
We can see that there is high possibility of the downtrend coming to the end, monthly MACD and RSI indicators are almost signalising a reversal. And RSI is extremely oversold.
Also, the price is too deviated off the Kertnel Channel, and that means the price will want to kiss it soon.
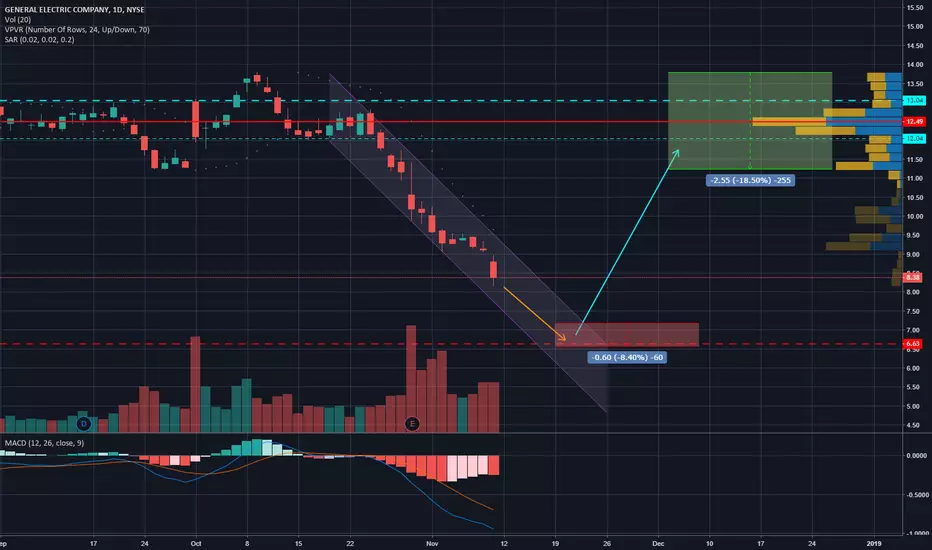
GE New CEO... new era!Most of you already know that I added this asset in my portfolio looking for $32 a share within 5 years. How do we get it? Basically a real growth of 0.1% this year and 1% the next one. About the EBITDA, I'm expecting a revenue of 14% this year, and it will be completely attainable hold 17% average the next years. So as you can see, this share is quite underweight but it means a real potential over 100% profit. My PV for this year is $18.73 a share (more than 50% profit from where it is today).
Learn how to beat the market as Professional Trader with an ex-insider!
Have a Nice Trading Week!
Cream Live Trading, Best Regards!
Main Idea:
Learn how to beat the market as Professional Trader with an ex-insider!
Have a Nice Trading Week!
Cream Live Trading, Best Rega

Well, after all I would put some dollars in GEAfter all, I would put some dollars rolling in GE for the next 5 years.
Entry: coming days, I'd like around 13.
Target: 32.
SL: <11 - >10
Potential: >1.2%
Learn how to beat the market as Professional Trader with an ex-insider!
Have a Good Trading Week,
Cream Live Trading, Best Regards!
GE - A rebound for a crumbling companyNot financial advice. Do your own research. The ideas shared are the personal opinions of the BitDoctor team.
Oh GE, what are you going to do in 2019? 2018 was probably your worst performing year but while the stock market is crumbling, you seem to be bouncing pretty hard here. Don't get caught with all the green candles and percentage gains. Bear markets are still bear markets. There's heavy resistance coming right up!
Short term I see $8.75 as a key resistance point. Next, I will be looking at $10 as some key resistance.
If GE is able to push through $10, then I can see $13 and $15 in the future for GE. That is probably more long term, and assuming GE can hold the levels mentioned above, including the not-mentioned $8 barrier that was crossed today.
Disclaimer: I currently hold a position in GE but have no plans to make any changes to my position in the next 48 hours.

TSLA vs GE : Weekly agressive scenarios at low risksHope this idea will inspire some of you !
Don't forget to hit the like/follow button if you feel like this post deserves it ;)
That's the best way to support me and help pushing this content to other users.
Kindly,
Phil

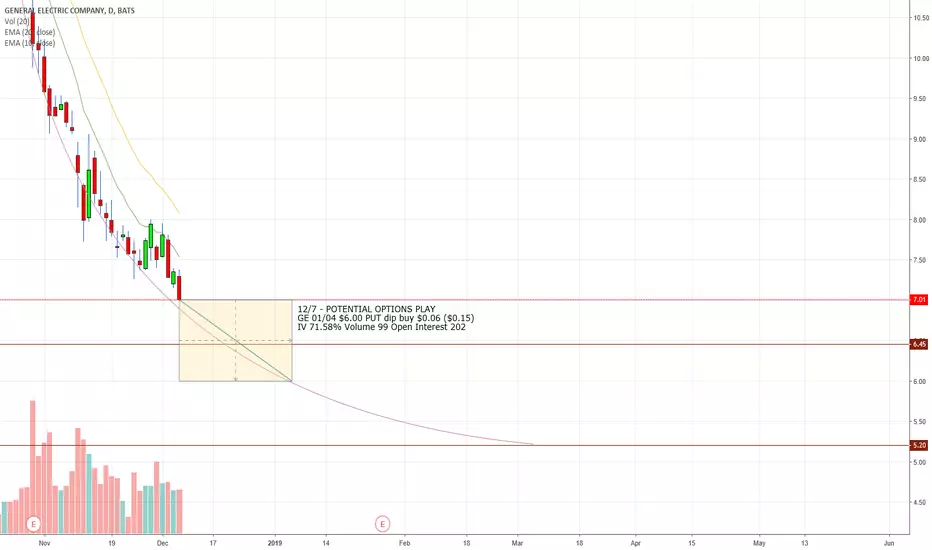
GE No Floor in SightTrade Timeframe - 12/10 - Jan 04
12/7 - POTENTIAL OPTIONS PLAY
GE 01/04 $6.00 PUT dip buy $0.06 ($0.15)
IV 71.58% Volume 99 Open Interest 202
Why?
Regarding the dip buy - There is opportunity to get this option at a discount due to mid-day movement and slight optimism as we saw nov 28 - dec 3, but then the option fell back into profit PUT levels. Idea is to "set it and forget it" for the dip buy. $6.45 is the next realistic floor. News also is negative in general.
MACD - Already crested north in the last several days, and is now on the verge to move south
EFI - Momentum has shifted dramatically, and its movement is turning south, showing pessimism
RSI - Although this is an oversold stock, there is nothing in the near future to hold up the RSI
EMA - There is nothing that shows a reversal, and resulting Volume is consistently in "Sell" mode
*Let's see what happens!*
*DISCLAIMER* - I am not a professional trader or stock broker. These are merely my thoughts typed out. If you need professional help with your trades, look elsewhere, not here. Good luck and happy trading.
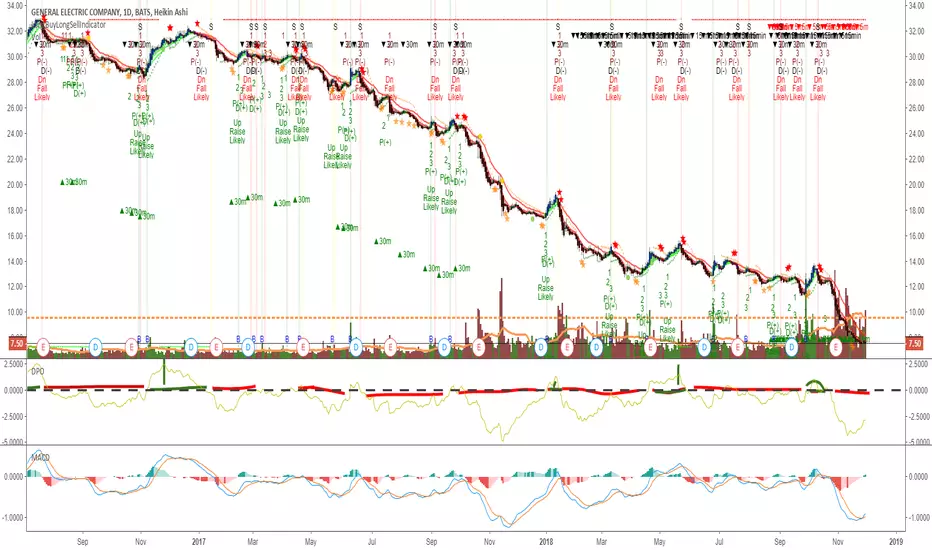
GE - MACD vs DPOHere DPO shows where money is made much more simply than MACD for General Electric.
Let's say not showing an entry point using DPO on 1 day chart.
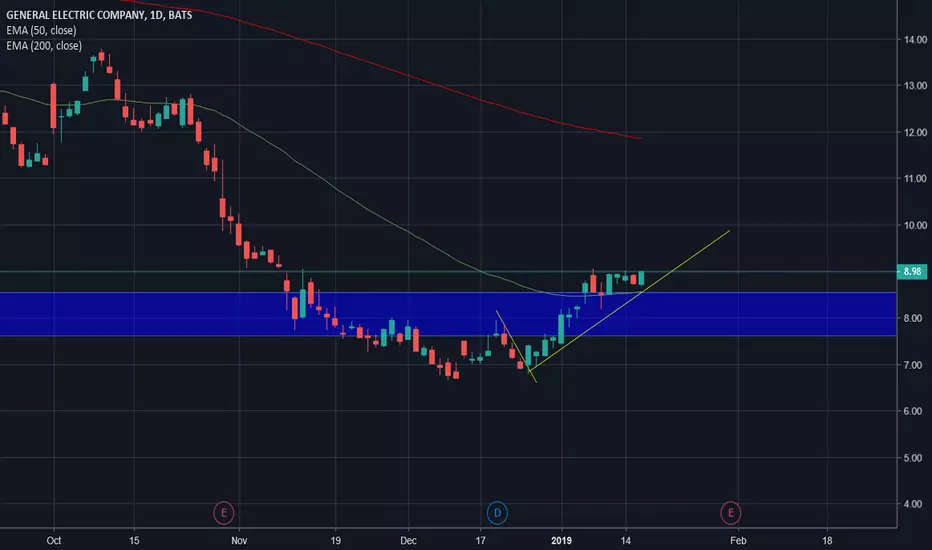
GE HIT LOWS, NOW IS THE TIME TO GO LONGI really think that the bashing of GE is now over, the last time this stock was at these lows was in 2008 which was a blood bath, and 1984, as much as cash flow issues as they have had, the new CEO has a lot of work a head of himself. Here is the reality, and Investment in GE Is an investment in America, and say what you want about the tariffs, the trade war, the FEDS raising their rates, we are strong. GE will move back, only a short time.
SPX Crucial support at 28.62If this doesn't hold, say bye bye to a positive EOY. In my opinion, with the exponential gains of the #FANGS, GE downfall, trade frustrations, etc etc, it is a great time to short this right here. Pick your poison. GE short has done well for me so far, but don't fall in love with one chart and not see greater potential. AMZN and NFLX primed for disaster, among others. Mid caps fall faster than large caps in a downturn, generally. Keep that in mind. Happy shorting.
FB AMZN NFLX GOOG

This indicator SAVED YOU HUGE on GEBuy Green
Sell Red
//
it's mainly for swing trading, i use the 3 day / 15 day / monthly charts with it and it works perfectly,
//
it works good for stocks and cryptocurrency.
//
you will use heiken ashi chart style and turn on the EMA DOTS indicator.
once the indicator is on you will hide the heiken ashi so you only see the dots.
//
when a green dot -0.78% -6.68% -7.44% -7.44% appears you buy, if a green dot -0.78% -6.68% -7.44% -7.44% appears after that green dot -0.78% -6.68% -7.44% -7.44% you hold your investment.
if a red dot appears you sell your position. easy as that.
//
the standard dots setting will be set to 10 - use this for any chart above 3 days
change the dots setting to 6 for 3day charts and below
//
shorter time frames will be choppy.
//
larger time frames will be smooth.
//
*Daytrading smaller timeframes is possible but not recommended.

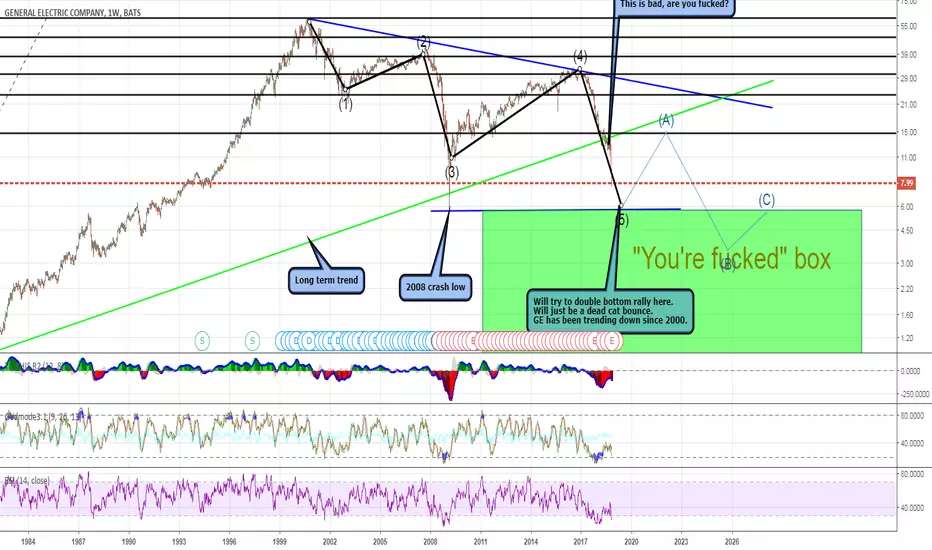
GE looks fucked to meGE is pretty fucked. Broke the long term trend line this summer. Has been tanking ever since. So long GE, it's been nice knowing you.
I might buy some in the $5.76 to $6 range to take advantage of the "double bottom" false rally. Expect to sell the rally at $12-14.
SL is the you're fucked box. Stop loss @ $5.60 (assuming you buy at or under $6.
Then will continue trend down to bankruptcy.
OPENING: GE JAN 18TH 9 SHORT STRADDLESelling bullishly skewed premium in the beaten down GE with the possibility of an assignment of shares with a cost basis of 7.33/share (a 9.5% discount over current price). Filed for a 1.67/contract credit.
Metrics:
Max Profit: $167/contract
Max Loss/Buying Power Effect (On Margin): Undefined/$171/contract
Break Evens: 7.33/10.67
Delta: 23.23
Theta: 1.09
Notes: Fairly rare to get a credit approaching your buying power effect ... .

GE bearsshort term bearish, if it breaks under 6.50 itll be in free fall. for now im seeing it bounce off those levels and retrace to previouse POC
Bullish Divergence Transforms to Near End to Oversold ConditionsAT40 = 17.3% of stocks are trading above their respective 40-day moving averages (DMAs) – 10th day of oversold period following 4-day oversold period
AT200 = 29.5% of stocks are trading above their respective 200DMAs
VIX = 23.4
Short-term Trading Call: bullish
Commentary
The small bullish divergence to start the week received follow-through in the form of a big rally day in the stock market. AT40 (T2108), the percentage of stocks trading above their respective 40-day moving averages (DMAs), jumped from 11.9% to 17.3%. Suddenly, it looks possible for the stock market to bring an end this week to this extremely extended oversold period (AT40 above 20%). AT200 (T2107), the percentage of stocks trading above their respective 200DMAs, came to life by hopping from 25.4% to 29.5%. AT200 even slightly broke through its steep downtrend.
{AT40 (T2108) surged from the lows to the oversold threshold.}
{AT200 (T2107) bounced enough to sneak a peak above its relentless October downtrend.}
So far, the S&P 500 (SPY) is down 4.5% for this 10-day old oversold period. The index is down 3.7% from the start of the first oversold period which is only separated from the current period by one trading day. If the oversold period had ended today, the S&P 500’s performance would have been in-line with historic 14-day long oversold periods and under-performed historic 10-day oversold periods. In both cases projections are for less weakness.
{The performance of the S&P 500 for a given oversold duration (T2108 below 20%).}
In other words, there is a decent case to be made that the breakout from this oversold period will come with another big rally day for the S&P 500. It will need to be a big move to break out of the current steep downward trading channel formed by the lower Bollinger Bands (BBs).
{The S&P 500 (SPY) rallied for a 1.6% gain that perfectly matched the previous day's open and close lower.}
The NASDAQ gained the same percentage as the S&P 500 but its range of motion was not nearly enough to nullify the previous day’s fade and selling. The Invesco QQQ Trust (QQQ) gained 1.7% but also failed to nullify the previous day’s pressure.
{The NASDAQ rallied for a 1.6% gain but still sits well within the downward trading channel formed by the lower Bollinger Bands (BBs).}
{The Invesco QQQ Trust (QQQ) rallied 1.7% but still sits within a steep downward trading channel.}
The volatility index, the VIX, only fell 5.5% and closed at 23.4. It is still at elevated levels (above 20) so the stock market remains very vulnerable to wide swings and sharp selling, but at least the intraday high did not reach the recent highs.
The iShares Russell 2000 ETF (IWM) rallied for a 2.1% gain. Unlike the other major indices, IWM managed to tap the upper bound of its downward trading channel. IWM hugged this line in the selling that led to the current levels. Follow-through buying would represent a very important breakout.
{The iShares Russell 2000 ETF (IWM) is making another attempt to break out from its downward trading channel former by its lower Bollinger Bands.}
Although I did not get the volatility spike I wanted to trigger more aggressiveness, I still treated the rally as a validation of the bullish signs from the previous day. I focused on my shopping list even as I took my profits on my latest tranche of SPY call options (expiring Friday). I loaded up on CSX Corporation (CSX) calls, a calendar call spread on Intel (INTC), and of course I implemented my Facebook (FB) pre-earnings trade (twice!). I also decided to get aggressive with small caps given the abundance of beaten up small caps I saw with big gains on the day. I started accumulating call options on IWM expiring in 2 1/2 weeks. I capped off my hedges with a put spread on Boeing (BA) which rallied right to its 200DMA and an obligatory put option on Caterpillar (CAT). From here, I can stay 100% focused on the bullish buying opportunities…while of course keeping in my peripheral vision the on-going (technical) market risks that I have covered in previous Above the 40 posts.

weekly GE chartbuy under $9 bucks... the low to hi fib retrace from 2002 to 2007 has the 1.618 retrace line at $8.50 bottoming out in March of 2009

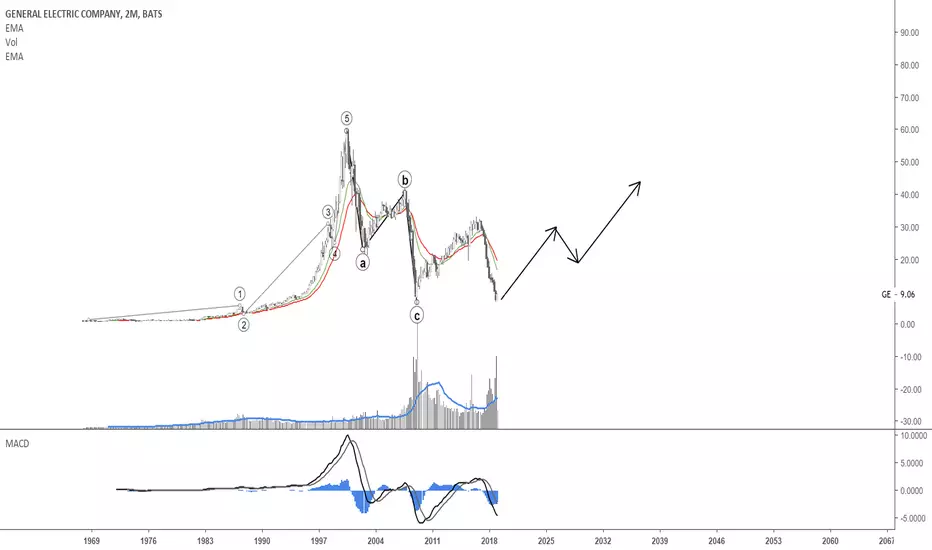
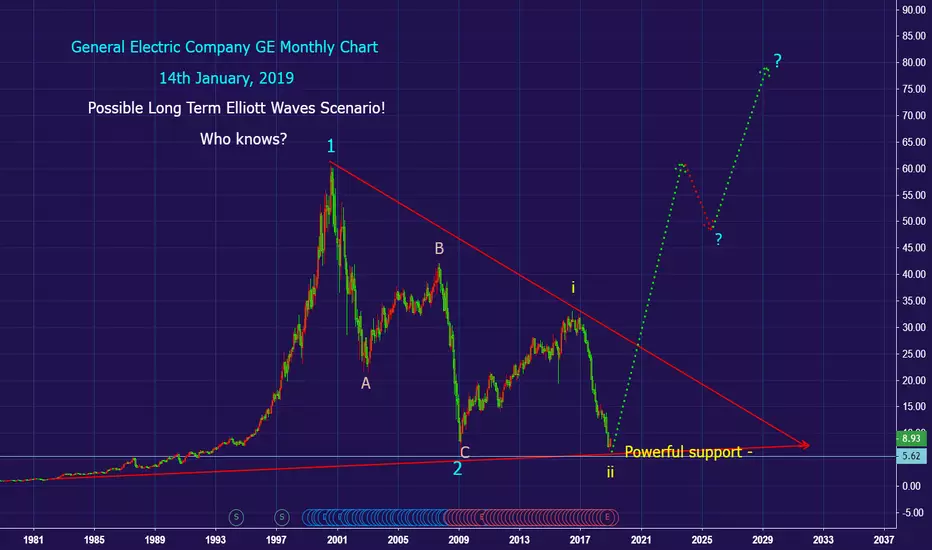
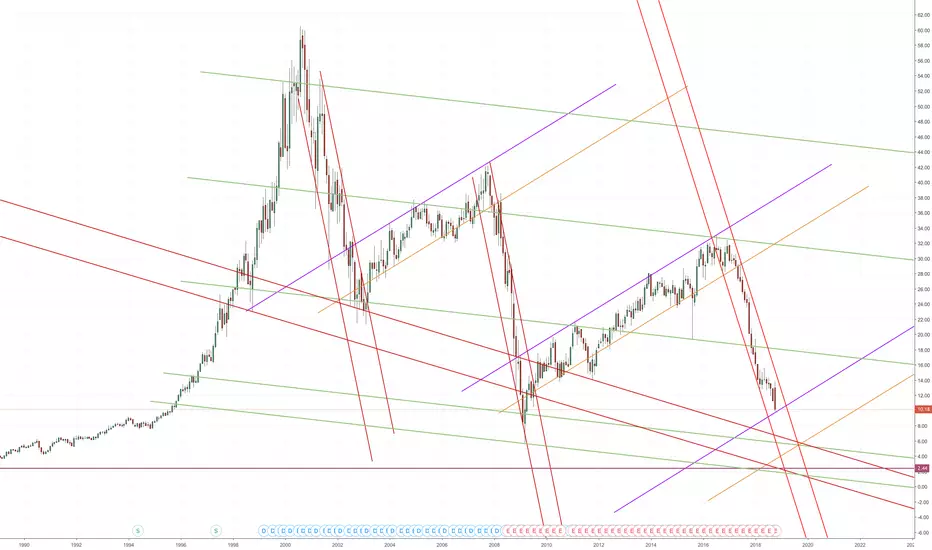
GE is ultimately dropping to 2.4 or lower-5.7 is our next targetif we follow the pattern, the drop in 2000 was 70% and in 09 85%. i expect it to drop 92.5% from the peak of 32 dollar in 2019
GE - POTENTIAL BREAKOUT AND RETESTGE has broken the last 5 waves pattern and it's now retesting the breakout level. Look to the price action for a potential wave up. A strong breakdown under the E point invalidates this setup.

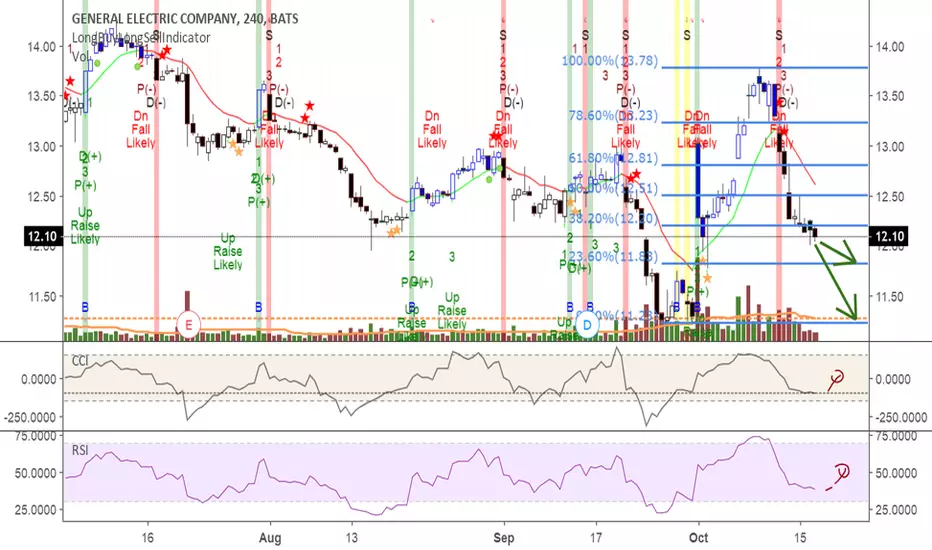
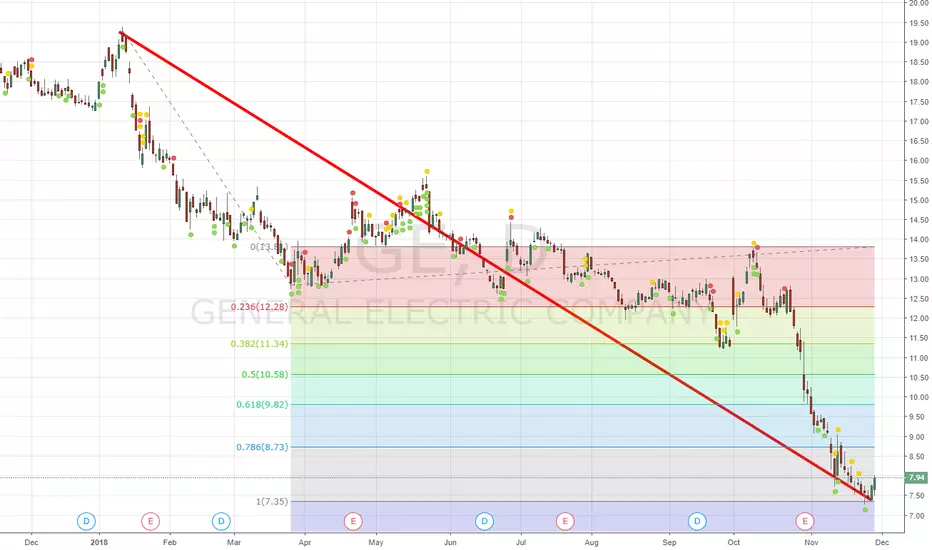
GE retracing to below $12With current market GE stock is volatile at best, resistance likely at 11.88 and could retrace to 11.22 area if volatility increases. New CEO has yet to make any significant announcement, although just the announcement caused a nice bounce, which vaporized last week and into this week. Any LONG buyers, wait, wait, and follow the volume. Setting alerts (targets) using warnings. Aka 12.0, 11.90, and 11.50, which would then indicate going full Fibretracement or possibly larger selloff and below recent resistance in 11.25 and 11.20 range.
Viewers: Come to own conclusions, Rule #1 and Rule #2. Market is very dynamic , so riding a big wave too far onto sandy beach if not too careful.