GE: Bottom's in!$GE was kicked out of the DJIA, this is a massively bullish contrarian signal. It is very clear we have seen the bottom here. With the new CEO shaking things up already, the only problem in sight is the mountains of debt the company has. Definitely worth a punt, given the huge reward to risk ratio here. You may try a tight stop, with small risk in the trade if brave, playing with out of the money call options, or some other variant of trade to gain long exposure here for the long term and as a swing trade.
Best of luck!
Ivan Labrie.
GE

Bottom nearing11.21 is the floor for this stock to watch, inflation adjusted.
The false breakout of 2009 shall be observed for those geeky.

WBA replaces to GE on Dow Jones 30Walgreens WBA replaces to General Electric GE on Dow Jones Industrial Average.

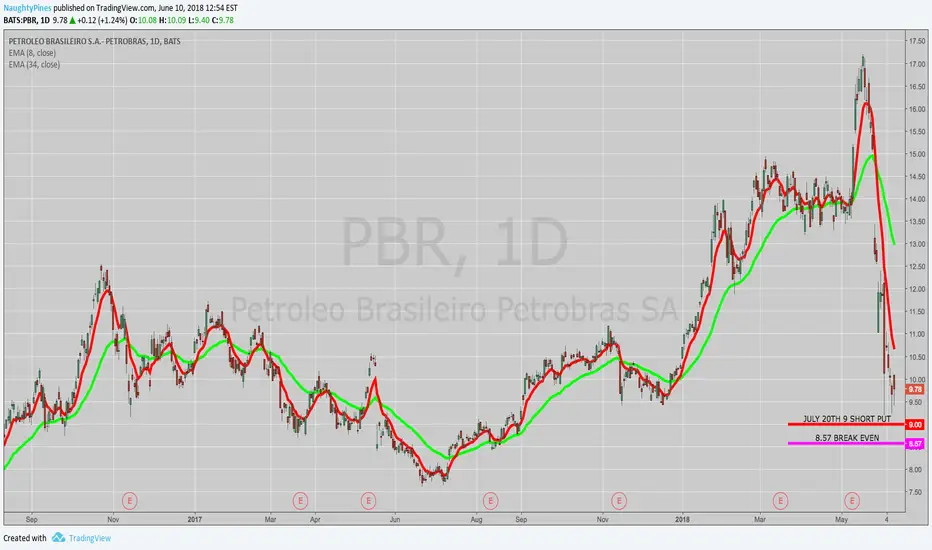
THE WEEK AHEAD: PBR, USO, GE, T, ORCL, EWZWith various things Brazilian in implosion mode, it's no surprise that PBR and EWZ have high implied volatility here.
PBR:
Bullish Assumption Setups: The July 20th 30 delta 9 put is paying .43/contract, resulting in an 8.57 break even, which isn't very compelling, but might appeal to some smaller account holders who are willing to hold the short put until near worthless and or roll for duration/further cost basis reduction should the worst not be over (check out the weekly). The natural alternative is a synthetic covered call with the short put at the 70 delta 11 strike, which pays 1.55, and gives you a 9.55 break even. I would work the synthetic as a "money, take, run" affair and look to take profit at 50% max or sooner.
Neutral Assumption Setups: The July 20th 10 short straddle pays 1.56 at the mid, with break evens at 8.44 and 11.56. Generally, I look to take profit on these at 25% (here, .39), but would naturally be prepared for a bumpy ride and to make adjustments as things unfold.
USO: I generally don't like this instrument a ton as a petro play due to its size, with my preferred go-to's being XOP, XLE, and (when in a pinch), OIH. However, if you're willing to go a little larger than you usually would with contracts, it can be productive. The July 20th 13 short straddle pays .93/contract and is skewed quite short delta wise (-20.93). To neutralize some of that, I could see doing a July 27th "double straddle" with one straddle at the 13 and one at the 13.5 (you need to move to the weeklies to get the half strikes). That would pay 2.01 per contract, give you break evens at 12.25 and 14.25, and reduce the directionality to -9.67 delta. Taking profit on the whole shebang at 25% max (.50) wouldn't be horrible.
GE and T: Both have earnings around the July monthly; I'd hold off putting on plays, opting instead to play for vol contraction around earnings ... .
ORCL: Announces in 9 days, so sit on your hands and play the announcement.
EWZ: With underlyings under $50, I've been short straddling or iron flying. The July 20th 34 short straddle pays 3.09, with break evens at 30.91 and 37.09. Naturally, that isn't for everyone, since short straddles and iron flies generally skew out delta-wise fairly immediately, so they're not "nervous nellie" trades or trades for the "delta anal"; for those kids, the July 20th 31/37 short strangle camped out around the 20 delta strikes might make more sense; it's paying .98.
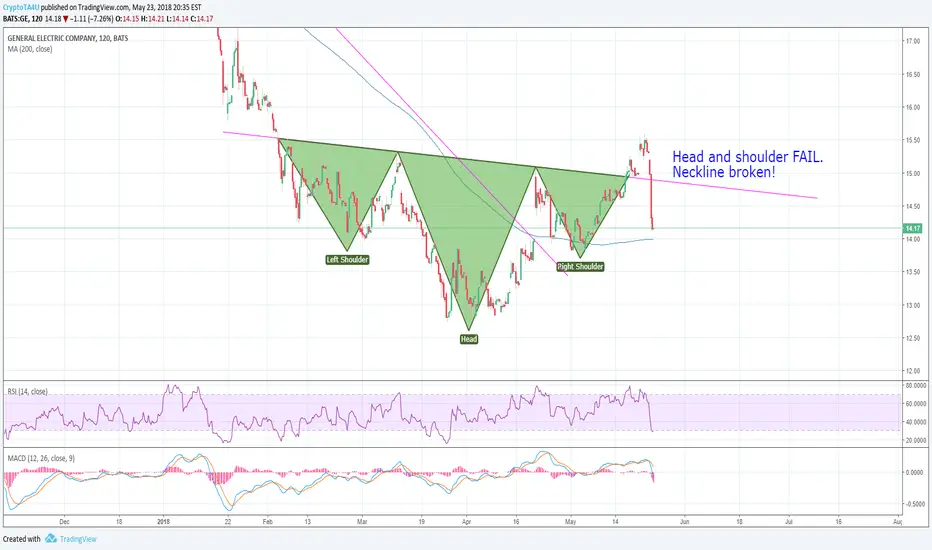
GE: Head and shoulder--FAIL!Well, I was about ready to enter a position on GE if it could successfully bounce off the neckline.
Glad I did not enter a trade, as it would have been a fail!
Important to be patient at times with these trades, particularly when you are going against a strong trend.
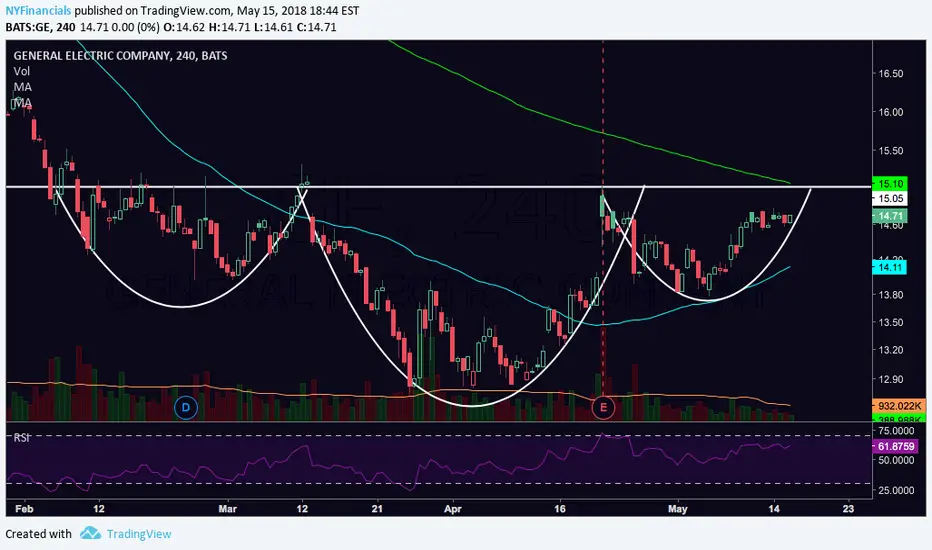
GE bottom head and shouldersGE looks to be near completion of a bottom head and shoulders pattern. looking for a breakout above the neckline and volume.

[GE] Is It Time For General Electric Bulls to Return?Noticed a Inverse Head and Shoulders pattern looking formation here.
The 50 and 200 MAs also looking to converge around the neckline on 4-hr chart.
The neckline at $15 seems to be important, it has held support after a sharp bounce from the lows in the '08-'09 crisis.
If it can't hold above the neckline, some serious selling could occur unless fundamentals change.
Don't have much fundamental basis for a bull view, though. We'll have to wait and see the next ER!
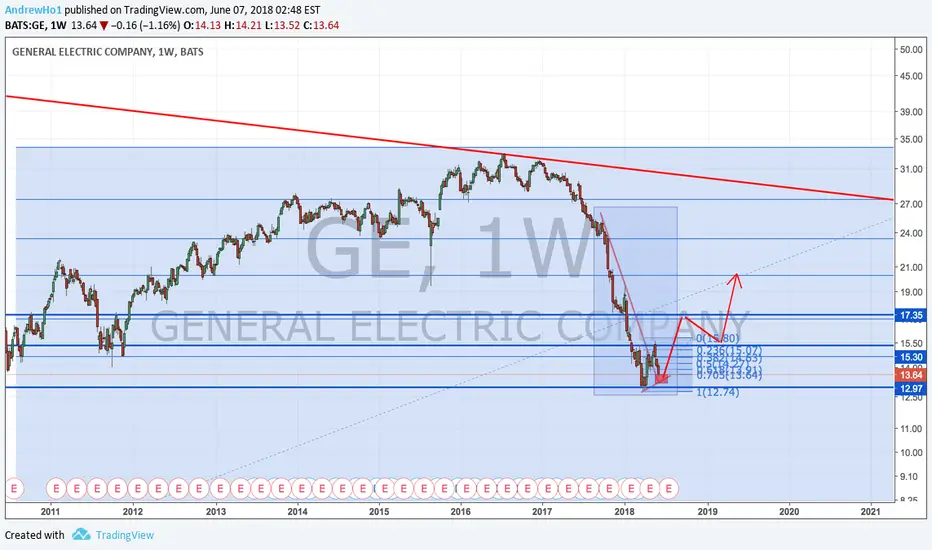
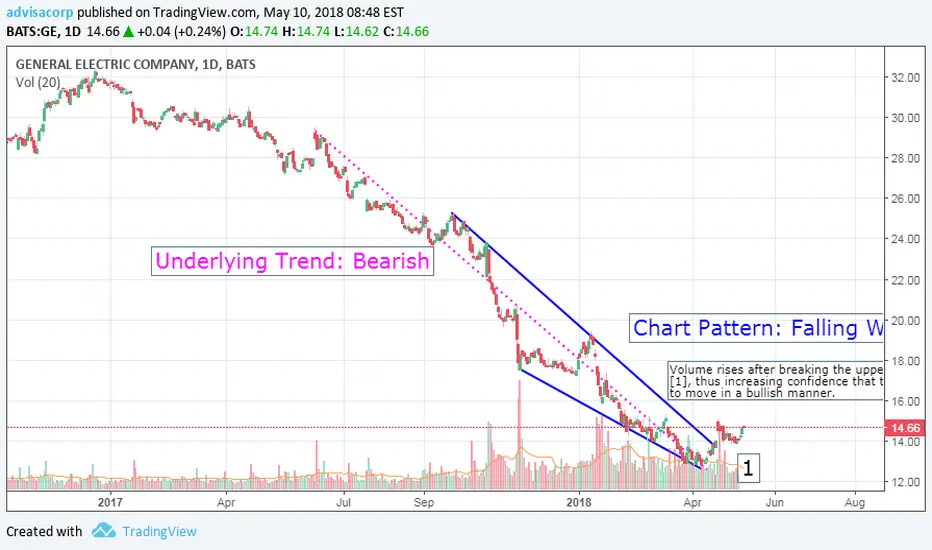
General_Electric_(NYSE:GE)_May_10_2018GE one of the finest companies representing Americal instrutrial prowess and technological marvel. However, in the last 52 weeks, the company's performance has be too poor to garner any positive mention. The bearish sentiment resulted primarily from GE Capital and GE Power. On the other hand, GE still has many crown jewels such as GE Aviation, GE HealthCare.
My analysis indicates, the worst may be over for GE and as long as the management avoids short sighted decisions (that may boost profit now but will hurt outlook later). I think in the near term the price is expected to climb towards the $15-18 range. Long term however, I see GE as a $25+ stock. Although, the dividend has been cut and the cash flow does not look great (along with an underfunded pension plan), GE does have the potential to climb back up into the SP500's top performers.
GE has always been an innovator. As long as that culture is imbued within the employees and managements takes steps to retain key employees, I see the outlook as very positive. The worst case scenario for GE would be another recession as the demand for industrial products can drop significantly leading to lower revenues. However, I think at this point, it is an excellent opportunity to buy into GE.
GOD SAVE THE GENERAL ELECTRICGOD SAVE THE GENERAL ELECTRIC
This chart since 1968 it looks sad and hard to consider for any portfolio, but even depleted assets have value!
Learn how to beat the market as Professional Trader with an ex-insider!
Have a good Trading Week!
Cream Live Trading, Best Regards!

GE - Fallen angel formation Long, $15 January 2019 Calls - $1.08GE Starting to look good again! However got to be careful with how much you risk due to earnings upcoming. $15 January 2019 Calls - $1.08
* Trade Criteria *
Date First Found- April , 2018
Pattern/Why- Fallen angel pattern
Entry Criteria- $15 January 2019 Calls - $1.08
Exit Criteria- Momentum
Stop Loss Criteria- N/A
Indicator Notes- Twiggs money flow accumulation
Special Note- Big insider buying in November
Please check back for Trade updates. (Note: Trade update is little delayed here.)

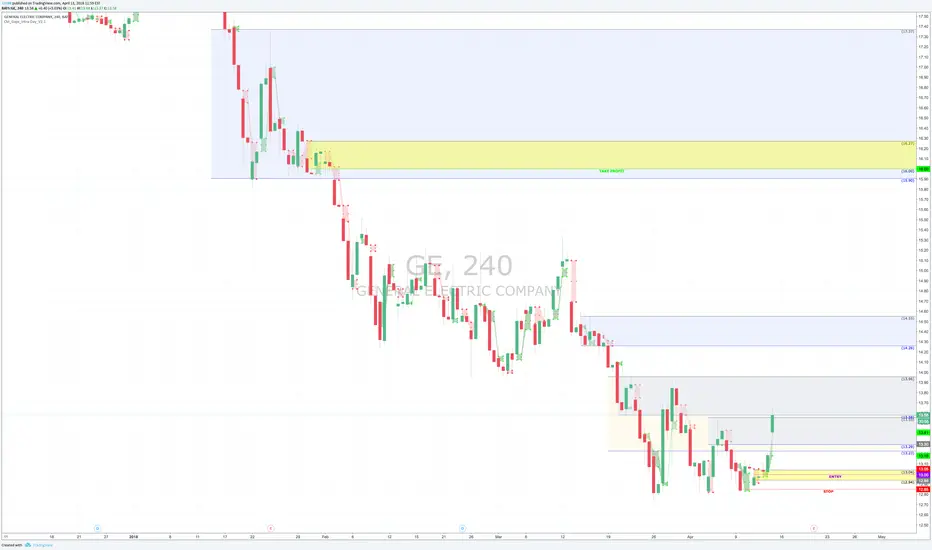
GE : BUYNYSE:GE
TRADE PARAMETERS
Pick Date : 04/13/18
Entry : 13.00
Stop : 12.85
Target : 16.00
TRADE STRATEGY
Income Type : Swing
ENTRY
13.00 is a fresh 4H demand zone RbR speculating a daily trend reversal. Will be doing a set and forget limit order. One can enter in the zone at 13.04 just use risk management and position size accordingly with the suggested stop. Price will need to have a strong move into the zone.
STOP
12.85 is $0.15 right outside of the low for some protection.
TARGET
16.00 is 3.00 higher in a fresh daily supply zone with a 4H supply nested.

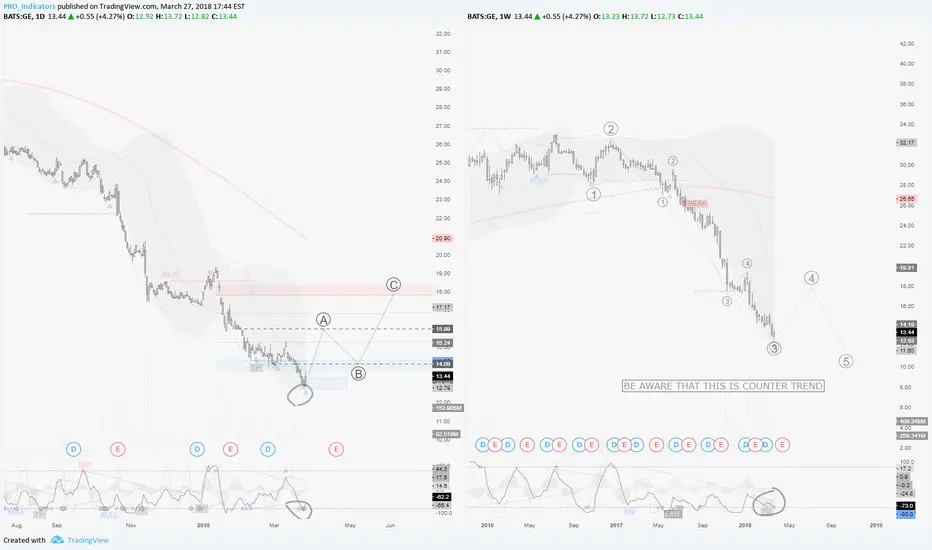
GE / D1-W1 : This one could be oversold and interesting to buyHope this idea will inspire some of you !
If you want to see my chart more closely, click the share button below that video.. You will be able to have access to the chart used in that video.
Don't forget to hit the like/follow button if you feel like this post deserves it ;)
Indicators used in this forecast are PRO Sinewave BETA & PRO Momentum .
You can check my indicators via my TradingView's Profile : @PRO_Indicators
Kindly,
Phil
If you want to learn more about the basic rules to trade with my indicators here's the educational video link :
GE- Finally will be going up
Today I will be covering GE. As you can see there is strong dpo and MACD bullish divergence. This is a good sign for a start of an uptrend. In addition it seems to have finished the C wave having a strong bounce today. In addition both indicators look like they are forming a nice triangle pattern and they seems ready to explode out of it. This explosion will bring a nice uptrend and leave GE at 18.31. The only thing that may stop GE forming finally gaining some momentum is a big stock market correction which is very possible.

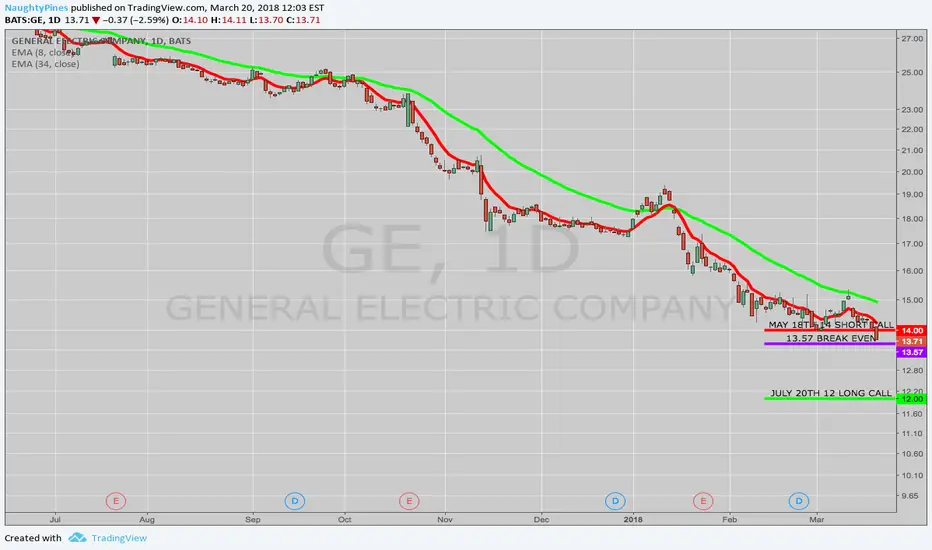
OPENING: JULY 20TH 12 LONG/MAY 18TH 14 SHORT CALL... for a 1.57/contract.
Taking a miniature directional shot here as an engagement trade while I wait for the May expiry to come into the "sweet spot."
Max Profit: .43/contract
Max Loss: 1.57/contract
Break Even: 13.57
Take Profit: 20% of max/.31 per contract
GE - Haven't done enough to turn it aroundTo keep it short and sweet: GE has been bearish since the beginning of 2017, and it doesn't seem they've done enough to turn it around. Yesterday's low was the lowest since 2009. If nothing substantial is done, we can potentially see the price drop to $10 by end of the year.

TRADE IDEA: GE JULY 20TH 13 LONG/MAY 18TH 15 SHORT CALLThis is a neutral to bullish assumption "skip month" call diagonal that very nearly approaches the metrics of a "proper" Poor Man's Covered Call where the credit received for the short call is equal to or greater than the extrinsic in the long option, the break even on setup is at or below where the stock is trading, and where the price paid is less than 75% of the width of the spread.
Currently, the setup is bid 1.33/mid 1.40/ask 1.47. Spot sits at 14.31 with a mid price fill yielding a break even of 14.40 (.09 above where the underlying is trading), a potential max profit (assuming no rolls) of .60/contract, and a price/spread width ratio of 70%.
Alternatively, you can widen the setup to a 12/15 to relieve yourself of additional extrinsic in the long such that the credit received on the short call end of the stick exceeds what's in the long. The 12/15's currently bid 2.15/mid 2.20/ask 2.25, a mid price fill would yield a break even of 14.20 (.11 below where the stock is trading), a max profit of .80, and a price/spread width ratio of 73.3%.
I'd look to take profit at 20% of what you put these setups on for, which would yield a .28 profit for the 13/15 (20% ROC), .44 for the 12/15 (20% ROC), keeping in mind that earnings come out in 35 ... .
Notes: We're kind of in between where the April monthly is too near in time and the May monthly -- too far out -- for setups, but I'm willing to roll the dice on a cheap setup on the notion that there might be some speculative bullish interest in this beaten down stock running into earnings, particularly since it's trundled down further from where it was a few weeks ago on an analyst downgrade. Neither setup requires a particularly huge amount of upward movement, particularly if you're shooting for 20% versus max profit (which would basically require a finish above the 15 shortie).

OPENING: GE JULY 20TH 13 LONG/APRIL 20TH 15 SHORT CALL DIAGONAL... for a 1.55/contract debit.
Another directional shot with a small "hurt" factor and plenty of time to reduce cost basis ... .

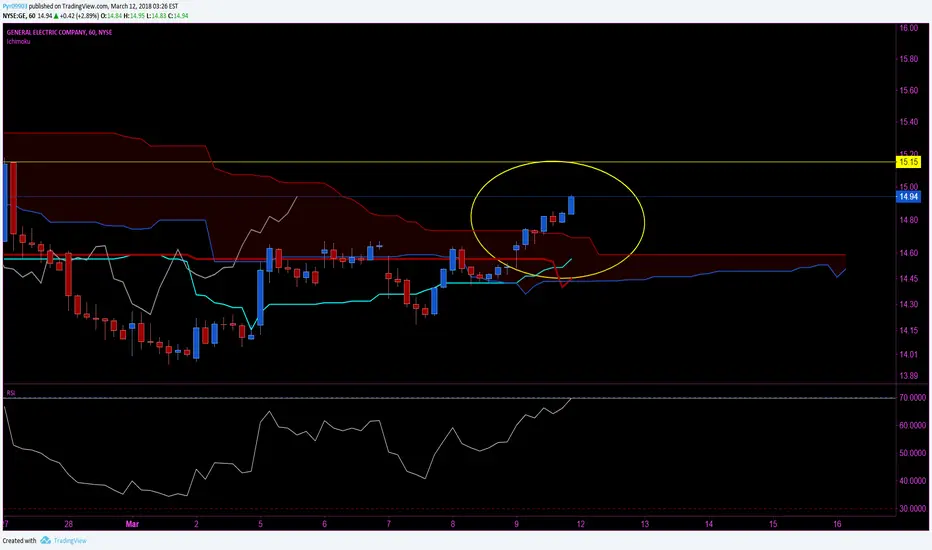
GE Ichimoku Quick Long Nice breakout from the cloud. If breaks yellow line, it should continue upward. Might be able to ride this one up to about $15.65 and take profit.
Only sharing my setups for education.
Please only risk what you are willing to lose FOREVER!
Good luck!

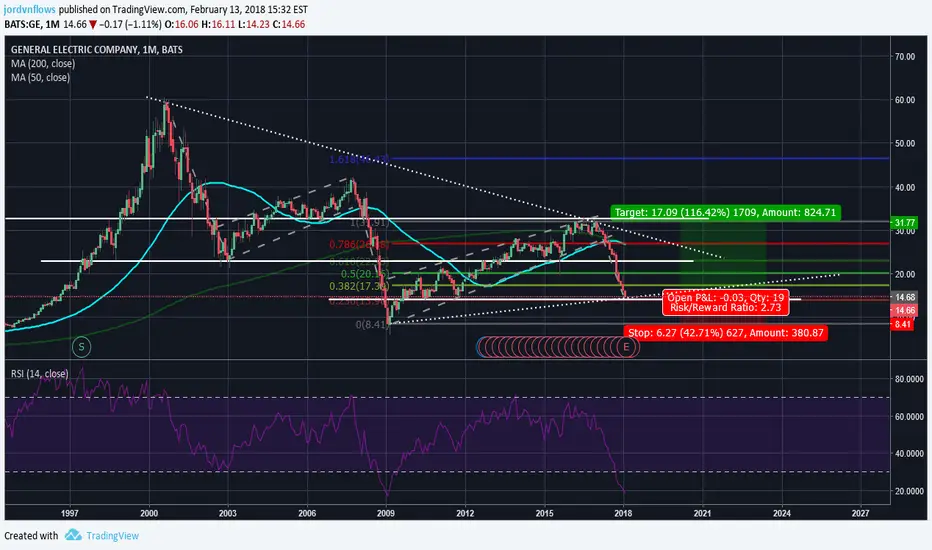
GE digging potentialGE is showing mediocre resistance at the 23% retracement. Eh, nothing special right? Up until you notice the RSI posing as a huge indicator for a long opportunity.
We haven't seen any levels like this in about 9 years, and over the course of 9 years, it showed a growth of approximately 279%. Now what does that mean? For one, it doesn't mean the investment is secure; that isn't until we get a confirmation within these next two weeks. The retracement is being used as a tool , within the retracement we can see a strong line of resistance at $22.86 (50% retracement), and $32.02 (100% retracement).
Essentially the major resistance areas would still mark an approximate 110% profit @ 50%, and 250% profit @ full retracement.
OPENING: GE MARCH 16TH 16 SHORT PUT... for a 1.66/contract credit.
Metrics:
Probability of Profit: 49%
Max Profit: 1.66 ($166/contract)
Max Loss: 14.34 (which equals the cost basis in any stock I'm assigned)
Break Even: 14.34
Notes: Put on at the 70 delta strike, this is a synthetic covered call with a buying power effect that is far smaller (~20% of the max loss or $246/contract) as compared to a straight up covered call where you'd buy 100 shares at 14.58 for $1458 and then sell, for example, the March 23rd 30 delta short call at 15.5 for a piddly .35, resulting in a cost of 14.23 ($1423) to put on, so one of the pluses to this strategy is lower buying power effect.
Granted, having the shares themselves entitles you to the divvies (the yield is currently 3.32%), and you won't get those with a naked short.
However, some frown on covered calls as being "capped out" in terms of profit. While that can be partly addressed through rolling the short calls for strike improvement/cost basis reduction, the synthetic is more flexible, since the short put can be rolled up as price moves toward it and over it if that's what you want to do with the play (which is basically continually reduce cost basis in potential assigned shares "up front", after which you'd then proceed to cover via short call).
Here, however, I'm looking to take profit at 50% max or .83 ($83)/contract, so I don't necessarily need price to break the short put completely ... .
