Buy Zone Hi guys. I hope you're having a good weekend. I already have. Here's another high volume stock meekly brought to your attention by Illusions Catcher. I'll post again soon.
GE

GE long opportunity (Updated)Updated chart of my recent GE chart. Added a long term TL break and currently retesting at 61.8%.
GE: An issue of Trust - is it safe yet?GE
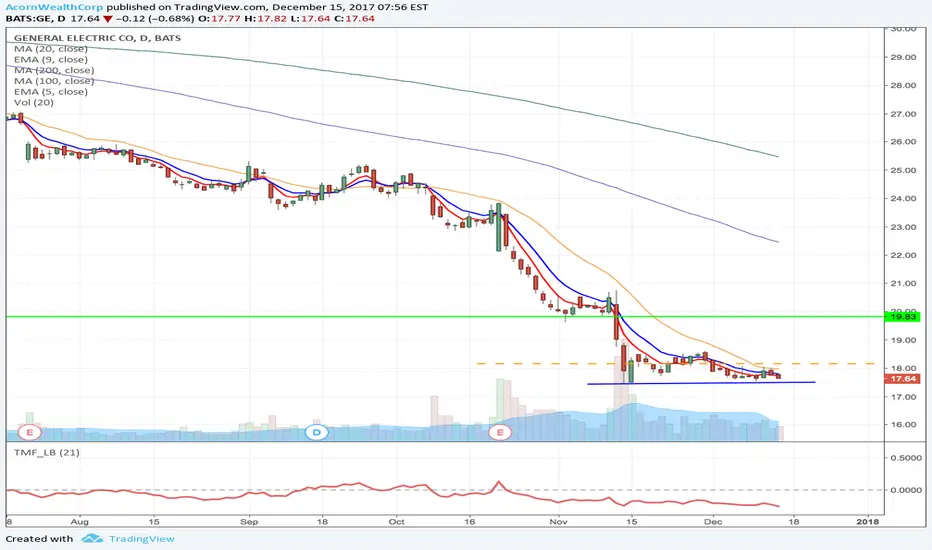
Will 2018 be the year GE starts to get better? Who can say and
who can be believed anyway? The chart. It walks while CEO's talk.
GE has pretty much turned dead since the traumas of the Fall.
It's been moving in a very controilled trader-friendly way with
4 perfect hits on the 18.04 line and three on the 17.59 line
before it gave way, falling to new low at 17.36 but finding
buyers since and now trying to break above a fairly minor
trend line from the most recent peak at 17.52 now.
It's likely to get a few buy recommendations for potential
recovery from a few brokers in their New Year's tips sheets
but will need to find enough to push it back above 17.59 and
then hold above here on retests. That would be the first
bullish sign from GE for many a moon - and should be
encouragement enough for other buyers to join in and push
price back up to 18.04 - where it becomes ... a sell again
most likely. All this price action we see on the chart over a
two month period is the equivalent (or fractal) of two hours'
price action on Bitcoin.

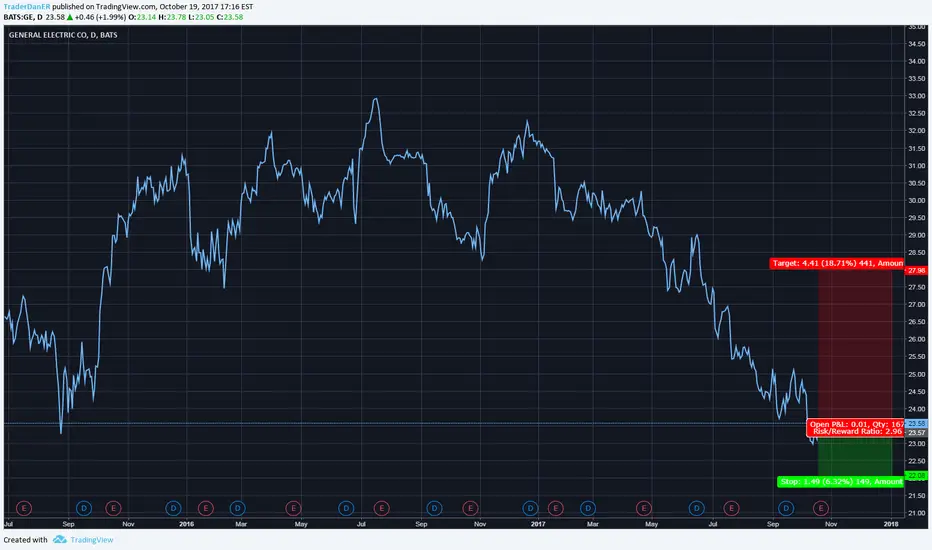
GE - Long from Support `t $18.16 to $19.83GE had a huge decline from $32 to $17 label. However it seems getting some support here, and it had a huge insider buying recently on this label.
We think if it can break above its MA lines, it has good potential to jump to $20 area easily. ne from $32 to $17 label. However it seems getting some support here, and it had a huge insider buying recently on this label.
* Trade Criteria *
Date First Found- December 13, 2017
Pattern/Why- Long from Support
Entry Target Criteria- Break of $18.16
Exit Target Criteria- $19.83 & higher (Longer term Hold)
Stop Loss Criteria- N/A
Indicator Notes- Testing a long term support
Special Note- Huge insider buying recently
Please check back for Trade updates. (Note: Trade update is little delayed here.)
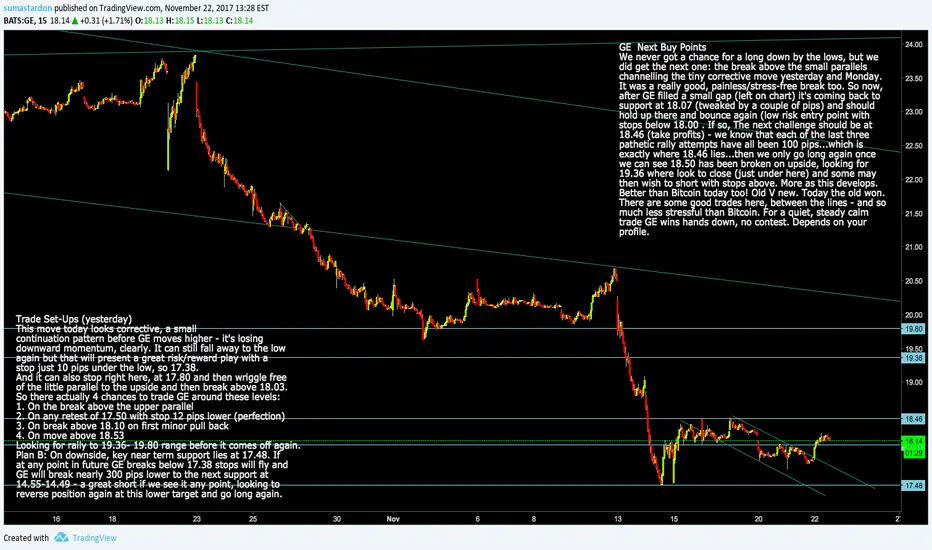
GE: Next buy points for counter-rallyGE Next Buy Points
We never got a chance for a long down by the lows, but we
did get the next one: the break above the small parallels
channelling the tiny corrective move yesterday and Monday.
It was a really good, painless/stress-free break too. So now,
after GE filled a small gap (left on chart) it's coming back to
support at 18.07 (tweaked by a couple of pips) and should
hold up there and bounce again (low risk entry point with
stops below 18.00 . If so, The next challenge should be at
18.46 (take profits) - we know that each of the last three
pathetic rally attempts have all been 100 pips...which is
exactly where 18.46 lies...then we only go long again once
we can see 18.50 has been broken on upside, looking for
19.36 where look to close (just under here) and some may
then wish to short with stops above. More as this develops.
Better than Bitcoin today too! Old V new. Today the old won.
There are some good trades here, between the lines - and so
much less stressful than Bitcoin. For a quiet, steady calm
trade GE wins hands down, no contest. Depends on your
profile.
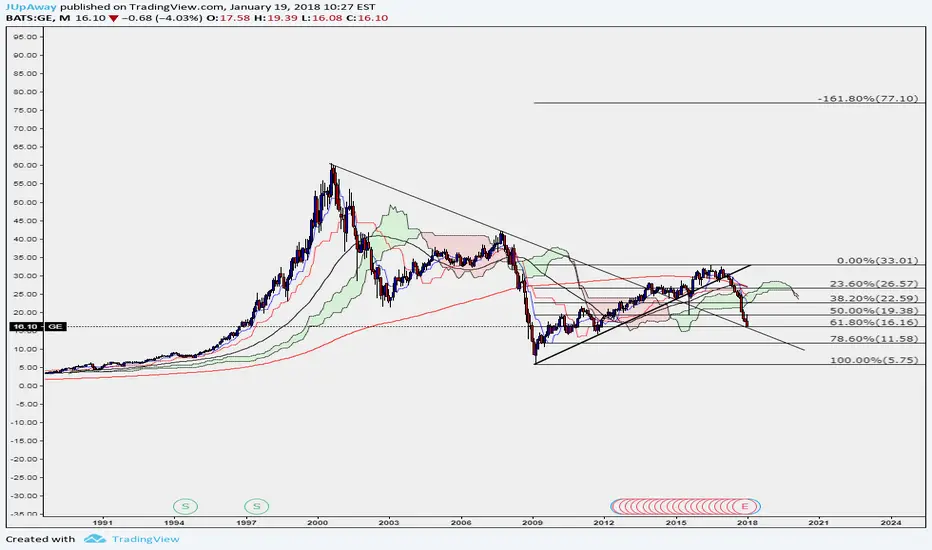
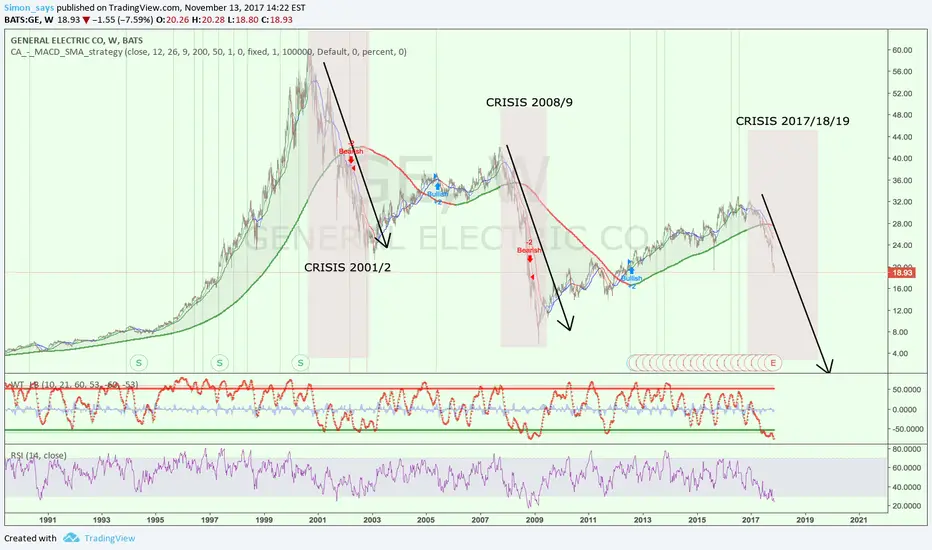
GE: CSI Wall Street: Charts V Fundamentals - Truth V BeliefGE Nature of the Beast
GE is a 3/6 stock - it builds in multiples of 3 and 6: 60 all time high, 6 crash low to 33 post crash high. Last cycle high
42. This year's big numbers are 33, 27, a massive break at 24 (last kiss at 23.82) followed by a $6 straight fall to 18 where it
languishes now after a low for the year at 17.48. It really likes these numbers, as is plain to see to anyone who cares to
examine the charts, long term and short. These numbers hide in plain sight. It's a beautiful, faithful stock - in some ways as
beautiful as Bitcoin, except for bears, ever since it hit the top parallel back in mid 2016.
Each of the last three rally attempts have all been 100 pips before GE crashes lower still. Price has memory, in that when
a large corrective pattern such as this is eventually broken, price accelerates, the brakes/parallels have failed, and it will
seek support from old structure lows and highs from the past - just as GE is doing now. It's therefore likely to make a final
low at one of two spots: Where it is now at 18.00-17.48 - or 300 pips lower at 14.50. The fact that it has only been able to
rally 100 pips again from 17.48 is not a good sign but it cannot be shorted unless 17.40 gives way at any point - in which
case it's a worthwhile sell back to 14.55 where it then becomes a buy again with stops 20 points lower, requiring a complete
reversal at that point if 14.55 is then struck.
It's not much better than 50/50 here as things stand, with nothing for bulls to hang their hats on yet other than price
stopping at the only support left above 14.50. Some might prefer to stand back and watch to see if 17.40 gives way,
turning the odds from 50/50 to closer to 80-90% and looking to short here and buy back from 14.55 and get long again.
That would be so much clearer and simpler and looks very likely given a little more time.
For GE to show that the low is here, at 18.05 -17.48 it has to hold up at 17.48 on any retest Tuesday and rally at least 120
pips from 17.48 and then use 18.05 as support on any subsequent pull-back. It should then attract more buyers up
to 19.39 where it's likely to fall away again.

General Electrics - weeklyLong term forecast for General Electrics/GE.
Please watch this video:
"My investment in GE is 'one of the biggest mistakes of my career'"
www.cnbc.com
Share prices of GE are correlated with global stock market crashes.
It means we just entered a phase of a global economic meltdown.
In short-term I expect price to move up then down however, in long term GE is going to 0$ or close to 0$.
Bottom of the financial crisis will be reached in ~2019.
Have a nice life :)
GE long ideaGE has been tanking like a rock, removing demand along the way and creating supply zones in their place. The parabolic drop in prices suggests that buy orders are sitting under current price.
From supply and demand perspective 17.27 looks interesting as we have a drop base rally demand zone sitting right under current price which could yield a nice area of reversal if price continues its parabolic drop.

Next support zone is near 15-16$Breaking and closing below the 200 MA line has been lethal to GE
Now this stock is approaching an interesting support zone near 15-16$
Testing of broken trend line, structure and the 61.8 Fib

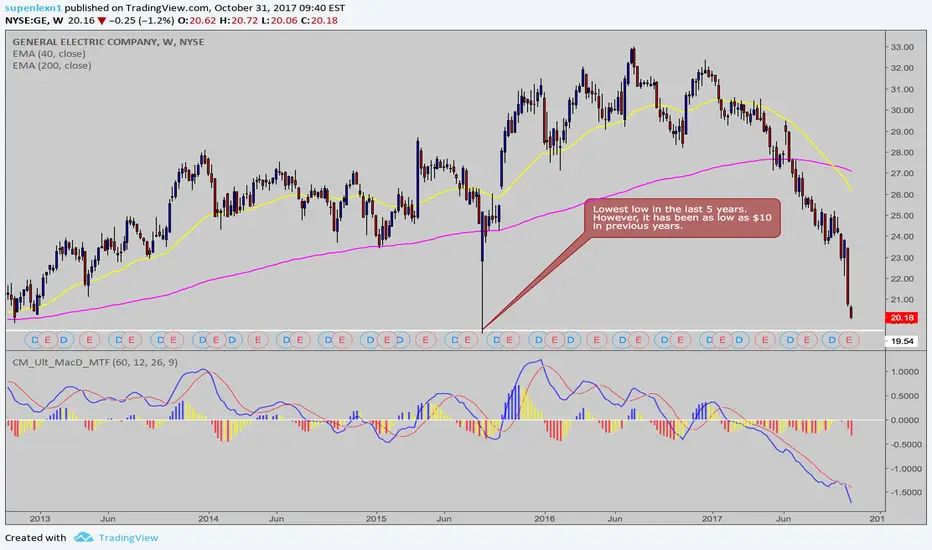
GE - Approaching 5 Year LowsGE is approaching 5 year lows.
It is still not time to buy as price is still falling to lower lows.
Many people look to buy quick bounces. However, notice the 2008 low for GE on this chart was just below $6.
This has great potential for being the biggest Dog of the Dow for 2018.
All the best!
Seth Gregory
General Electric - Dog Of The Dow For 2018The 'Dogs of the DOW' is a trading strategy that is commonly known and looked for. The best candidate for the 'Dogs of the DOW' for 2018 is GE. It has continued to fall as the DJIA has continued to climb.
This is not a strategy to just jump into. Watch the trendline for validation that price is looking to change direction.
All the best!
GE - Monthly chart - LONG I believe the new CEO John Flannery with pursue with the GE digital initiated by Jeff Immelt. GE is an old and traditional Engineering manufacturer but not driving crazy in the internet era where companies like Google, Facebook, Yahoo, Amazon, etc are taking the most advantage of Internet. In theory, GE wants to become digital because of the larger profit margin and lower cost.
A typical profit margin for most businesses at GE is 30%, while being digital makes your profit bigger of up to 70% without any headache dealing with Manufacturing, custom, procurement, labor, energy, etc.
This is how I see GE stock for the next 10 years.

October 20 Earnings: General Electric - Higher Industrial OutputShares of General Electric have come under pressure in the last year due to management's uncertain theme regarding the company's future after GE Capital spin-off.
The spin-off aided the company's focus on its core industrial business providing core products and services to fast growing industries.
Following higher industrial output numbers and an overall increase in demand from the aerospace and military, GE should be turning around.
Strong demand for its software and its focus on Internet solutions should boost margins in the coming years.
I believe General Electric will cruise through this quarter, however guidance will remain shifty.
I'm starting General Electric with a $28.00 PT for the post-earnings move with a tight stop at $22.00
THE WEEK AHEAD: GE, CSX, PYPL EARNINGS; MBI, PEARNINGS
GE announces earnings on 10/20 (Friday) before market open. With a background implied volatility in high 20's (28% as of Friday close), it isn't particularly high from a premium selling standpoint, but I could see this as a potential acquisition opportunity via a November 17th 22 short put (paying .32 at the mid), in spite of the fact that the company's being a decent dividend bearing play is waning. Alternatively, the November 17th 22 short straddle pays 1.37 at the mid. Going pure volatility contraction play closer in time doesn't pay all that much, with the October 27th 22 short straddle brining in short of 1.00 at the mid.
CSX announces on Tuesday before market open. Background implied volatility's in the mid-30's which places it in the upper fourth percentile of where it's been over the past year. The October 27th 51/55 short strangle's paying 1.24 at the mid, with the comparable defined risk iron condor at 48/51/55/58 paying .92.
PYPL, with a background implied around 30 goes on 10/19 (Thursday) after market close, with the Oct 27th 65.5/71.5 short strangle paying 1.55, and the delta neutral 62.5/65.5/71.5/74 iron condor in the same expiry paying .95.
NON-EARNINGS
MBI, with a background implied of 66 (at the very high end of its range), probably only makes sense as a short put/acquire/cover cycle trade, with the November 17th 6 short put paying .35 at the mid and the 7 paying .76. The former would yield a cost basis of 5.65 on assignment; the latter, 6.24.
P has a background implied of 67 (mid-range over the past year), with the December 1st 7 short put paying .27 (cost basis of 6.73 if assigned) and the at-the-money 8 paying .66 (7.34 cost basis on assignment).
VIX/VIX DERIVATIVE TRADES
Currently, no term structure or contango drift trades are in the offing. The first VIX future trading at >16 is way out in May, and the VIX/VXST ratio finished Friday's session at around .84.

GE buy the dipsGeneral Electric retraced to support around 27-28$ and technically looks ready for a new impulse up.
First target - 33$

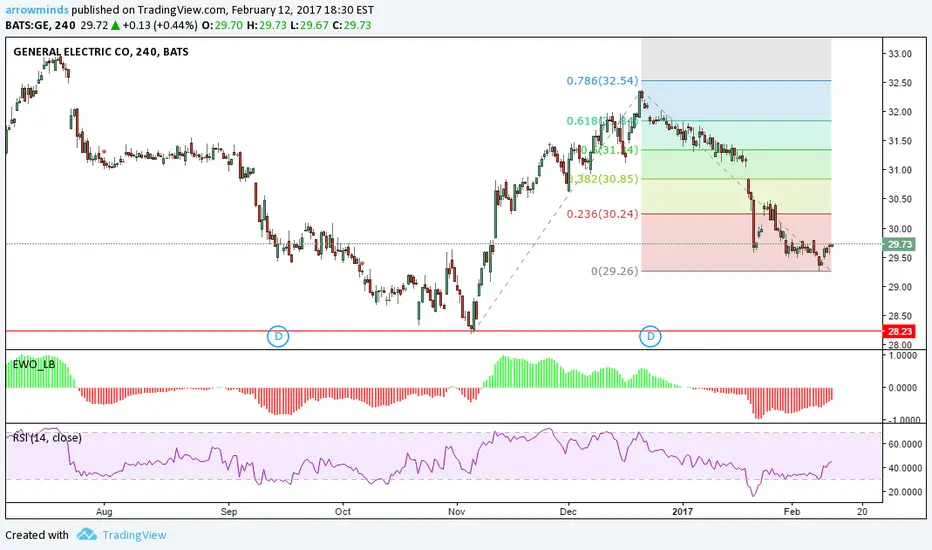
Buy GEBuy @29.73 with SL:28.0 and TP:34 or Open
H4: Wav2 was approx 78%. Hence wave 3 is in progress.
This stock meets technical and fundamental news of the stock and can surge at any time.
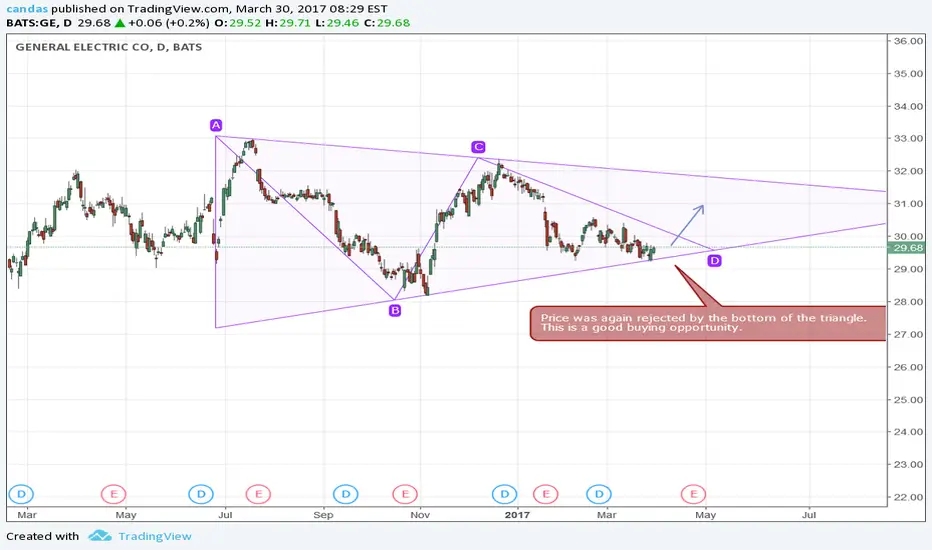
GE might be forming a base @29 areaGE might be forming a base around the ys1 area of 29.
a double/triple bottom might be in place.
looking for an upside action to get long.
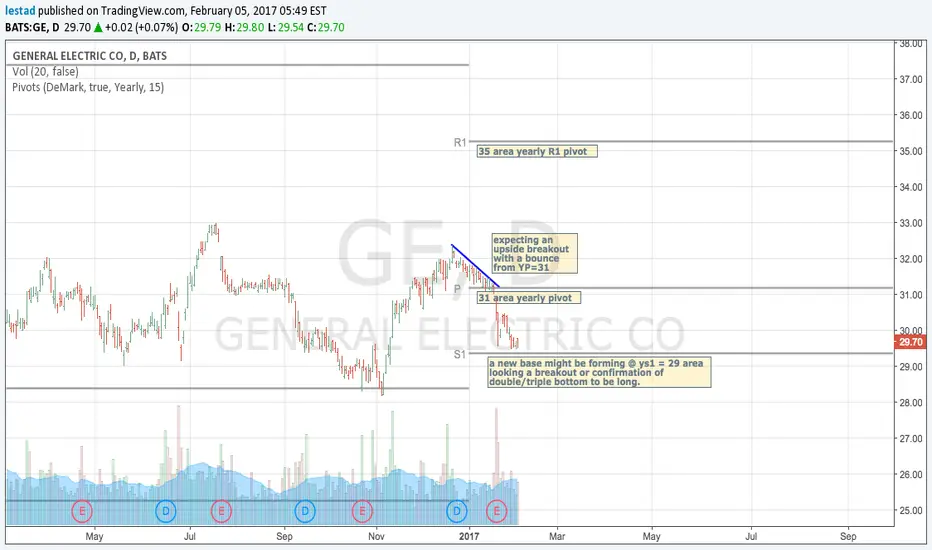
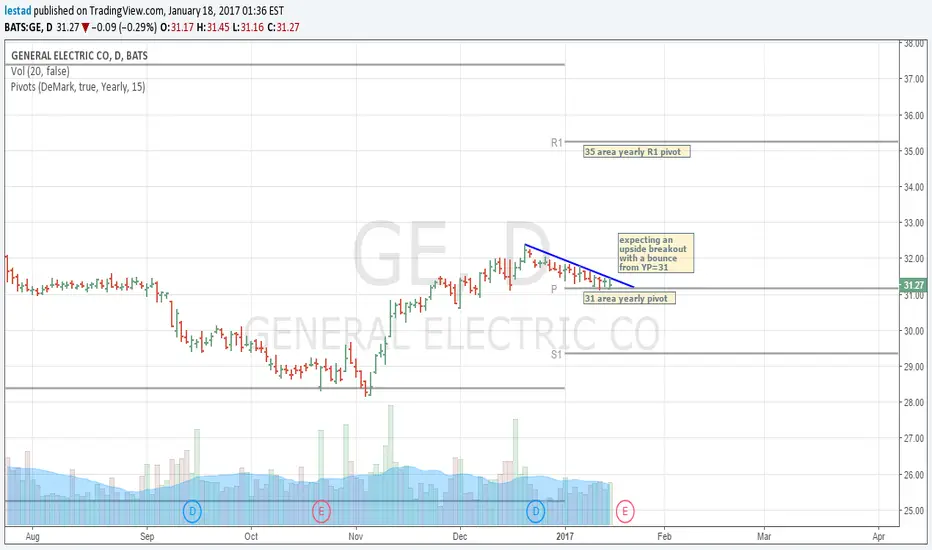
ge - general electricI'm long the 31 February calls of GE, I do have the positive expectancy that the stock will bounce from the Yearly Pivot of 31 area, and move 35 area.
we'll see in the upcoming days if the 31 pivot point will hold and an upside breakout will occur.
anybody following this idea, should place stops on the 30-31 area.