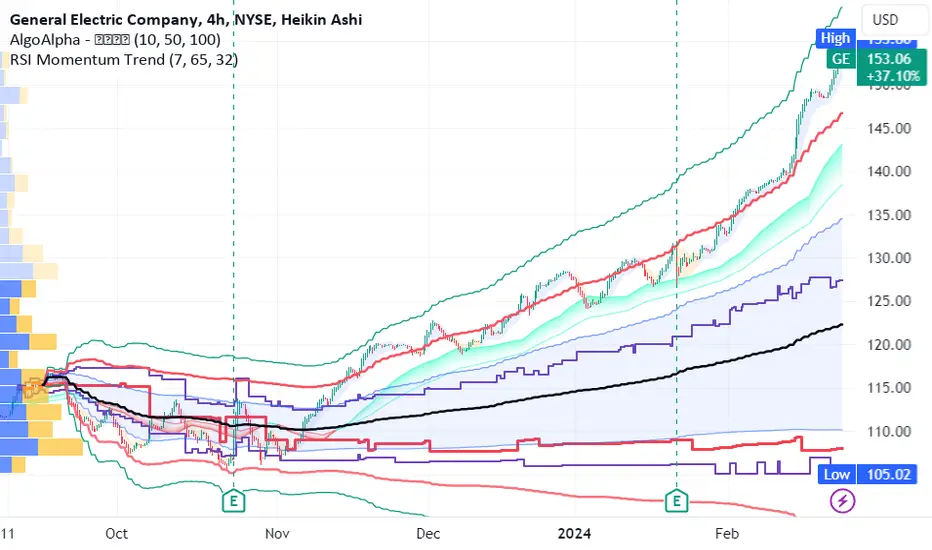
GE has a solid ongoing trend higher LONGGE on a 240 minute chart shows an anchored VWAP and volume profile both anchored back into
October and a price action breakout beginning after the November earnings report and
sustained through the early February earnings report. Both reports showed significant beats
on earnings as well as good beats on revenue. I see GE as a solid long term long swing trade
into at least the next earnings in about ten weeks. Another approach aside investing is
a long term call option more than one year out to capture the tax advantage of the long- term
capital gains tax rate. I will zoom into a 30 minute time frame and go long with the best
entry of a pivot low.
GE
GE Buy the Pullback ( Flip the switch) now LONG I previously published the idea of shorting GE. It has now pulled back more than 4%
on the retreacement. The short idea paid well using put options to profit from the
pump of earnings expectations. Earnings were great but the run up was too much for
traders. GE has now retreated and is ready for a long entry. Price is now in the
undervalued range of both the short and intermediate term VWAP bands.
The target is $99.99which is basically the price immediately before the earnings report.
Confirmation is tbe zero lag MACD where the K/D lines crossed under the histogram and are heading
together to cross over the zero line while the histogram flipped from negative to positive.
Call options in the money expiring 5/5 are considered.

"GE Stock Faces Retracement to $80-$90 Range"Navigating GE Stock: Market Overview and Potential Retracement
General Electric (GE) stock, a stalwart of the industrial sector, is currently under scrutiny as investors assess its performance amidst changing market conditions. With the recent push-up from 2020 to 2024 showing signs of exhaustion, GE may be poised for a retracement to the $80-$90 range. This retracement could test the micro upward trend while remaining within a massive downward range channel, presenting key support and resistance levels for strategic buying and selling opportunities. However, if GE fails to hold the $80-$90 price range, it could signal a continuation of the downward trend, potentially leading to another significant drop.
Understanding GE Stock
GE is a multinational conglomerate with interests spanning across various industries, including aviation, healthcare, renewable energy, and more. As one of the oldest and most well-known companies in the United States, GE has a storied history of innovation and resilience. However, in recent years, the company has faced challenges, including restructuring efforts, asset divestitures, and changes in leadership, which have impacted its stock performance.
Current Market Conditions
In the midst of ongoing market volatility and economic uncertainty, GE stock has been subject to fluctuations driven by a combination of internal and external factors. While the recent push-up from 2020 to 2024 provided some relief for investors, signs of exhaustion have emerged, raising concerns about the sustainability of the uptrend. With the possibility of a retracement looming, investors are closely monitoring GE's price action for potential buying or selling opportunities.
Retracement Potential
The anticipated retracement to the $80-$90 range represents a critical juncture for GE stock. This price level not only serves as a test of the micro upward trend but also aligns with major support and resistance levels within the broader downward range channel. For investors, this presents an opportunity to capitalize on strategic entry or exit points, depending on their outlook for GE's future performance.
Key Buying and Selling Opportunities
Within the context of the retracement, key support and resistance levels provide valuable insights for investors seeking to capitalize on buying or selling opportunities. By identifying these levels and monitoring price action closely, investors can make informed decisions to maximize their returns while managing risk effectively.
Potential Downside Risk
While the retracement to the $80-$90 range offers potential buying opportunities, there remains a significant downside risk if GE fails to hold this price level. A breach of support could trigger a cascade of selling pressure, leading to another massive drop in GE stock. Investors should exercise caution and remain vigilant in monitoring GE's price action to mitigate potential losses.
Conclusion
In conclusion, GE stock is facing a pivotal moment as it navigates changing market conditions and the potential for a retracement to the $80-$90 range. While the recent push-up from 2020 to 2024 provided a glimmer of hope for investors, signs of exhaustion suggest caution is warranted. By carefully analyzing key support and resistance levels within the broader downward range channel, investors can position themselves strategically to capitalize on potential buying or selling opportunities while managing risk effectively in the face of uncertainty.

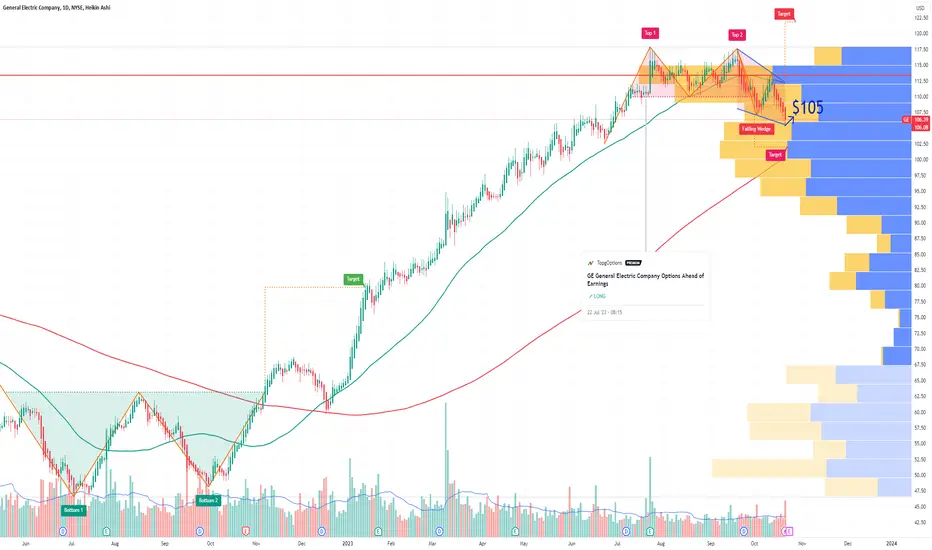
GE General Electric Company Options Ahead of EarningsIf you haven`t bought GE ahead of the previous earnings:
Then analyzing the options chain and the chart patterns of GE General Electric prior to the earnings report this week,
I would consider purchasing the 105usd strike price in the money Calls with
an expiration date of 2023-11-17,
for a premium of approximately $5.20.
If these options prove to be profitable prior to the earnings release, I would sell at least half of them.
Looking forward to read your opinion about it.
XLI could be on the verge of breaking down. A close above the neckline negates the bearish pattern.
If Weak ISM data continues you could see more weakness in this sector.
A pair trade I'm watching is Long GE / Short XLI

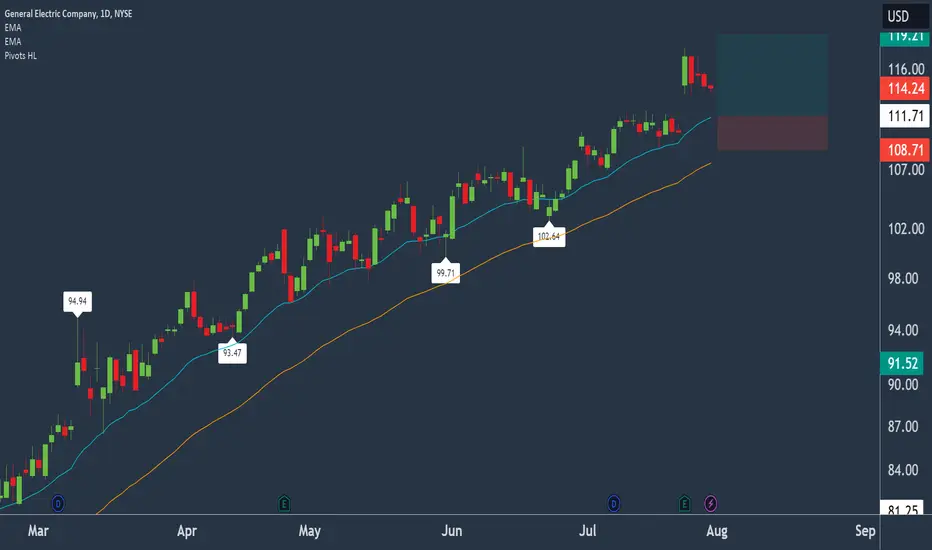
General Electric bouncing off 20-EMA.General Electric Company - 30d expiry - We look to Buy at 111.71 (stop at 108.71)
The primary trend remains bullish.
There is no clear indication that the upward move is coming to an end.
Intraday dips continue to attract buyers and there is no clear indication that this sequence for trading is coming to an end.
20 1day EMA is at 111.54.
We look to buy dips.
Previous resistance at 111 now becomes support.
Our profit targets will be 119.21 and 120.21
Resistance: 115.70 / 117.96 / 120.00
Support: 113.45 / 111.00 / 110.00
Please be advised that the information presented on TradingView is provided to Vantage (‘Vantage Global Limited’, ‘we’) by a third-party provider (‘Everest Fortune Group’). Please be reminded that you are solely responsible for the trading decisions on your account. There is a very high degree of risk involved in trading. Any information and/or content is intended entirely for research, educational and informational purposes only and does not constitute investment or consultation advice or investment strategy. The information is not tailored to the investment needs of any specific person and therefore does not involve a consideration of any of the investment objectives, financial situation or needs of any viewer that may receive it. Kindly also note that past performance is not a reliable indicator of future results. Actual results may differ materially from those anticipated in forward-looking or past performance statements. We assume no liability as to the accuracy or completeness of any of the information and/or content provided herein and the Company cannot be held responsible for any omission, mistake nor for any loss or damage including without limitation to any loss of profit which may arise from reliance on any information supplied by Everest Fortune Group.
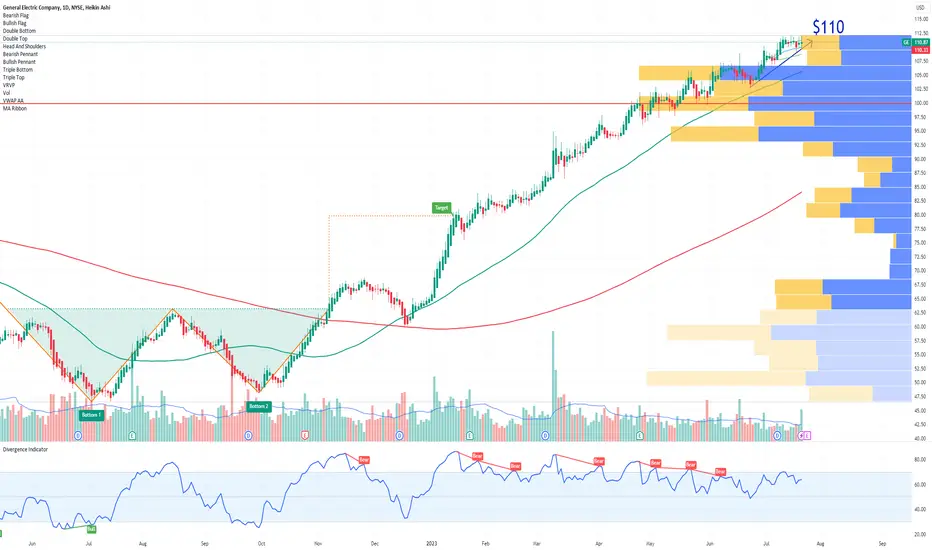
GE General Electric Company Options Ahead of EarningsAnalyzing the options chain and chart patterns of GE General Electric Company prior to the earnings report this week,
I would consider purchasing the 110usd strike price Calls with
an expiration date of 2023-8-18,
for a premium of approximately $3.85.
If these options prove to be profitable prior to the earnings release, I would sell at least half of them.
Looking forward to read your opinion about it.
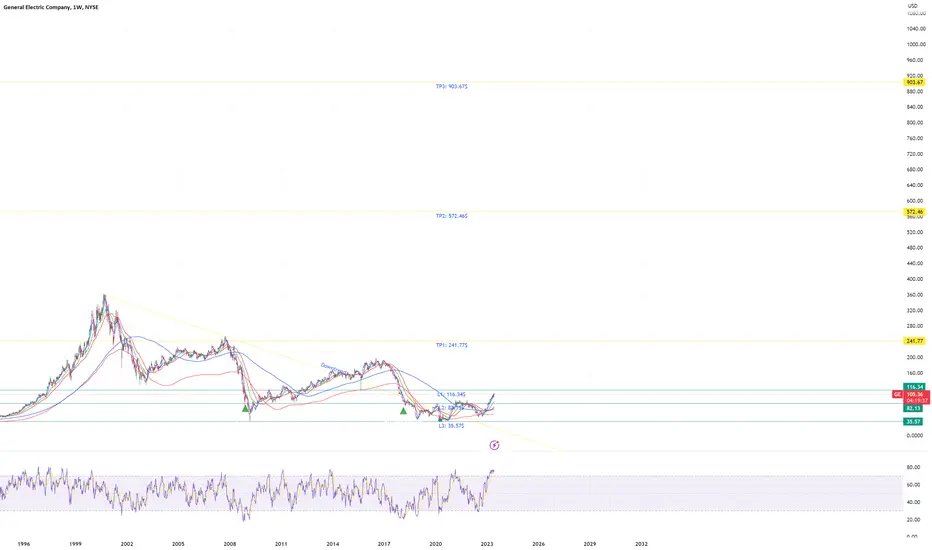
Levels of Interest $GETA levels of interest for NYSE:GE
Please note that this is a preliminary research paper and you should continue to do your own research (DYOR). Information about assets can change rapidly, and it's essential to stay updated with the most recent developments.
Notes on how I personally use my charts/NFA:
Each level L1-L3 and TP1-TP3 (Or S1-S3) has a deployment percentage. The idea is to flag these levels so I can buy 11% at L1 , 28% at L2 and if L3 deploy 61% of assigned dry powder. The same in reverse goes for TP. TP1: 61%, TP2:28% and TP3:11%. If chart pivots between TP's, in-between or in Between Sell levels these percentages are still respected. I like to use the trading range to accumulate by using this tactic.
Just my personal way of using this. This is not intended or made to constitute any financial advice.
This is not intended or made to constitute any financial advice.
FED Macro Situation Consideration:
All TP's are drawn within the context of a return to FED neutral policy. I do not expect these levels to be reached before tightening is over.
NOT INVESTMENT ADVICE
I am not a financial advisor.
The Content in this TradingView Idea is for informational purposes only, you should not construe any such information or other material as legal, tax, investment, financial, or other advice. Nothing contained within this idea constitutes a solicitation, recommendation, endorsement, or offer to buy or sell any securities or other financial instruments in this or in in any other jurisdiction in which such solicitation or offer would be unlawful under the securities laws of such jurisdiction.
All Content on this idea post is information of a general nature and does not address the circumstances of any particular individual or entity. Nothing in the idea/post constitutes professional and/or financial advice, nor does any information on the idea/post constitute a comprehensive or complete statement of the matters discussed or the law relating thereto. You alone assume the sole responsibility of evaluating the merits and risks associated with the use of any information or other Content on the idea/post before making any decisions based on such information.
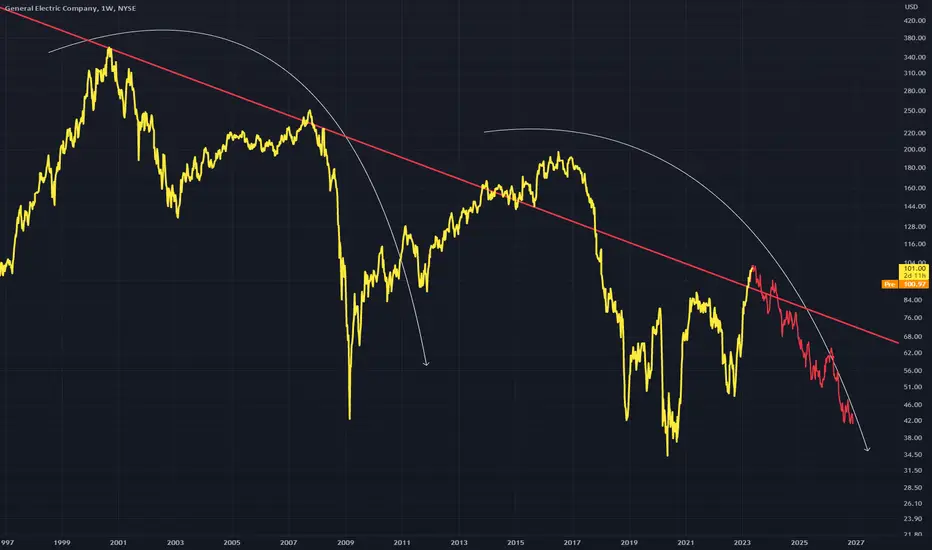
GE - Double Top Ideadown following a double top
Using curves to show the waves down
Long term bearish
GE reversing to down trend SHORTGE has been trending recently off a base of consolidation after a downtrend. In the last session,
the reversal began. The 15 minute charts shows price riding the upper bands of the anchored VWAP
in the overvalued and overbought zone. The support resistance indicator of Luxalgo shows that
price bounced down from the resistance zone. The stochastic RSI shows bearish divergence and
loss of strength. I see this an opportunity for a swing short trade which will be synergized if the
general market takes a downturn in the week upcoming. I will play this with put options with
10 DTE at a strike a few percent above market price and look for 50 % return in the 5-7 trading
days upcoming. I will sell a few days before expiration no matter to avoid time decay affecting
the potential profil.

GE Short? Someone tell me what's up with GE! Would love to see some opinions. Looks like a short to me.

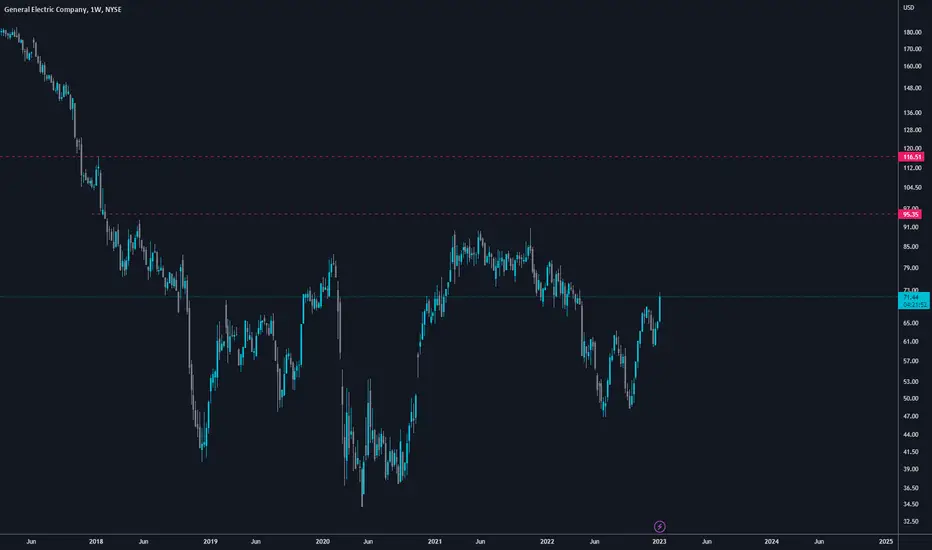
GE: Strength Ahead of Earnings ReportThis old company struggled to reinvent after the banking debacle destroyed its consumer financing division. Older companies CAN reinvent and start a new life.
I'm showing the Weekly Chart first so you can see the support zone below and the strong resistance above, where the stock may head sideways for a time.
Around $67 is the high of a completed short-term bottom that provides strong support for the current price action.
The stock entered the strong resistance level of the Trading Range highs of 2021 - 2022 with what I call a "pre-earnings" run.
On the daily chart:
GE had a strong momentum run ahead of its earnings report. This was a pre-earnings run, which tend to develop 2-4 weeks ahead of the earnings release. The company is reporting Tuesday this week.
The strong reversal candle on Friday after 2 down days is also an indication that the report will be good.

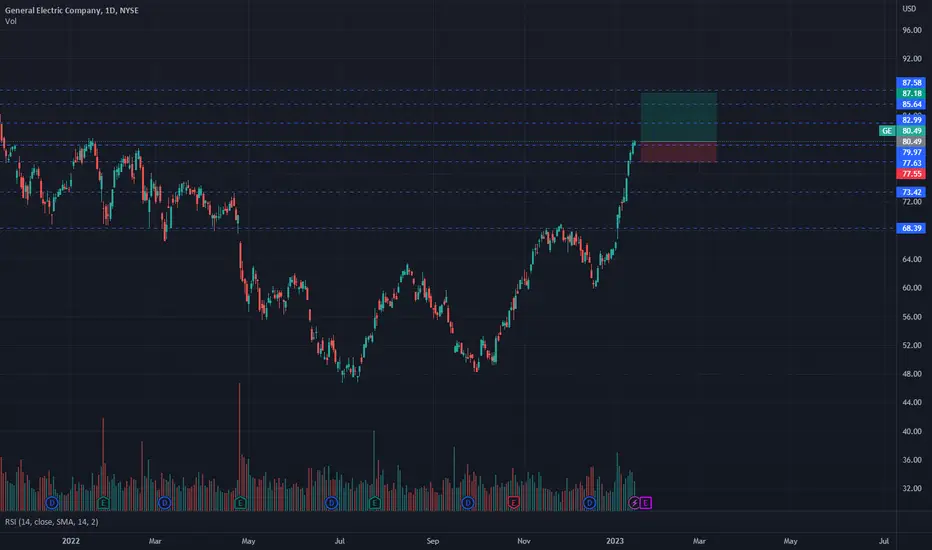
General Electric (Long)General Electric
Long
Entry at 80.49
Take Profit at 87.18 (8.31% profit from entry)
Stop loss at 77.55
General Electric MOON boyslooking like the electricity market is going haywire in the months to come. seeming like this will take out these local highs and run to this higher level $100+ soon. As inflation continues to kick price of goods increases commodities prices should reflect that
GE Weekly View - Potential Inverse Head and Shouldersmost of my notes and thoughts are on the chart
- 3 major moves to the down side, with what appears to be a iHnS potential taking shape
--Need to see much more volume (buying) to confirm with better probability that this pattern pans out
---low volume with price increase would indicate weakness imho
- IF, this were a legitimate inverse HnS and the pattern completed:
--Target of ~$300.00 as indicated by blue horizontal trendline
--*a more conservative target of ~$195 could be made and the higher target could fail due to resistance at yellow trendline
**(marked by the yellow X and the 2nd yellow X near $195)
*Note the time frame of this trade....several years to see in totality. This is something to just keep an eye on for longer term investment
this is not financial advice, simply notes on what i see and should be used for observation/education only

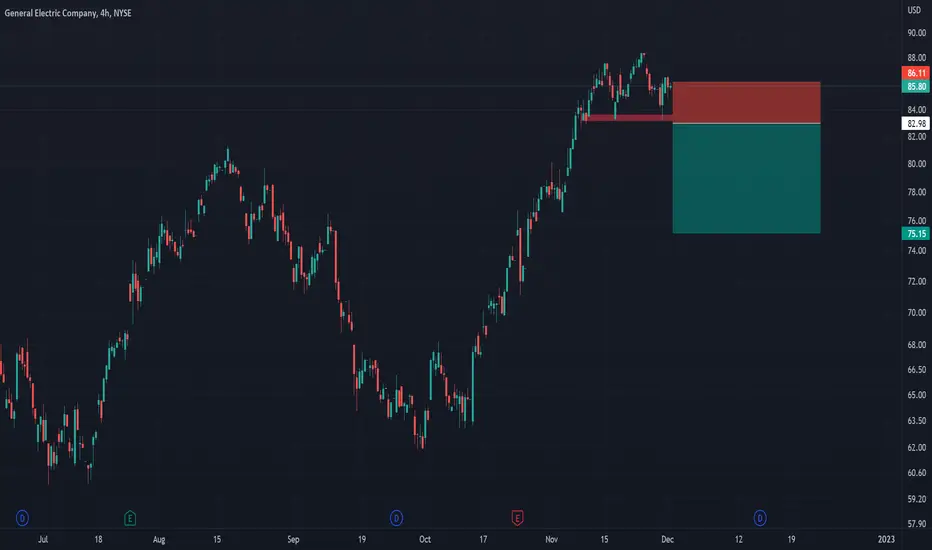
General Electric remains bearish.General Electric Company - 30d expiry - We look to Sell a break of 82.98 (stop at 86.11)
We are trading at overbought extremes.
The primary trend remains bearish.
Bearish divergence is expected to cap gains.
Posted a Double Bottom formation.
A break of the recent low at 83.20 should result in a further move lower.
Trading has been mixed and volatile.
A higher correction is expected.
Our profit targets will be 75.15 and 73.15
Resistance: 86.60 / 87.60 / 88.40
Support: 84.70 / 83.20 / 80.00
Disclaimer – Saxo Bank Group.
Please be reminded – you alone are responsible for your trading – both gains and losses. There is a very high degree of risk involved in trading. The technical analysis , like any and all indicators, strategies, columns, articles and other features accessible on/though this site (including those from Signal Centre) are for informational purposes only and should not be construed as investment advice by you. Such technical analysis are believed to be obtained from sources believed to be reliable, but not warrant their respective completeness or accuracy, or warrant any results from the use of the information. Your use of the technical analysis , as would also your use of any and all mentioned indicators, strategies, columns, articles and all other features, is entirely at your own risk and it is your sole responsibility to evaluate the accuracy, completeness and usefulness (including suitability) of the information. You should assess the risk of any trade with your financial adviser and make your own independent decision(s) regarding any tradable products which may be the subject matter of the technical analysis or any of the said indicators, strategies, columns, articles and all other features.
Please also be reminded that if despite the above, any of the said technical analysis (or any of the said indicators, strategies, columns, articles and other features accessible on/through this site) is found to be advisory or a recommendation; and not merely informational in nature, the same is in any event provided with the intention of being for general circulation and availability only. As such it is not intended to and does not form part of any offer or recommendation directed at you specifically, or have any regard to the investment objectives, financial situation or needs of yourself or any other specific person. Before committing to a trade or investment therefore, please seek advice from a financial or other professional adviser regarding the suitability of the product for you and (where available) read the relevant product offer/description documents, including the risk disclosures. If you do not wish to seek such financial advice, please still exercise your mind and consider carefully whether the product is suitable for you because you alone remain responsible for your trading – both gains and losses.
TSLA wedgeDescending wedge on the 3H chart, Trends are your friends...retested that trend line a few times will wait for it to pull through and retest before entering some monthlies
Trade safe and have fun!
Like and follow for more like this!

GE - Fib Circle Providing Hope A Head and Shoulders pattern can be drawn within the blue ring of fib circle, if you allow a recovery of the current price action
As always the trend is your friend, which can be seen to be bearish, but an upward move is still possible.


Short term bulls on General Electric. GEGoals 98, 102. Invalidation at 88.
We are not in the business of getting every prediction right, no one ever does and that is not the aim of the game. The Fibonacci targets are highlighted in green with invalidation in red. Fibonacci goals, it is prudent to suggest, are nothing more than mere fractally evident and therefore statistically likely levels that the market will go to. Having said that, the market will always do what it wants and always has a mind of its own. Therefore, none of this is financial advice, so do your own research and rely only on your own analysis. Trading is a true one man sport. Good luck out there and stay safe
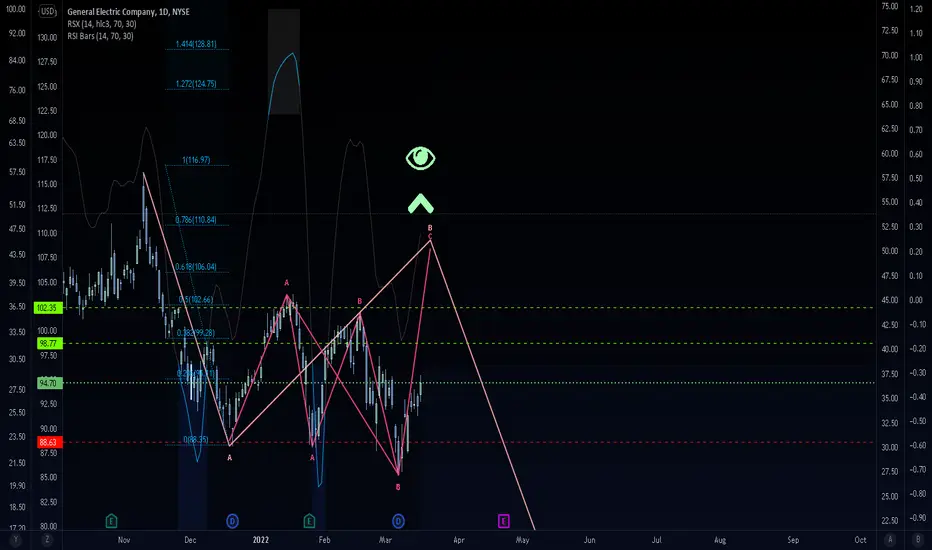
Elliott Wave View: General Electric (GE) Ended 5 Waves RallyThe short-term Elliott wave view in General Electric (GE) ended wave (1) at 88.03 low. Wave (2) rally is currently in progress as a zigzag Elliott Wave structure. Up from wave (1), wave A of the zigzag ended at 100.68 with internal subdivision as 5 waves impulse. Up from wave (1), wave ((i)) ended at 91.77 and pullback in wave ((ii)) ended at 88.05. The stock then extended higher again in wave ((iii)) towards 100.59. Wave ((iii)) subdivided again as a 5 waves of lesser degree. Up from wave ((ii)), wave (i) ended at 92.28, wave (ii) dips ended at 91.03, wave (iii) ended at 98.44, wave (iv) ended at 96.16, and wave (v) ended at 100.59.
Wave ((iv)) pullback ended at 98. Internal of wave ((iv)) subdivided as a double three. Down from wave ((iii)), wave (w) ended at 98.63, wave (x) ended at 100.47, and wave (y) ended at 98. This completed wave ((iv)). Stock then extended higher in wave ((v)) towards 100.68 which should also complete wave A. The stock is now pulling back in wave B to correct cycle from January 27 low. Internal of wave B is unfolding as a zigzag structure where wave ((a)) should end soon. The stock should bounce in wave ((b)) before it resumes lower again in wave ((c)). As far as pivot at 88.03 low stays intact, expect pullback to find support in 3, 7, or 11 swing for more upside.

GE Retirement PlanPost-correction GE could retest the median on its current declining fork, fundamentally they are a company that makes things, real things that the world needs right now, and in the future.
This is an extremely long term chart with little near term trading implication, but if we see a bullish pull from that median I wouldn't hesitate to invest in diverse large industrials like this.

General Electric (NYSE: $GE) Could See An Extra Bright 2022! 💡General Electric Company operates as a high-tech industrial company worldwide. The company's Power segment offers heavy-duty and aeroderivative gas turbines for utilities, independent power producers, and industrial applications; maintenance, service, and upgrade solutions to plant assets and their operational lifecycle; steam power technology for fossil and nuclear applications, including boilers, generators, steam turbines, and air quality control systems; and advanced reactor technologies solutions comprising reactors, fuels, and support services for boiling water reactors. This segment also applies the science and systems of power conversion to provide motors, generators, automation, and control equipment; and drives for energy intensive industries, such as marine, oil and gas, mining, rail, metals, test systems, and water. Its Renewable Energy segment provides various solutions for its customers through combining onshore and offshore wind, blades, hydro, storage, solar, and grid solutions, as well as hybrid renewables and digital services offerings. The company's Aviation segment designs and produces commercial and military aircraft engines, integrated engine components, electric power, and mechanical aircraft systems; and provides aftermarket services. Its Healthcare segment develops, manufactures, markets, and services magnetic resonance, computed tomography, molecular imaging, x-ray and high-frequency soundwave systems, clinical monitoring and acute care systems, enterprise digital, artificial intelligence applications, consulting and command center, and complementary software and services; and researches, manufactures, and markets imaging agents. The company's Capital segment offers aviation leasing and financing, and working capital services; financial solutions and underwriting capabilities; and insurance and reinsurance for life and health risks, as well as annuity products. The company was founded in 1878 and is headquartered in Boston, Massachusetts.
