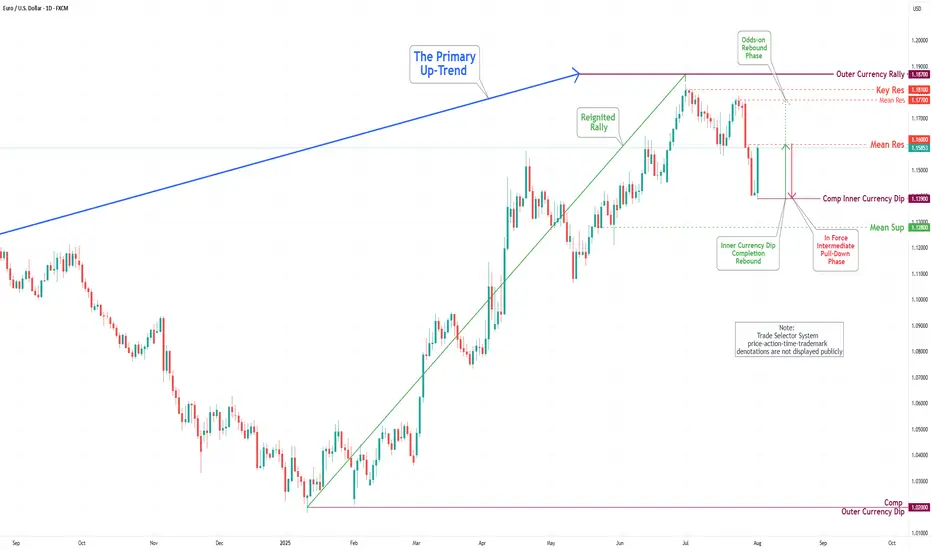
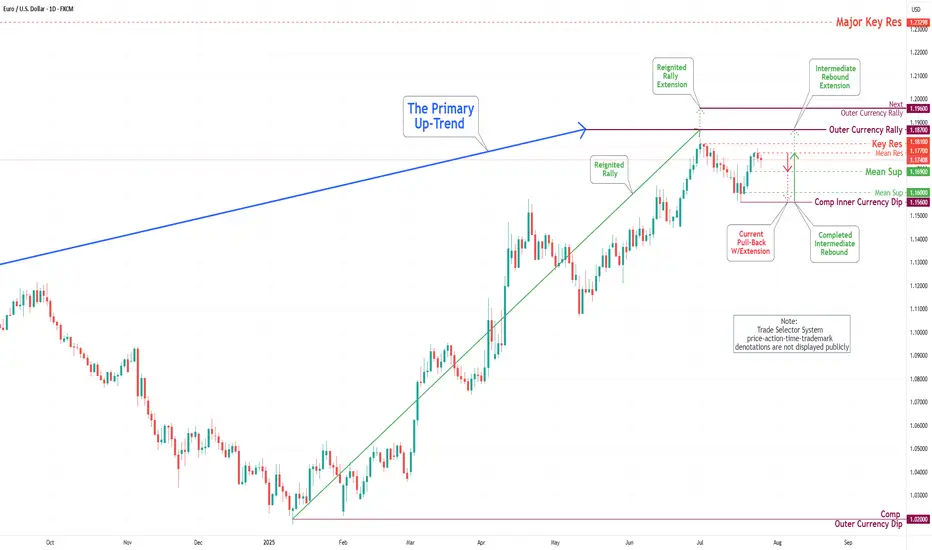
EUR/USD Daily Chart Analysis For Week of August 1, 2025Technical Analysis and Outlook:
In this week's trading session, the Euro experienced a significant drop, reaching the 1.139 level, and completing what is referred to as the Inner Currency Dip. As a result of the completion, the currency reversed direction and made a strong rebound, hitting the Mean Resistance level at 1.160. Recent analyses suggest that the Euro is likely to enter a sustained downward move after retesting the Mean Resistance at 1.160, with the target set to revisit the completed Inner Currency Dip at 1.139. However, it is essential to consider the possibility of continued upward momentum towards the Mean Resistance level of 1.177. Such a movement could trigger a significant rebound and lead to the completion of the Outer Currency Rally at 1.187.
Geopolitics
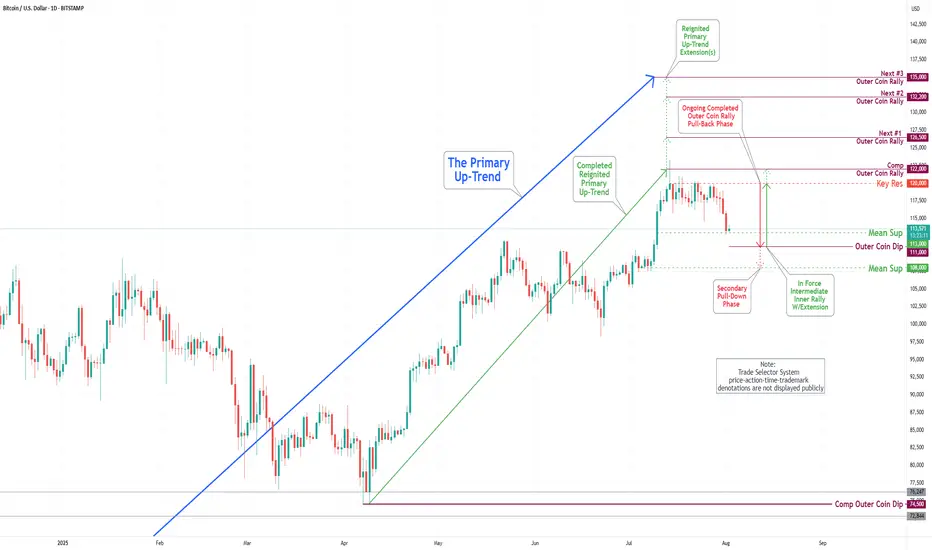
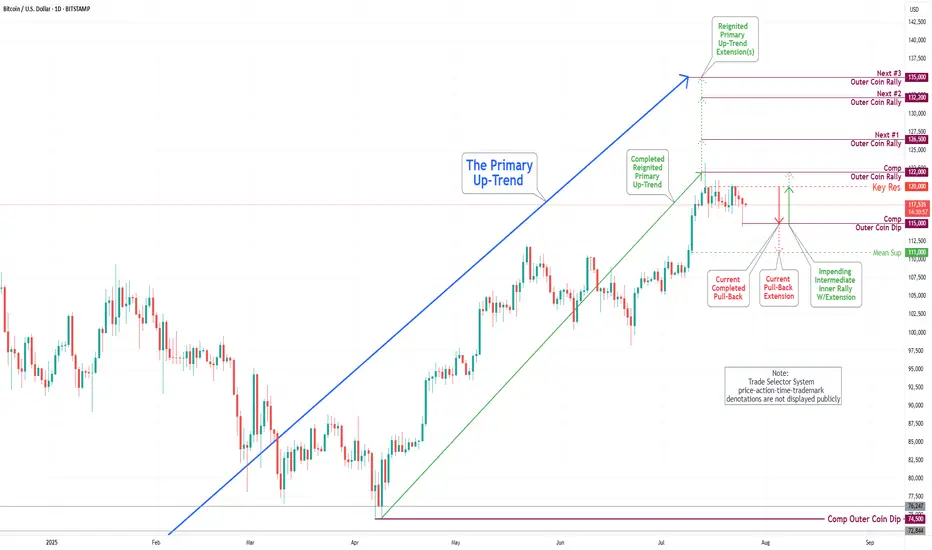
Bitcoin(BTC/USD) Daily Chart Analysis For Week of August 1, 2025Technical Analysis and Outlook:
In this week's trading session, the Bitcoin market experienced a notable pullback. The primary reason for this movement was the Key Resistance level, which led to a decline that reached our Mean Support level of 113000. This anticipated pullback is prompting the completion of the Outer Coin Dip target of 111000, with a strong likelihood of moving towards the Mean Support level of 108000.
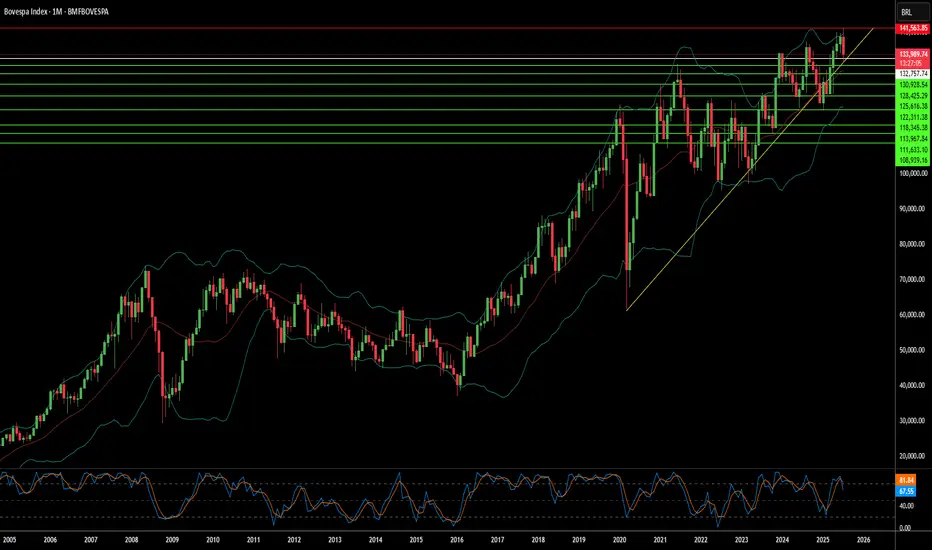
Has Geopolitics Clouded Brazil's Market Horizon?The Bovespa Index, Brazil's benchmark stock market index, faces significant headwinds from an unexpected source: escalating geopolitical tensions with the United States. Recent decisions by the US administration to impose a steep 50% tariff on most Brazilian imports, citing the ongoing prosecution of former President Jair Bolsonaro, have introduced considerable uncertainty. This move, framed by the US as a response to perceived "human rights abuses" and an undermining of the rule of law in Brazil's judiciary, marks a departure from conventional trade disputes, intertwining economic policy with internal political affairs. Brazilian President Luiz Inácio Lula da Silva has firmly rejected this interference, asserting Brazil's sovereignty and its willingness to negotiate trade, but not judicial independence.
The economic repercussions of these tariffs are multifaceted. While key sectors like civil aircraft, energy, orange juice, and refined copper have secured exemptions, critical exports such as beef and coffee face the full 50% duty. Brazilian meatpackers anticipate losses exceeding $1 billion, and coffee exporters foresee significant impacts. Goldman Sachs estimates an effective tariff rate of around 30.8% on total Brazilian shipments to the US. Beyond direct trade, the dispute dampens investor confidence, particularly given the US's existing trade surplus with Brazil. The threat of Brazilian retaliation looms, potentially exacerbating economic instability and further impacting the Bovespa.
The dispute extends into the technological and high-tech realms, adding another layer of complexity. US sanctions against Brazilian Supreme Court Justice Alexandre de Moraes, who oversees Bolsonaro's trial, directly link to his judicial orders against social media companies like X and Rumble for alleged disinformation. This raises concerns about digital policy and free speech, with some analysts arguing that regulating major US tech companies constitutes a trade issue given their economic significance. Furthermore, while the aerospace industry (Embraer) received an exemption, the broader impact on high-tech sectors and intellectual property concerns, previously highlighted by the USTR regarding Brazilian patent protection, contribute to a cautious investment environment. These intertwined geopolitical, economic, and technological factors collectively contribute to a volatile outlook for the Bovespa Index.
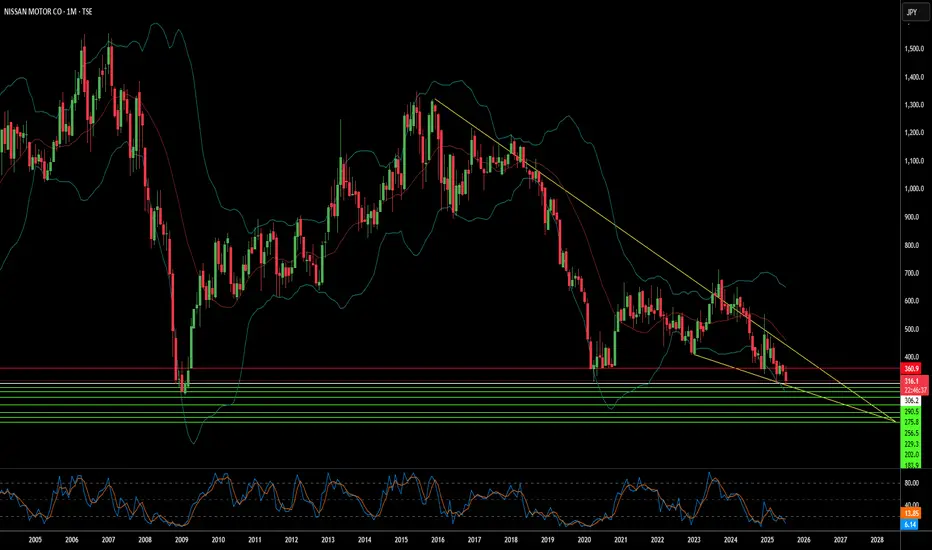
Is Nissan's Future Fading or Forging Ahead?Nissan Motor Company, once a titan of the global automotive industry, navigates a complex landscape. Recent events highlight the immediate vulnerabilities. A powerful 8.8-magnitude earthquake off Russia's Kamchatka Peninsula on July 30, 2025, triggered Pacific-wide tsunami alerts. This seismic event prompted Nissan to **suspend operations at certain domestic factories in Japan**, prioritizing employee safety. While a necessary precaution, such disruptions underscore the fragility of global supply chains and manufacturing, potentially impacting production targets and delivery schedules. This immediate response follows a period of significant operational adjustments as Nissan grapples with broader economic, geopolitical, and technological headwinds.
Beyond natural disasters, Nissan faces substantial financial and market share challenges. Although Fiscal Year 2023 saw operating profit and net income increases, global sales volume remained largely stagnant at 3.44 million units, signaling intensified market competition. Projections for Fiscal Year 2024 indicate a **forecasted revenue decline**, and recent U.S. sales figures show an 8% year-on-year drop in Q1 2025. Macroeconomic pressures, including inflation, volatile currency fluctuations, and a significant hit from **billions of dollars in lease losses** due to plummeting used car values, have directly impacted profitability. Geopolitical tensions, particularly the threat of a 24% U.S. tariff on Japanese auto exports, further threaten Nissan's crucial North American market.
Nissan's struggles extend into the technological arena and its innovation strategy. Despite holding a **remarkable patent portfolio** with over 10,000 active families, the company faces criticism for **lagging in electric vehicle (EV) adoption** and perceived technological stagnation. The slow rollout and underwhelming market impact of new EV models, coupled with a notable absence in the booming hybrid market, have allowed competitors to gain significant ground. Moreover, the brand has contended with **multiple cybersecurity breaches**, compromising customer and employee data, which damages trust and incurs remediation costs. Internal factors, including the lingering effects of the **Carlos Ghosn scandal**, management instability, and costly product recalls—like the recent July 2025 recall of over 480,000 vehicles due to engine defects—have further eroded investor confidence and brand reputation. Nissan's journey ahead remains uncertain as it strives to regain its competitive edge amidst these multifaceted pressures.
Is Samsung's Chip Bet Paying Off?Samsung Electronics is navigating a complex global landscape, marked by intense technological competition and shifting geopolitical alliances. A recent $16.5 billion deal to supply advanced chips to Tesla, confirmed by Elon Musk, signals a potential turning point. This contract, set to run until late 2033, underscores Samsung's strategic commitment to its foundry business. The agreement will dedicate Samsung's new Texas fabrication plant to producing Tesla's next-generation AI6 chips, a move Musk himself highlighted for its significant strategic importance. This partnership aims to bolster Samsung's position in the high-stakes semiconductor sector, particularly in advanced manufacturing and AI.
The deal's economic and technological implications are substantial. Samsung's foundry division has faced profitability challenges, experiencing estimated losses exceeding $3.6 billion in the first half of the year. This large-scale contract is expected to help mitigate those losses, providing a much-needed revenue stream. From a technological standpoint, Samsung aims to accelerate its 2-nanometer (2nm) mass production efforts. While its 3nm process faced yield hurdles, the Tesla collaboration, with Musk's direct involvement in optimizing efficiency, could be crucial for improving 2nm yields and attracting future clients like Qualcomm. This pushes Samsung to remain at the forefront of semiconductor innovation.
Beyond the immediate financial and technological gains, the Tesla deal holds significant geopolitical and geostrategic weight. The dedicated Texas fab enhances U.S. domestic chip production capabilities, aligning with American goals for supply chain resilience. This deepens the U.S.-South Korea semiconductor alliance. For South Korea, the deal strengthens its critical tech exports and may provide leverage in ongoing trade negotiations, particularly concerning potential U.S. tariffs. While Samsung still trails TSMC in foundry market share and faces fierce competition in High-Bandwidth Memory (HBM) from SK Hynix, this strategic alliance with Tesla positions Samsung to solidify its recovery and expand its influence in the global high-tech arena.

EUR/USD Daily Chart Analysis For Week of July 25, 2025Technical Analysis and Outlook:
During the previous week's trading session, the Euro experienced an increase following the completion of the Inner Currency Dip at the 1.156 level. It subsequently surpassed two significant Mean Resistance levels, namely 1.167 and 1.172; however, it reversed direction by the conclusion of the trading week. Recent analyses indicate that the Euro is likely to undergo a sustained downward trend, with a projected target set at the Mean Support level of 1.169 and a potential further decline to retest the previously completed Currency Dip at 1.156. Nonetheless, it remains essential to consider the possibility of renewed upward momentum towards the Mean Resistance level of 1.177, which could initiate a preeminent rebound and facilitate the completion of the critical Outer Currency Rally at 1.187.
Bitcoin(BTC/USD) Daily Chart Analysis For Week of July 25, 2025Technical Analysis and Outlook:
In the trading session of the previous week, the Bitcoin market exhibited considerable volatility as it retested the Key Resistance level at 120000. On the lower end of the spectrum, the market engaged with the Mean Support levels at 117500 and 115900, culminating in the completion of the Outer Coin Dip at 115000. Currently, the coin is poised to retest the Key Resistance at 120000 once again. This anticipated rebound will necessitate a retest of the completed Outer Coin Rally at 122000. The additional target levels for the renewed Primary Up-Trend are 126500, 132200, and 135000.
Can the S&P 500's Ascent Continue?The S&P 500 recently achieved unprecedented highs, reflecting a multifaceted market surge. This remarkable performance stems primarily from a robust corporate earnings season. A significant majority of S&P 500 companies surpassed earnings expectations, indicating strong underlying financial health. The Communication Services and Information Technology sectors, in particular, demonstrated impressive growth, reinforcing investor confidence in the broader market's strength.
Geopolitical and geostrategic developments have also played a crucial role in bolstering market sentiment. Recent "massive" trade agreements, notably with Japan and a framework deal with Indonesia, have introduced greater predictability and positive economic exchanges. These deals, characterized by reciprocal tariffs and substantial investment commitments, have eased global trade tensions and fostered a more stable international economic environment, directly contributing to market optimism. Ongoing progress in trade discussions with the European Union further supports this positive trend.
Furthermore, resilient macroeconomic indicators underscore the market's upward trajectory. Despite a recent dip in existing home sales, key data points like stable interest rates, decreasing unemployment claims, and a rising manufacturing PMI collectively suggest an enduring economic strength. While technology and high-tech sectors, driven by AI advancements and strong earnings from industry leaders like Alphabet, remain primary growth engines, some segments, such as auto-related chipmakers, face challenges.
The S&P 500's climb is a testament to the powerful confluence of strong corporate performance, favorable geopolitical shifts, and a resilient economic backdrop. While the immediate rally wasn't directly driven by recent cybersecurity events, scientific breakthroughs, or patent analyses, these factors remain critical for long-term market stability and innovation. Investors continue to monitor these evolving dynamics to gauge the sustainability of the current market momentum.

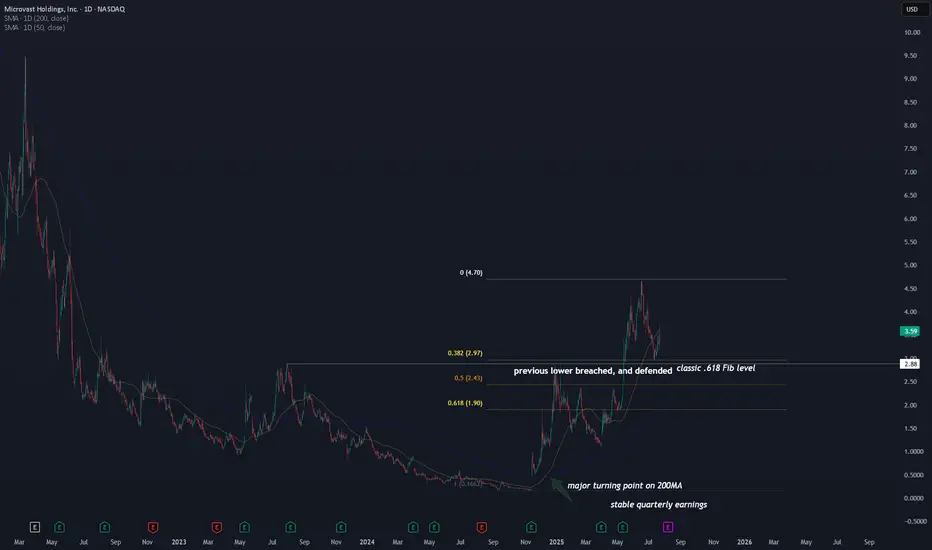
MVST, beginning of the new lithum hype? With ongoing US-China trade war, one of the key issues resides on lithium battery technology . Lithium technology is brought up as a national security concern . This is a tailwind for the industry .
Now let's get to the technicals.
A major turning point on the 200MA . We haven't seen this happening since Dec 2020, when the stock first went public.
$3.00 key level is tested three times . This is not just a .618 Fib level, but the previous cycle high in 2023.
First test happened during Dec 2024, which it failed. Second time we saw the stock blew through this key level on May 2025. Lastly we saw a solid defense on this level on July 2025. If this level were to hold, the upside can be very high .
In addition to the technical side, the company is generating $100M revenue with neutral/break-even earnings this year, up from $60-80M in 2023 and 204. A steady increase in revenue , while not losing much from earning perspective.
This places NASDAQ:MVST at a tipping point . All it needs is some tailwinds from the new geopolitical conflicts , and we will see either an increase in revenue (scale up) or an improvement in profitability. Or both. If that were to happen, MVST will skyrocket.
I am watching and monitoring this stock as right now, I am expecting to add MVST to my portfolio once I see further confirmation.
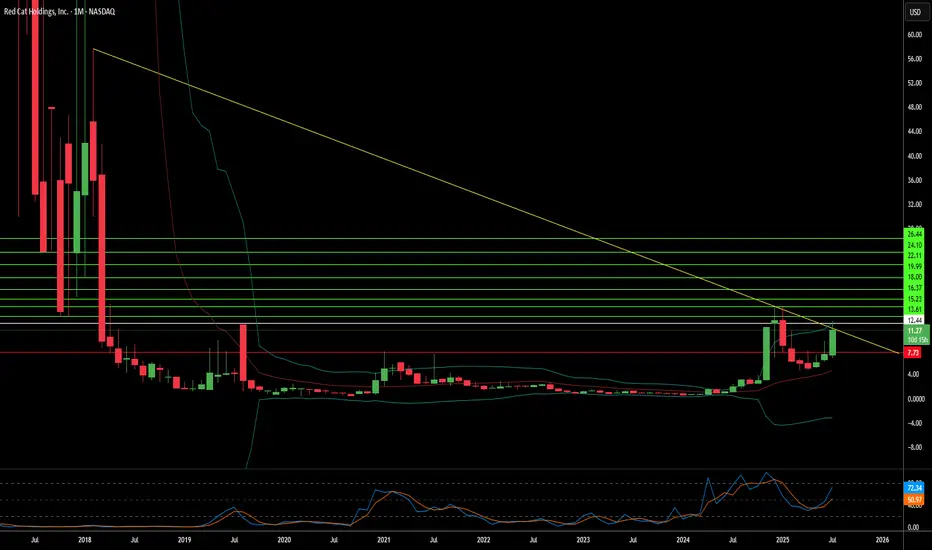
Red Cat Holdings (RCAT) – Soaring with Defense & Global DemandCompany Snapshot:
Red Cat NASDAQ:RCAT is an emerging UAV (drone) technology leader, rapidly scaling through defense-grade contracts, global expansion, and vertical integration.
Key Catalysts:
Defense Sector Traction 🎯
Recent U.S. DoD contract wins underscore RCAT’s credibility as a mission-critical UAV supplier.
Sequential revenue growth in earnings signals accelerating adoption in defense and commercial markets.
Global Expansion Strategy 🌐
RCAT is diversifying via allied procurement programs, reducing dependence on U.S. defense budgets and broadening international exposure.
Tech Stack Integration ⚙️
Strategic acquisitions are bolstering RCAT’s in-house capabilities—driving vertical integration, improving margins, and fueling innovation velocity.
Investment Outlook:
Bullish Entry Zone: Above $8.50–$9.00
Upside Target: $15.00–$16.00, supported by defense contract momentum, global reach, and a strengthened tech edge.
🛡️ RCAT is becoming a high-leverage play on modern defense tech with scalable, global upside.
#RCAT #DefenseStocks #UAV #DroneTechnology #MilitaryContracts #Innovation #DoD #Aerospace #Geopolitics #GrowthStocks #VerticalIntegration

Is Red Cat Holdings a Drone Industry Maverick?Red Cat Holdings (NASDAQ: RCAT) navigates a high-stakes segment of the burgeoning drone market. Its subsidiary, Teal Drones, specializes in rugged, military-grade uncrewed aerial systems (UAS). This niche positioning has attracted significant attention, evidenced by contracts with the U.S. Army and U.S. Customs and Border Protection. Geopolitical tensions, particularly the escalating demand for advanced military drone capabilities, create a favorable backdrop for companies like Red Cat, which offer NDAA-compliant and Blue UAS-certified solutions. These certifications are critical, ensuring drones meet stringent U.S. defense and security standards, differentiating Red Cat from foreign competitors.
Despite its strategic positioning and significant contract wins, Red Cat faces considerable financial and operational challenges. The company currently operates at a loss, with a net loss of $23.1 million in Q1 2025 against modest revenues of $1.6 million. Its revenue projections of $80-$120 million for 2025 underscore the lumpy nature of government contracts. To bolster its capital, Red Cat completed a $30 million equity offering in April 2025. This financial volatility is compounded by an ongoing class action lawsuit. This lawsuit alleges misleading statements regarding the production capacity of its Salt Lake City facility and the value of its U.S. Army Short Range Reconnaissance (SRR) program contract.
The SRR contract, which could involve up to 5,880 Teal 2 systems over five years, represents a substantial opportunity. However, the lawsuit highlights a significant discrepancy, with allegations from short-seller Kerrisdale Capital suggesting a much lower annual budget allocation for the program compared to Red Cat's initially intimated "hundreds of millions to over a billion dollars." This legal challenge and the inherent risks of government funding cycles contribute to the stock's high volatility and elevated short interest, which recently exceeded 18%. For risk-tolerant investors, Red Cat presents a "moonshot" opportunity, contingent on its ability to convert contract wins into sustainable, scalable revenue and successfully navigate its legal and financial hurdles.
EUR/USD Daily Chart Analysis For Week of July 18, 2025Technical Analysis and Outlook:
In the current trading session, the Euro has continued its decline, completing our Mean Support level of 1.160. Recent analyses indicate that the Euro is likely to experience a sustained downward trend, with an anticipated retest at the Mean Support level of 1.159 and a possible further decline to reach a Currency Dip of 1.152. Nevertheless, it is crucial to consider the potential for a dead-cat bounce toward the Mean Resistance level of 1.167, which could trigger a significant reversal of the downtrend and target a Currency Dip of 1.152.

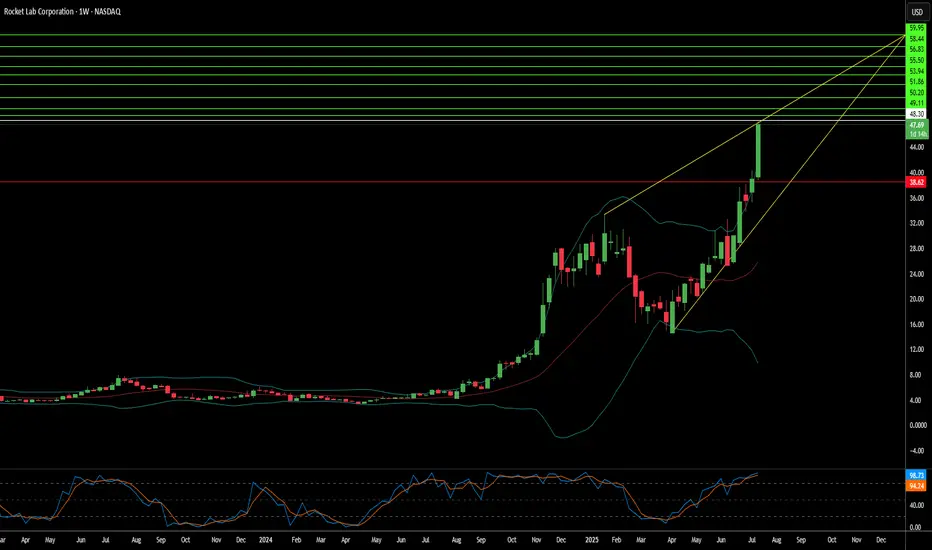
Is Rocket Lab the Future of Space Commerce?Rocket Lab (RKLB) is rapidly ascending as a pivotal force in the burgeoning commercial space industry. The company's vertically integrated model, spanning launch services, spacecraft manufacturing, and component production, distinguishes it as a comprehensive solutions provider. With key operations and launch sites in both the U.S. and New Zealand, Rocket Lab leverages a strategic geographic presence, particularly its strong U.S. footprint. This dual-nation capability is crucial for securing sensitive U.S. government and national security contracts, aligning perfectly with the U.S. imperative for resilient, domestic space supply chains in an era of heightened geopolitical competition. This positions Rocket Lab as a trusted partner for Western allies, mitigating supply chain risks for critical missions and bolstering its competitive edge.
The company's growth is inextricably linked to significant global shifts. The space economy is projected to surge from $630 billion in 2023 to $1.8 trillion by 2035, driven by decreasing launch costs and increasing demand for satellite data. Space is now a critical domain for national security, compelling governments to rely on commercial entities for responsive and reliable access to orbit. Rocket Lab's Electron rocket, with over 40 launches and a 91% success rate, is ideally suited for the burgeoning small satellite market, vital for Earth observation and global communications. Its ongoing development of Neutron, a reusable medium-lift rocket, promises to further reduce costs and increase launch cadence, targeting the expansive market for mega-constellations and human spaceflight.
Rocket Lab's strategic acquisitions, such as SolAero and Sinclair Interplanetary, enhance its in-house manufacturing capabilities, allowing greater control over the entire space value chain. This vertical integration not only streamlines operations and reduces lead times but also establishes a significant barrier to entry for competitors. While facing stiff competition from industry giants like SpaceX and emerging players, Rocket Lab's diversified approach into higher-margin space systems and its proven reliability position it strongly. Its strategic partnerships further validate its technological prowess and operational excellence, ensuring a robust position in an increasingly competitive landscape. As the company explores new frontiers like on-orbit servicing and in-space manufacturing, Rocket Lab continues to demonstrate the strategic foresight necessary to thrive in the dynamic new space race.
XAU/USD Weekly Update — July 14, 2025⌛Timeframe:
.
📆 Date: July 14, 2025
.
🎯 Weekly Bias: Mildly Bullish — elevated risk, cautious momentum
🔎 Market Overview:
🛡️ Safe‑haven demand surging:
Renewed 30% tariffs on EU, Mexico, Canada have pushed investors into gold, lifting prices to a 3-week high.
📉 Weak USD & inflation hedge:
A softer U.S. dollar, under pressure from dovish Fed speculation, continues to support gold. A predicted September rate cut further boosts gold’s appeal.
🏦 Central bank accumulation:
Q1 2025 saw record demand from central banks (≈244 tonnes), with many reallocating reserves toward gold for geopolitical and de-dollarization reasons.
📈 YTD performance standout:
Gold is up ~27% this year, leading other assets. Bullish technical indicators like tightening Bollinger Bands and sustained MACD support continuation.
🌀 Market Sentiment:
🔽 Exchange reserves continue dropping:
Indicative of increased HODLing and lower upcoming sell pressure.
🧠 Sentiment firmly bullish:
Analysts highlight risk‑off bias; gold remains favored amid trade tensions.
🤝 ETF inflows & institutional buying:
Strong flows through gold ETFs and central bank buying reflect ongoing structural support.
🔧 Technical Analysis:
📊 Weekly Movement: +1.9% weekly gain, now at $3,367.
✅ Key Levels:
🔻 Resistance: $3,374 → $3,400
🔺 Support: $3,350 → $3,331
🟢 Signals: Mild bearish RSI divergence hints at short-term pause
🟢 Weekly Bias: Mildly Bullish — momentum favored, but caution amid technical divergence.
.
.
.
⚠️ Risk Reminder: For educational purposes only — not financial advice. Utilize prudent risk management.
👍 If this update helps, hit like, comment your view, and follow for timely XAUUSD alerts!

Looking for catalysts - Gold Outlook July 7 - July 11, 2025All about last week you can find here:
FX_IDC:XAUUSD Gold is currently seeking fresh catalysts this week. 🧐
While the economic calendar appears light for this time of year, a lack of economic data doesn't mean nothing is happening. Geopolitical events, especially tariff wars or other flashpoints, remain significant. Are there increasing signs for peace in the Middle East between Israel and Hamas? 🕊️
This week Gold could take advantage from an exisiting reversal head and shoulders pattern and painting pitchfork in the chart shows possibillities for Upside targeting $3400.
## Geopolitical News Landscape 🌍📰
Israel / Iran ⚔️🛑☢️
After fierce clashes in June, a **ceasefire** began June 24. 🇮🇷 Iran's Supreme Leader reappeared July 6, claiming victory 🎤. Tehran has now **banned IAEA inspectors** ❌🔍. Over 900 Iranians reportedly killed ⚰️.
🔮 Outlook: ⚠️ Nuclear tensions growing, diplomacy frozen 🧊. Regional powers remain on high alert 🚨.
India / Pakistan 🗻🔫🕌
Tense calm in Kashmir 😐. India launched its sacred **Amarnath Yatra** 🕉️ under heavy security 🛡️. Pakistan killed 30 militants near the Afghan border ⚔️, while China 🐉 admitted sharing intel 📡.
🔮 Outlook: Diplomatic track stays open 🕊️, but **border flare-ups** and water disputes 💧 remain volatile 🔥.
Gaza Conflict 💣🏘️🕊️
Israel launched deadly airstrikes ✈️, including one on a beach café ☕🏖️ killing 22. Dozens more died 💔. IDF admitted accidental strikes on aid sites 🚚❌. U.S.-led talks seek a **60-day truce** 🤝.
🔮 Outlook: Ceasefire possible 🛑, but **humanitarian crisis** worsening 🚨🩺. Trust remains fragile 💔.
Russia / Ukraine ⚔️
Zelenskyy 🇺🇦 and Trump 📞 discussed new air defense aid 🎯. Russia answered with **massive drone strikes** on Kyiv 🚁🔥. NATO boosts arms shipments 🔫 and backs Ukraine’s domestic weapons production 🏭.
🔮 Outlook: War grinds on ⚙️. No peace in sight, with **global stakes** rising 📈.
U.S. / China Trade War 💼📦🔥
With new tariffs looming 📆💣, Treasury said “multiple deals” are near 🤝. Trump claimed a **partial deal with China** 🐉, though tariffs remain high 📊.
🔮 Outlook: More piecemeal deals 🍰, but a **full-scale trade reset** looks unlikely before elections 🗳️.
🌍 Global Trade War 📉🚢💸
Trump’s shifting tariffs 🎯 hurt global growth 🌐. Markets hit record highs 📈 but investment chills ❄️. The 💵 dollar had its sharpest 6-month drop 📉 in decades.
🔮 Outlook: Businesses remain cautious ⚠️. **Supply chains** reroute 🔄. No global rebound without clarity 🔍.
Trump vs. Powell 💥🏛️📉
Trump demanded Powell’s resignation ❌📉, accusing him of weak rate policy 📊. Powell held firm 🧊, citing inflation risks 📈. Trump eyes replacements 👀🪑.
🔮 Outlook: Fed independence 🏛️ under fire 🔥. **Rate policy** may get politicized ahead of 2025 elections 🗳️.
📈 U.S. Inflation 🛒💰🧾
Inflation slowed to 0.1% 🐢, but tariffs raised prices on appliances 🔌 (+4.3%) and toys 🧸. Fed projects 3% inflation by year-end 📊.
🔮 Outlook: As **tariffs bite** 🦷, inflation likely to climb 📈. Fed stays cautious 🧐 on cuts.
Technical View 📐📈
Analysis Period: May 25 - June 6, 2025 | Forecast: June 7-11, 2025
1. ICT (Inner Circle Trader) Methodology Analysis 🧠
Market Structure
Higher Timeframe Bias: The chart shows a clear bullish market structure with higher highs and higher lows from the major low around 3,250. 🐂
Current Structure: Price is in a consolidation phase after reaching highs near 3,370, showing potential distribution. ⚖️
Key ICT Concepts Identified:
Fair Value Gap (FVG): Multiple gaps visible during the strong rally from 3,250 to 3,370. 💨
Order Blocks: Significant demand zone around 3,250-3,260 level (major accumulation area). 📦
Liquidity Zones:
Buy-side liquidity above 3,370 (recent highs). 💸
Sell-side liquidity below 3,320 (recent consolidation lows). 📉
Market Maker Models: Classic accumulation-manipulation-distribution pattern visible. 🔄
Session Analysis:
London Session: Shows strong directional moves. 🇬🇧
New York Session: Continuation of trends with increased volatility. 🗽
Asian Session: Consolidation and range-bound behavior. 🌏
2. Gann Analysis 🧙♂️
Gann Angles & Time Cycles:
Primary Trend: 1x1 angle supporting the bullish move from 3,250. ↗️
Resistance Angles: 2x1 and 3x1 angles providing resistance around current levels. 🚧
Time Cycles:
7-day cycle showing completion around June 2-3. 🗓️
14-day cycle suggesting potential reversal window June 7-9. ⏳
Gann Price Levels:
Major Support: 3,250 (1/8 level). 🛡️
Current Resistance: 3,370 (7/8 level). 🛑
Next Target: 3,400 (full octave completion). 🎯
Geometric Relationships:
Price squared relationship suggests 3,380-3,400 as natural resistance. 📐
Time-price balance indicates consolidation period before next major move. 🕰️⚖️
3. Fibonacci Analysis ✨
Retracement Levels (from 3,250 low to 3,370 high):
23.6%: 3,341.6
38.2%: 3,324.2
50.0%: 3,310.0
61.8%: 3,295.8
78.6%: 3,265.6
Extension Levels:
127.2%: 3,402.6
161.8%: 3,444.2
200.0%: 3,490.0
Current Analysis:
Price has respected the 23.6% retracement level multiple times. ✅
Strong support confluence at 38.2% level (3,324). 💪
Extension targets suggest potential move to 3,402-3,444 range. 🚀
4. Institutional Levels Analysis 🏦
Psychological Levels:
3,300: Major round number providing support. 💯
3,350: Mid-level resistance. 📊
3,400: Next major psychological target. 🎯
Institutional Order Flow:
Accumulation Zone: 3,250-3,280 (heavy institutional buying). 💰
Distribution Zone: 3,350-3,370 (profit-taking area). 💸
Breakout Target: 3,400+ (next institutional objective). ⬆️
Volume Analysis:
High volume on the initial move up from 3,250. 📈
Decreasing volume during consolidation (typical distribution pattern). 📉
Volume expansion needed for breakout confirmation. 💥
5. Cycle Timing Analysis ⏰
Short-Term Cycles:
3-day cycle: Currently in compression phase. 🤏
7-day cycle: Completed around June 2-3. ✅
14-day cycle: Due for completion June 7-9. ⏳
Medium-Term Cycles:
Monthly cycle: Bullish momentum phase. ⬆️
Quarterly cycle: In expansion phase. 🌟
Cycle Projection:
Next major cycle turn expected June 7-9. 🔄
Potential for either breakout or correction during this window. 🤞
6. FORECAST: June 7-11, 2025 🔮
Primary Scenario (60% probability): Bullish Breakout 🚀
Target 1: 3,400-3,410
Target 2: 3,440-3,450
Catalyst: Break above 3,370 with volume. 💥
Timeline: June 7-9 initial move, June 10-11 extension.
Secondary Scenario (35% probability): Corrective Pullback ⬇️
Target 1: 3,320-3,325 (38.2% Fibonacci)
Target 2: 3,300-3,310 (psychological support)
Catalyst: Failure to break 3,370 resistance. 🚫
Timeline: June 7-8 decline, June 9-11 consolidation.
Low Probability Scenario (5% probability): Deep Correction 📉
Target: 3,280-3,290 (61.8% Fibonacci)
Catalyst: Major risk-off sentiment. 😱
Timeline: Extended throughout the week.
7. Key Assumptions & Risk Factors 🤔
Bullish Assumptions:
Continued institutional accumulation at current levels. 🏦
Breakout above 3,370 with confirming volume. ⬆️
Favorable macroeconomic backdrop for gold. 🌍
Weakness in USD supporting gold prices. 💵
Geopolitical tensions maintaining safe-haven demand. 🕊️
Bearish Risk Factors:
Profit-taking at psychological 3,400 level. 🤝
Stronger USD due to economic data. 💹
Reduced safe-haven demand. 📉
Technical failure at key resistance levels. 🚧
Central bank policy shifts. 🏛️
8. Trading Recommendations 💡
Entry Strategies:
Bullish Setup: Buy on pullback to 3,340-3,345 with stop below 3,320. 🎯
Breakout Play: Buy break above 3,372 with stop below 3,350. 🚀
Conservative: Wait for retest of 3,324 support area. patiently 🧘
Risk Management:
Position Size: Limit to 2-3% of portfolio per trade. 📏
Stop Loss: Always use stops below key support levels. ⛔
Take Profit: Scale out at Fibonacci extension levels. 💰
Key Levels to Watch:
Immediate Resistance: 3,365-3,370 🛑
Support: 3,340-3,345 🛡️
Breakout Level: 3,372 🚀
Major Support: 3,320-3,325 💪
9. Conclusion ✅
The XAUUSD chart presents a constructive bullish setup with multiple confluences supporting higher prices. The completion of various cycles around June 7-9 suggests a potential catalyst for the next major move. While the primary bias remains bullish targeting 3,400+, traders should remain alert to the possibility of a corrective pullback to test lower support levels. 🧐
The institutional accumulation pattern, combined with favorable Gann angles and Fibonacci projections, supports the bullish thesis. However, proper risk management is essential given the potential for volatility around key psychological levels. ⚠️
Please take the time to let me know what you think about this. 💬
-------------------------------------------------------------------------
This is just my personal market idea and not financial advice! 📢 Trading gold and other financial instruments carries risks – only invest what you can afford to lose. Always do your own analysis, use solid risk management, and trade responsibly.
Good luck and safe trading! 🚀📊

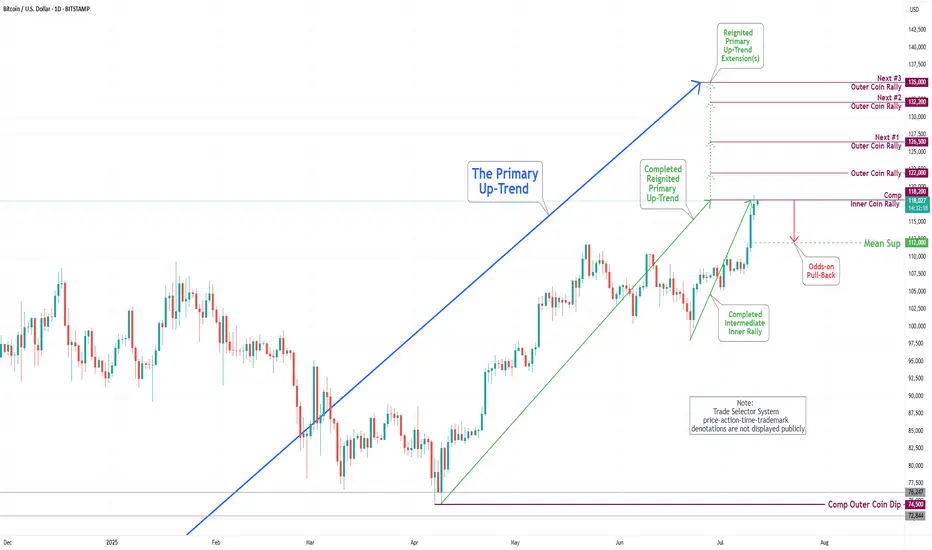
Bitcoin(BTC/USD) Daily Chart Analysis For Week of July 11, 2025Technical Analysis and Outlook:
In the last week's trading session, Bitcoin has demonstrated a significant surge, achieving historical prices as anticipated by TSS for an extended period. The cryptocurrency has successfully completed both the Outer Coin Rally 114500 and the Inner Coin Rally 118200. Presently, Bitcoin is poised to celebrate this notable accomplishment with a victory lap, but it may face a potential downward trajectory, targeting the Mean Support level of 112000. This anticipated decline will necessitate the resilience to a retest of Inner Coin Rally 118200. The designated targets for the Outer Coin Rally at this juncture are 122000, 126500, 132200, and 135000.
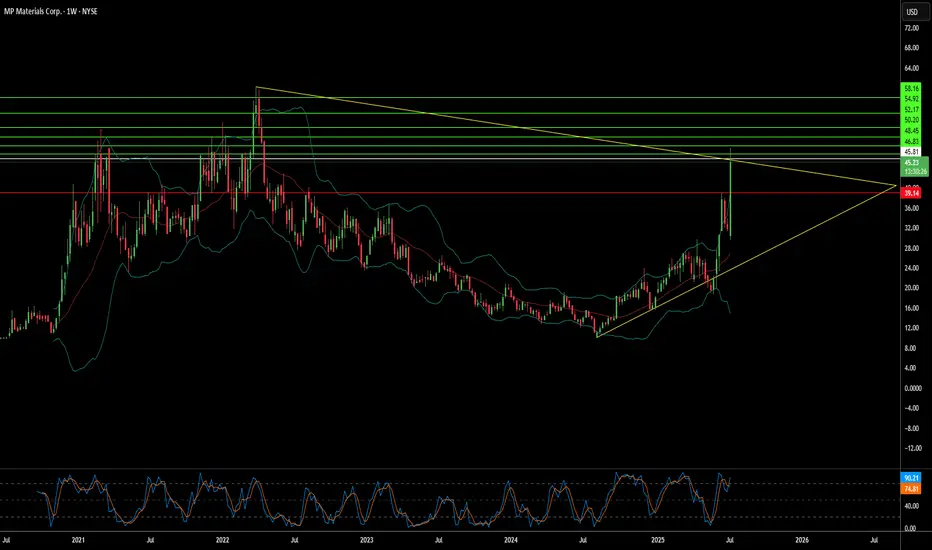
Can Strategic Minerals Transform National Security?MP Materials has experienced a significant market revaluation, with its stock surging over 50% following a pivotal public-private partnership with the U.S. Department of Defense (DoD). This multi-billion-dollar agreement, which includes a $400 million equity investment, substantial additional funding, and a $150 million loan, aims to rapidly establish a robust, end-to-end U.S. rare earth magnet supply chain. This strategic collaboration is designed to curtail the nation's reliance on foreign sources for these critical materials, which are indispensable for advanced technology systems across both defense and commercial applications, from F-35 fighter jets to electric vehicles.
The partnership underscores a profound geopolitical imperative: countering China's near-monopoly over the global rare earth supply chain. China dominates rare earth mining, refining, and magnet production, a leverage it has demonstrably used through export restrictions amidst escalating trade tensions with the U.S. These actions highlighted acute U.S. vulnerabilities and the imperative for domestic independence, propelling the DoD's "mine to magnet" strategy aimed at achieving self-sufficiency by 2027. The DoD's substantial investment and its new position as MP Materials' largest shareholder signal a decisive shift in U.S. industrial policy, directly challenging China's influence and asserting economic sovereignty in a vital sector.
Central to the deal's financial attractiveness and long-term stability is a 10-year price floor of $110 per kilogram for key rare earths, significantly higher than historical averages. This guarantee not only ensures MP Materials' profitability, even against potential market manipulation, but also de-risks its ambitious expansion plans, including new magnet manufacturing facilities expected to produce 10,000 metric tons annually. This comprehensive financial and demand certainty transforms MP Materials from a commodity producer vulnerable to market whims into a strategic national asset, attracting further private investment and setting a powerful precedent for securing other critical mineral supply chains in the Western Hemisphere.
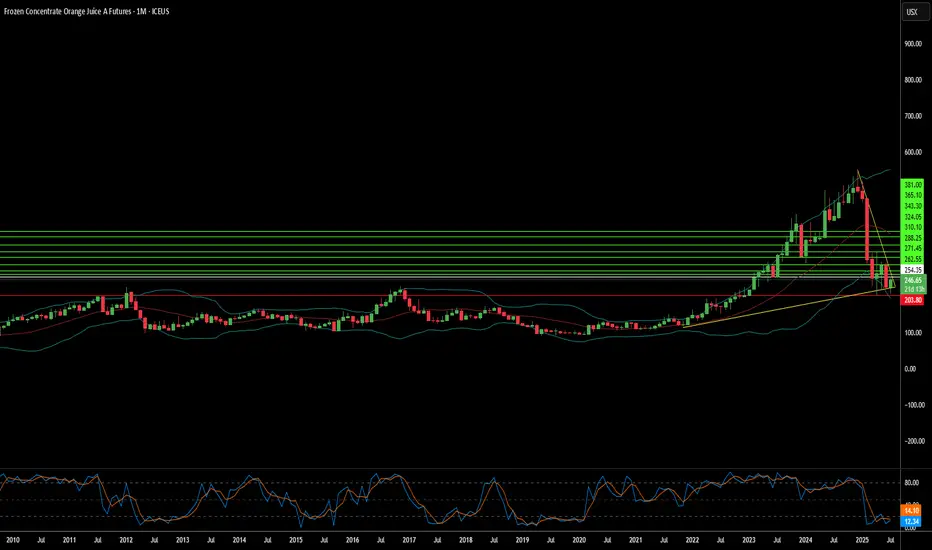
Why Your Orange Juice Costs More?The price of orange juice is surging, impacting consumers and the broader economy. This increase stems from a complex interplay of geopolitical tensions, macroeconomic pressures, and severe environmental challenges. Understanding these multifaceted drivers reveals a volatile global commodity market. Investors and consumers must recognize the interconnected factors that now influence everyday staples, such as orange juice.
Geopolitical shifts significantly contribute to the rising prices of orange juice. The United States recently announced a 50% tariff on all Brazilian imports, effective August 1, 2025. This politically charged move targets Brazil's stance on former President Jair Bolsonaro's prosecution and its growing alignment with BRICS nations. Brazil dominates the global orange juice supply, providing over 80% of the world's trade share and 81% of U.S. orange juice imports between October 2023 and January 2024. The new tariff directly increases import costs, squeezing margins for U.S. importers and creating potential supply shortages.
Beyond tariffs, a convergence of macroeconomic forces and adverse weather conditions amplify price pressures. Higher import costs fuel inflation, potentially compelling central banks to maintain tighter monetary policies. This broader inflationary environment impacts consumer purchasing power. Simultaneously, orange production faces severe threats. Citrus greening disease has devastated groves in both Florida and Brazil. Extreme weather events, including hurricanes and droughts, further reduce global orange yields. These environmental setbacks, coupled with geopolitical tariffs, create a robust bullish outlook for orange juice futures, suggesting continued price appreciation in the near term.
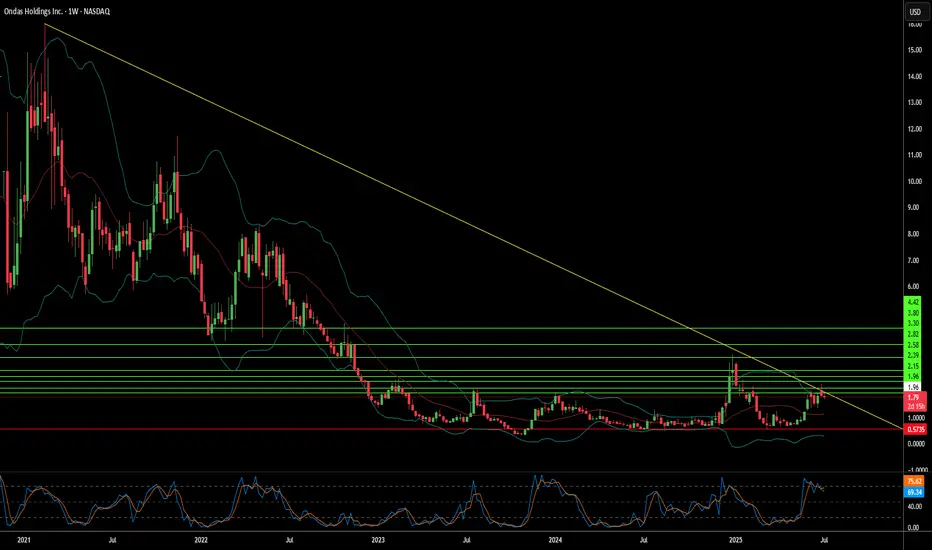
Can Ondas Holdings Redefine Defense Tech Investment?Ondas Holdings (NASDAQ: ONDS) is carving a distinct path in the evolving defense technology landscape, strategically positioning itself amid escalating global tensions and the modernization of warfare. The company’s rise stems from a synergistic approach, combining innovative autonomous drone and private wireless network solutions with shrewd financial maneuvers. A pivotal partnership with Klear, a financial technology firm, provides Ondas and its growing ecosystem with non-dilutive working capital. This off-balance-sheet financing mechanism is crucial, enabling rapid expansion and strategic acquisitions within the capital-intensive defense, homeland security, and critical infrastructure sectors without shareholder dilution.
Furthermore, Ondas's American Robotics subsidiary, a leader in FAA Type Certified autonomous drones, recently cemented a strategic manufacturing and supply chain partnership with Detroit Manufacturing Systems (DMS). This collaboration leverages U.S.-based production to enhance scalability, efficiency, and resilience in delivering American Robotics' advanced drone platforms. This domestic manufacturing focus aligns seamlessly with initiatives like the "Unleashing American Drone Dominance" executive order, which aims to bolster the U.S. drone industry, fostering innovation while safeguarding national security against foreign competition.
The company's offerings directly address the paradigm shift in modern warfare. Ondas's private industrial wireless networks (FullMAX) provide critical secure communication for C4ISR and battlefield operations, while its autonomous drone solutions (like the Optimus System and Iron Drone Raider for counter-UAS) are integral to evolving surveillance, reconnaissance, and combat strategies. As geopolitical instabilities intensify, driving unprecedented demand for advanced defense capabilities, Ondas’s integrated operational and financial platform is primed for significant growth, attracting considerable investor interest with its innovative approach to capital deployment and technological advancement.
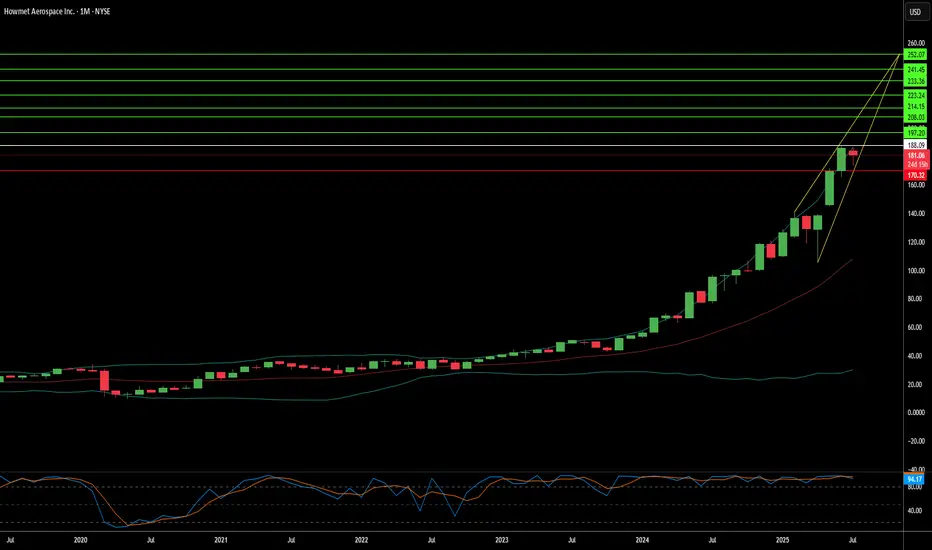
Howmet Aerospace: Navigating Geopolitics to New Heights?Howmet Aerospace (HWM) has emerged as a formidable player in the aerospace sector, demonstrating exceptional resilience and growth amidst global uncertainties. The company's robust performance, marked by record revenues and significant earnings per share increases, stems from dual tailwinds: surging demand in commercial aerospace and heightened global defense spending. Howmet's diversified portfolio, which includes advanced engine components, fasteners, and forged wheels, positions it uniquely to capitalize on these trends. Its strategic focus on lightweight, high-performance parts for fuel-efficient aircraft like the Boeing 787 and Airbus A320neo, alongside critical components for defense programs such as the F-35 fighter jet, underpins its premium market valuation and investor confidence.
The company's trajectory is deeply intertwined with the prevailing geopolitical landscape. Escalating international rivalries, particularly between the U.S. and China, coupled with regional conflicts, are driving an unprecedented surge in global military expenditures. European defense budgets are expanding significantly, fueled by the conflict in Ukraine and broader security concerns, leading to increased demand for advanced military hardware incorporating Howmet’s specialized components. Simultaneously, while commercial aviation navigates challenges like airspace restrictions and volatile fuel costs, the imperative for fuel-efficient aircraft, driven by both environmental regulations and economic realities, solidifies Howmet’s role in the industry’s strategic evolution.
Howmet's success also reflects its adept navigation of complex geostrategic challenges, including trade protectionism. The company has proactively addressed potential tariff impacts, demonstrating a capacity to mitigate risks through strategic clauses and renegotiation, thereby protecting its supply chain and operational efficiency. Despite its premium valuation, Howmet’s strong fundamentals, disciplined capital allocation, and commitment to shareholder returns highlight its financial health. The company's innovative solutions, crucial for enhancing the performance and cost-effectiveness of next-generation aircraft, solidify its integral position within the global aerospace and defense ecosystem, making it a compelling consideration for discerning investors.
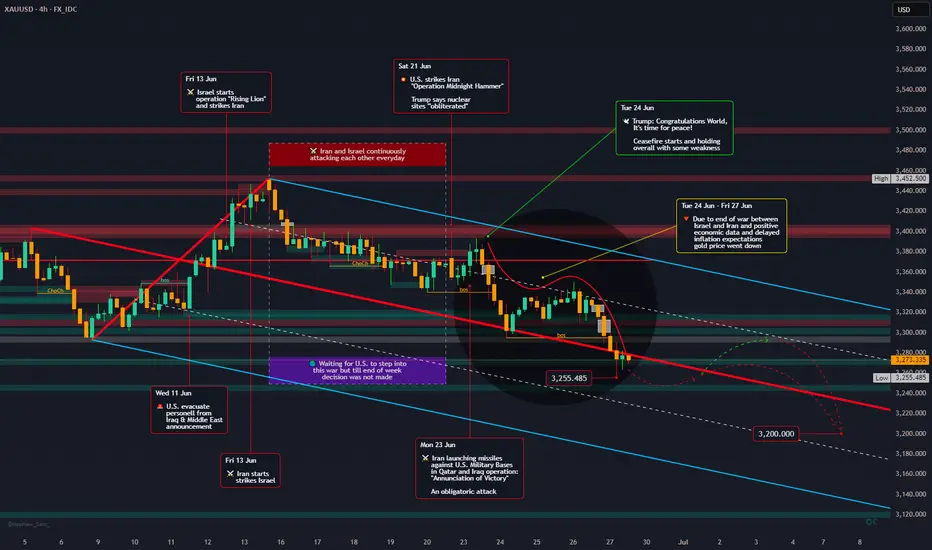
Down the road - Gold Outlook June 30 - July 24, 2025FX_IDC:XAUUSD
📰 The past weeks has been a wild ride for gold prices, caught between the fiery conflict in the Middle East and a deluge of crucial economic data from the U.S. 📈 Adding to this, a detailed technical analysis provides a deeper look into gold's immediate future.
**Geopolitical Drama Unfolds & Peace Prevails!** 🕊️ ceasefire negotiations.
Initially, gold was shrouded in uncertainty 🌫️ due to the Iran-Israel war, with markets bracing for potential U.S. involvement and a full-blown escalation. Daily tit-for-tat attacks between Iran and Israel kept everyone on edge, and the question of U.S. intervention remained a nail-biter 😬, though President Trump did announce a 14-day "timeout".
Then came the dramatic twist on June 21st: "Operation Midnighthammer" saw the U.S. unleash bunker-buster bombs on Iranian uranium enrichment facilities. 💥 Short time later, the U.S. declared mission accomplished, stating their goal of destroying these sites was achieved, and no further attacks would follow.
Iran's response, "Operation Annunciation of Victory," on the following Monday, involved missile strikes on U.S. military bases in Qatar and Iraq. 🚀 Interestingly, these attacks were pre-announced, allowing for safe evacuations and thankfully, no casualties. 🙏
The biggest surprise came from President Trump as he declared, "Congratulations world, it's time for peace!" 🎉 He then brokered a ceasefire between Israel and Iran, which, despite being fragile, largely held, leading to the war's end.🤝 Both nations, as expected, officially claimed victory – a common move to satisfy their citizens. 🏅
Personally, I was genuinely surprised that the U.S.President mediated ceasefire, actually brought the conflict to a close – but it's a welcome outcome! 🙏
**Economic Data & Fed's Steady Hand** 💹🏛️
The cessation of hostilities triggered a steady downward slide in gold prices from June 24th to 27th. ⬇️ This dip initially met some market resistance but it ultimately prevailed, especially with the release of mixed U.S. economic data, which, despite being varied, was generally interpreted positively by the market.
The spotlight also shone on the Federal Reserve, with several representatives speaking and Fed Chair Jerome Powell undergoing a two-day Senate hearing. 🎤👨⚖️ Powell meticulously explained the Fed's rationale for holding interest rates steady, despite market pressures. 🤷 However, recent whispers suggest the Federal Reserve might actually cut rates in September! 😮
## Geopolitical News Landscape 🌍📰
India / Pakistan
Pakistan rejected claims that it supported militant groups active in Indian Kashmir. India issued a formal protest but reported no fresh border clashes during the week.
Outlook 🔮: De-escalation is possible in the short term. However, unresolved disputes over water rights (Indus Treaty) could reignite tensions.
Gaza Conflict
Heavy Israeli airstrikes killed dozens in Gaza, including civilians near aid centers. The UN warned that U.S.-backed aid systems are failing. Humanitarian corridors remain blocked.
Outlook 🔮: Ceasefire talks may resume in July, but success depends on international pressure and safe humanitarian access.
Russia / Ukraine
Russia advanced 36 sq mi in eastern Ukraine, deploying outdated T-62 tanks. Ukraine reinforced defensive lines, aided by Western military packages.
Outlook 🔮: The front remains volatile. Sustained Western support will be key to halting further Russian gains.
U.S. – China Trade War
A breakthrough deal was signed for China to fast-track rare-earth exports to the U.S. Talks on tech transfer and tariffs continue behind closed doors.
Outlook 🔮: A phased de-escalation is possible, but deep trust issues linger, especially over semiconductors and AI.
🌐 Global Trade War
Several countries, including Brazil and Thailand, imposed fresh restrictions on Chinese imports, echoing the U.S. stance. Global supply chains remain fragmented.
Outlook 🔮: Trade blocs like the EU and Mercosur may take on greater importance as countries hedge against rising protectionism.
Trump vs. Powell
Fed Chair Powell resisted political pressure, stating rate cuts are unlikely before September. Trump called him “stubborn” and demanded immediate easing.
Outlook 🔮: The Fed’s independence is under strain. If Trump wins re-election, major policy shifts could follow.
📈 U.S. Inflation
Despite tariffs, core inflation remains elevated. Powell warned of persistent price pressures. Trump insists the Fed should cut rates to boost growth.
Outlook 🔮: A rate cut later in 2025 is possible—if labor market data weakens. Until then, inflation will remain politically explosive.
## Technical View 📐📈
**Current Market Context:** Gold plummeted to $3,273.67 USD/t.oz on June 27, 2025, marking a 1.65% drop from the previous day, which confirms the strong bearish momentum. The price action shows a significant retreat from recent highs around $3,400.
**ICT (Inner Circle Trader) Methodology Analysis:**
* **Market Structure:**
The trend is clearly bearish, with a definitive break of structure (BOS) to the downside.
* **Order Blocks:**
Several bearish order blocks have been identified at prior resistance levels, specifically in the $3,380-$3,400 range.
* **Fair Value Gaps (FVG):**
The aggressive sell-off has created multiple imbalances, particularly in the $3,350-$3,320 range.
* **Liquidity Pools:**
Buy-side liquidity above $3,400 has been swept. Sell-side liquidity is now accumulating below the $3,270 lows, which is the current target zone.
* **Session Analysis:**
The London session showed aggressive selling, followed by a continuation of bearish momentum in the New York session. The Asia session could see consolidation or further declines.
* **Smart Money Concepts:**
Heavy selling pressure suggests "smart money" distribution. There's been strong bearish displacement from $3,380 down to $3,270, indicating the market is currently in a "sell program" phase.
**Gann Analysis:**
* **Gann Angles & Time Cycles:**
The primary 1x1 Gann angle has been broken, pointing to continued weakness. Key price squares indicate resistance at $3,375 (25²) and support at $3,249 (57²). Daily cycles suggest a potential turning point around June 30-July 1, while weekly cycles indicate continued pressure through early July.
* **Gann Levels:**
* Resistance: $3,375, $3,400, $3,481 (59²)
* Support: $3,249, $3,136, $3,025
**Fibonacci Analysis:**
* **Key Retracement Levels (from recent swing high to low):**
* 78.6%: $3,378 (Strong resistance)
* 61.8%: $3,348 (Key resistance zone)
* 50.0%: $3,325 (Psychological level)
* 38.2%: $3,302 (Minor resistance)
* 23.6%: $3,285 (Current area of interest)
* **Fibonacci Extensions (Downside Targets):**
* 127.2%: $3,245
* 161.8%: $3,195
* 261.8%: $3,095
* **Time-Based Fibonacci:**
The next significant time cluster is July 2-3, 2025, with a major cycle completion expected around July 15-17, 2025.
**Institutional Levels & Volume Analysis:**
* **Key Institutional Levels:**
* Major Resistance: $3,400 (psychological + institutional)
* Secondary Resistance: $3,350-$3,375 (order block cluster)
* Primary Support: $3,250-$3,270 (institutional accumulation zone)
* Major Support: $3,200 (monthly pivot area)
* **Volume Profile Analysis:**
* High Volume Node (HVN): $3,320-$3,340 (fair value area)
* Low Volume Node (LVN): $3,280-$3,300 (potential acceleration zone)
* Point of Control (POC): Currently around $3,330
**Central Bank & Hedge Fund Levels:**
Based on recent COT data and institutional positioning, heavy resistance is seen at $3,400-$3,430, where institutions likely distributed. An accumulation zone for "smart money" re-entry is anticipated at $3,200-$3,250.
**Cycle Timing Analysis:**
* **Short-Term Cycles (Intraday):**
Bearish momentum is expected to continue for another 12-18 hours. A daily cycle low is likely between June 29-30, with a potential reversal zone on July 1-2 for the 3-day cycle.
* **Medium-Term Cycles:**
The current weekly cycle is in week 3 of a 4-week decline. The monthly cycle indicates a mid-cycle correction within a larger uptrend. For the quarterly cycle, Q3 2025 could see a major low formation.
* **Seasonal Patterns:**
July-August is typically a weaker period for gold ("Summer Doldrums"). September has historically been strong for precious metals ("September Effect"), setting up for a potential major move higher in Q4 2025 ("Year-End Rally").
**Trading Strategy & Levels:**
* **Bearish Scenario (Primary):**
* Entry: Sell rallies into the $3,320-$3,350 resistance zone.
* Targets: $3,250, $3,200, $3,150.
* Stop Loss: Above $3,380.
* **Bullish Scenario (Secondary):**
* Entry: Buy support at $3,250-$3,270 with confirmation.
* Targets: $3,320, $3,375, $3,400.
* Stop Loss: Below $3,230.
**Key Events to Watch:**
* **US PCE Data:**
Fresh downside risks could emerge ahead of the US Personal Consumption Expenditures (PCE) Price Index data release.
* **Fed Communications:**
Any hawkish rhetoric from the Federal Reserve could further pressure gold.
* **Geopolitical Developments:**
Ongoing global events could trigger safe-haven demand.
**Conclusion:**
The technical picture for gold suggests continued short-term weakness, with the metal testing its 2025 trend line at $3,290 following last week's rejection at the $3,430 resistance. However, the longer-term outlook remains constructive, given gold's robust performance year-to-date. Key support at $3,250-$3,270 will be crucial in determining the next significant price movement.
**Upcoming Week's Economic Calendar (June 29 - July 4, 2025):** 🗓️🌍
🗓️ Get ready for these important economic events (EDT)
* ** Sunday , June 29, 2025**
* 21:30 CNY: Manufacturing PMI (Jun) - Forecast: 49.6, Previous: 49.5
* ** Monday , June 30, 2025**
* 09:45 USD: Chicago PMI (Jun) - Forecast: 42.7, Previous: 40.5
* ** Tuesday , July 1, 2025**
* 05:00 EUR: CPI (YoY) (Jun) - Forecast: 2.0%, Previous: 1.9%
* 09:30 USD: Fed Chair Powell Speaks
* 09:45 USD: S&P Global Manufacturing PMI (Jun) - Forecast: 52.0, Previous: 52.0
* 10:00 USD: ISM Manufacturing PMI (Jun) - Forecast: 48.8, Previous: 48.5
* 10:00 USD: ISM Manufacturing Prices (Jun) - Forecast: 70.2, Previous: 69.4
* 10:00 USD: JOLTS Job Openings (May) - Forecast: 7.450M, Previous: 7.391M
* ** Wednesday , July 2, 2025**
* 08:15 USD: ADP Nonfarm Employment Change (Jun) - Forecast: 80K, Previous: 37K
* 10:30 USD: Crude Oil Inventories - Forecast: -5.836M
* ** Thursday , July 3, 2025**
* Holiday: United States - Independence Day (Early close at 13:00) 🇺🇸⏰
* 08:30 USD: Average Hourly Earnings (MoM) (Jun) - Forecast: 0.3%, Previous: 0.4%
* 08:30 USD: Initial Jobless Claims - Forecast: 239K, Previous: 236K
* 08:30 USD: Nonfarm Payrolls (Jun) - Forecast: 129K, Previous: 139K
* 08:30 USD: Unemployment Rate (Jun) - Forecast: 4.2%, Previous: 4.2%
* 09:45 USD: S&P Global Services PMI (Jun) - Forecast: 53.1, Previous: 53.1
* 10:00 USD: ISM Non-Manufacturing PMI (Jun) - Forecast: 50.3, Previous: 49.9
* 10:00 USD: ISM Non-Manufacturing Prices (Jun) - Forecast: 68.7
* ** Friday , July 4, 2025**
* All Day: Holiday - United States - Independence Day 🎆
**Gold Price Forecast for the Coming Week** 🔮💰
Given last week's market movements, there's a strong likelihood that the downward trend in gold prices will continue.🔽 However, fresh news can always flip the script! 🔄 As of now, I expect gold to dip further to $3255 by mid-next week. Yet, a brief rebound towards $3300 isn't out of the question before a potential drop to $3200 by week's end or early the following week. 🤞
Please take the time to let me know what you think about this. 💬
-------------------------------------------------------------------------
This is just my personal market idea and not financial advice! 📢 Trading gold and other financial instruments carries risks – only invest what you can afford to lose. Always do your own analysis, use solid risk management, and trade responsibly.
Good luck and safe trading! 🚀📊
EUR/USD Daily Chart Analysis For Week of July 4, 2025Technical Analysis and Outlook:
During the trading session this week, we witnessed the successful completion of the Outer Currency Rally at a level of 1.177. Recent analyses suggest that the Euro is likely to encounter a downward trend, with an initial target set at the Mean Support level of 1.168 and a potential extension to an additional Mean Support of 1.160. Nevertheless, it is crucial to acknowledge the possibility of a subsequent increase toward the next Outer Currency Rally level of 1.187 before any definitive downward movement transpires.

Gold May Find Support From These Various FactorsGold May Find Support Amid Concerns Over U.S. Debt Sustainability, Economic Weakness, and Renewed Geopolitical Tensions
Gold prices are holding steady today, near $1,353 per ounce in spot trading, in what is expected to be a low-liquidity session due to the early closure of U.S. markets. This follows three consecutive days of gains.
The yellow metal’s subdued movement comes as markets await key labor market data that may offer further insight into the health of the U.S. economy, especially after the recent shock from ADP figures.
Gold continues to find support from several underlying factors that could sustain its upward trend this week. These include rising uncertainty around the long-term sustainability of U.S. public finances and the risk of renewed conflict in the Middle East.
Concerns over U.S. fiscal stability have intensified following the introduction of the “One Big Beautiful Bill Act,” which combines tax cuts with spending reductions. In an opinion article for The New York Times , former Treasury Secretaries Robert Rubin and Lawrence Summers warn of the bill’s potentially severe consequences, including persistently high interest rates, reduced business confidence, falling investment, and the risk of a financial shock that markets may struggle to absorb. This could also leave the economy more vulnerable to economic and geopolitical threats.
Such risks may erode investor confidence in U.S. government debt, potentially boosting gold’s appeal as a safe-haven asset even in an environment of elevated bond yields and prolonged high interest rates.
On the geopolitical front, the specter of renewed escalation in the Middle East looms, and this time, the consequences could be more severe. Amid conflicting reports and statements regarding the extent of the damage to Iran’s nuclear facilities, both sides appear to be preparing for the possibility of renewed hostilities.
Diplomatic efforts remain stalled, and hardline voices continue to call for a return to conflict. In an opinion piece for The New York Times, former National Security Advisor John Bolton described negotiations with Iran as ineffective and dangerous, calling instead for regime change and the use of force.
While previous rounds of conflict have not caused lasting damage to the global economy or energy supply chains, a new round may prove more disruptive. According to Reuters , Iran has reportedly loaded naval mines onto vessels, raising fears that it may attempt to close the Strait of Hormuz.
Such a move would cross a critical threshold and turning a contained conflict into one with global economic implications. The Strait of Hormuz handles over one-fifth of the world’s crude oil and liquefied natural gas exports.
However, Iran may avoid this step as long as its own oil exports continue flowing through the strait, as was the case during the last conflict in June.
On the trade front, there is growing optimism about the potential for new agreements that could ease tensions that have disrupted global supply chains and threatened U.S. and global economic growth. This optimism follows President Trump’s announcement of a trade deal with Vietnam.
There is also hope that progress can be made with China. Recent reciprocal steps, that involve the easing of restrictions on rare earth exports by China and some relaxation of U.S. technology export controls, suggest that the de-escalation agreed upon earlier in Switzerland could hold, potentially laying the groundwork for a broader trade agreement.
Samer Hasn