DAX to find support at 50% retracement?DE30EUR - 24h expiry
Buying continued from the 38.2% pullback level of 17870.
Levels close to the 50% pullback level of 18066 found buyers.
Preferred trade is to buy on dips.
The primary trend remains bullish.
Our outlook is bullish.
We look to Buy at 18075 (stop at 17975)
Our profit targets will be 18325 and 18395
Resistance: 18240 / 18330 / 18400
Support: 18160 / 18016 / 17870
Risk Disclaimer
The trade ideas beyond this page are for informational purposes only and do not constitute investment advice or a solicitation to trade. This information is provided by Signal Centre, a third-party unaffiliated with OANDA, and is intended for general circulation only. OANDA does not guarantee the accuracy of this information and assumes no responsibilities for the information provided by the third party. The information does not take into account the specific investment objectives, financial situation, or particular needs of any particular person. You should take into account your specific investment objectives, financial situation, and particular needs before making a commitment to trade, including seeking advice from an independent financial adviser regarding the suitability of the investment, under a separate engagement, as you deem fit.
You accept that you assume all risks in independently viewing the contents and selecting a chosen strategy.
Where the research is distributed in Singapore to a person who is not an Accredited Investor, Expert Investor or an Institutional Investor, Oanda Asia Pacific Pte Ltd (“OAP“) accepts legal responsibility for the contents of the report to such persons only to the extent required by law. Singapore customers should contact OAP at 6579 8289 for matters arising from, or in connection with, the information/research distributed.
Ger40

Potential bullish bounceGER40 is falling towards a support level which is an overlap support that aligns with the 50% Fibonacci retracement. A bounce from this level could lead the price to fall to our take profit.
Entry: 17913.28
Why we like it:
There is an overlap support which aligns with the 50% Fibonacci retracement
Stop loss: 17612.74
Why we like it:
There is a pullback support level
Take profit: 18286.35
Why we like it:
There is a pullback resistance level
Please be advised that the information presented on TradingView is provided to Vantage (‘Vantage Global Limited’, ‘we’) by a third-party provider (‘Everest Fortune Group’). Please be reminded that you are solely responsible for the trading decisions on your account. There is a very high degree of risk involved in trading. Any information and/or content is intended entirely for research, educational and informational purposes only and does not constitute investment or consultation advice or investment strategy. The information is not tailored to the investment needs of any specific person and therefore does not involve a consideration of any of the investment objectives, financial situation or needs of any viewer that may receive it. Kindly also note that past performance is not a reliable indicator of future results. Actual results may differ materially from those anticipated in forward-looking or past performance statements. We assume no liability as to the accuracy or completeness of any of the information and/or content provided herein and the Company cannot be held responsible for any omission, mistake nor for any loss or damage including without limitation to any loss of profit which may arise from reliance on any information supplied by Everest Fortune Group.

GERMANY 30/40 Bullish side Heist Plan to make moneyHola Ola Smart Traders,
This is our master plan to Heist Bullish side of GERMANY30/40. I have two plans to heist this market please look at the chart I have mentioned in our heist plan, Our target is Caution Red Zone Target 1 for Day Trade Robbers and Target 2 for swing Trade Robbers. My dear Robbers please book some partial money it will manage our risk. Be safe and be careful and Be rich.
Loot and escape near the target 🎯
support our robbery plan we can make money take money 💰💵 Join your hands with US. Loot Everything in this market everyday with my master Plan.
DAX to find buyers at yesterday's Marabuzo?GER40 - 24h expiry
Yesterday's Marabuzo is located at 18065.
Short term bias has turned positive.
Risk/Reward would be poor to call a buy from current levels.
The primary trend remains bullish.
Preferred trade is to buy on dips.
We look to Buy at 18065 (stop at 17965)
Our profit targets will be 18315 and 18395
Resistance: 18234 / 18300 / 18400
Support: 18200 / 18100 / 18000
Risk Disclaimer
The trade ideas beyond this page are for informational purposes only and do not constitute investment advice or a solicitation to trade. This information is provided by Signal Centre, a third-party unaffiliated with OANDA, and is intended for general circulation only. OANDA does not guarantee the accuracy of this information and assumes no responsibilities for the information provided by the third party. The information does not take into account the specific investment objectives, financial situation, or particular needs of any particular person. You should take into account your specific investment objectives, financial situation, and particular needs before making a commitment to trade, including seeking advice from an independent financial adviser regarding the suitability of the investment, under a separate engagement, as you deem fit.
You accept that you assume all risks in independently viewing the contents and selecting a chosen strategy.
Where the research is distributed in Singapore to a person who is not an Accredited Investor, Expert Investor or an Institutional Investor, Oanda Asia Pacific Pte Ltd (“OAP“) accepts legal responsibility for the contents of the report to such persons only to the extent required by law. Singapore customers should contact OAP at 6579 8289 for matters arising from, or in connection with, the information/research distributed.

DAX making progress off of Friday lowThe DAX is showing relative strength following Friday's low. The hourly chart may be running out of puff, but that will bring support levels into focus.
This video is intended for the users of Stratos Markets Limited, Stratos Trading Pty. Limited and Stratos Global LLC, (collectively “FXCM Group”).
Stratos Markets Limited (www.fxcm.com):
CFDs are complex instruments and come with a high risk of losing money rapidly due to leverage. 68% of retail investor accounts lose money when trading CFDs with this provider. You should consider whether you understand how CFDs work and whether you can afford to take the high risk of losing your money.
Stratos Europe Ltd (trading as “FXCM” or “FXCM EU”), previously FXCM EU Ltd (www.fxcm.com):
CFDs are complex instruments and come with a high risk of losing money rapidly due to leverage. 73% of retail investor accounts lose money when trading CFDs with this provider. You should consider whether you understand how CFDs work and whether you can afford to take the high risk of losing your money.
Stratos Trading Pty. Limited (www.fxcm.com):
Trading FX/CFDs carries significant risks. FXCM AU (AFSL 309763). Please read the Financial Services Guide, Product Disclosure Statement, Target Market Determination and Terms of Business at www.fxcm.com
Stratos Global LLC (www.fxcm.com):
Losses can exceed deposits.
Any opinions, news, research, analyses, prices, other information, or links to third-party sites contained on this video are provided on an "as-is" basis, as general market commentary and do not constitute investment advice. The market commentary has not been prepared in accordance with legal requirements designed to promote the independence of investment research, and it is therefore not subject to any prohibition on dealing ahead of dissemination. Although this commentary is not produced by an independent source, FXCM takes all sufficient steps to eliminate or prevent any conflicts of interests arising out of the production and dissemination of this communication. The employees of FXCM commit to acting in the clients' best interests and represent their views without misleading, deceiving, or otherwise impairing the clients' ability to make informed investment decisions. For more information about the FXCM's internal organizational and administrative arrangements for the prevention of conflicts, please refer to the Firms' Managing Conflicts Policy. Please ensure that you read and understand our Full Disclaimer and Liability provision concerning the foregoing Information, which can be accessed via FXCM`s website:
Stratos Markets Limited clients please see: www.fxcm.com
Stratos Europe Ltd clients please see: www.fxcm.com
Stratos Trading Pty. Limited clients please see: www.fxcm.com
Stratos Global LLC clients please see: www.fxcm.com
Past Performance is not an indicator of future results.

Germany 40 IndexPair : Germany 40 Index
Description :
Rising Wedge as an Corrective Pattern in Long Time Frame and Breakout of Lower Trend Line
Break of Structure
RSI - Divergence
Lower Lows - Lower Highs
Bullish Channel in Short Time Frame

DAX, will this be the end of the bullish cycle wave?Hallo everyone,
markets are crazy lately and beside the fact, that Germany is in a recession period the DAX were climbing up for several ATHs in the last weeks. I think this should find an end very soon, as we are testing the ultimate resistance area formed by trend lines from ATH prices in the past.
Also my wave count is pointing to an fifth wave of a fifth wave.
18000 will be a psychological barrier I don't expect the price to go over easily and we are facing the 1,618 extension level from the last wave at around 17700.
I will work with several positions starting from 17700 up to 18000.

GERMANY 30/40 DE40 DAX Bullish Heist PlanSmart Indices Traders,
NFP Trade master plan to Heist GERMANY 30/40 Market. my dear Looters U can enter after the NFP data there is high chance to go down side, Our target is Green Zone if it goes bearish side, Bullish side our target is Red Zone that is High risk Caution Pullback area, If There is any Bad news it make our heist very sad and if the news is favorable for us then we can continue our looting from there with help of trailing stop.
My dear Robbers please book some partial money it will manage our risk. Be safe and be careful.. Make money and take money.

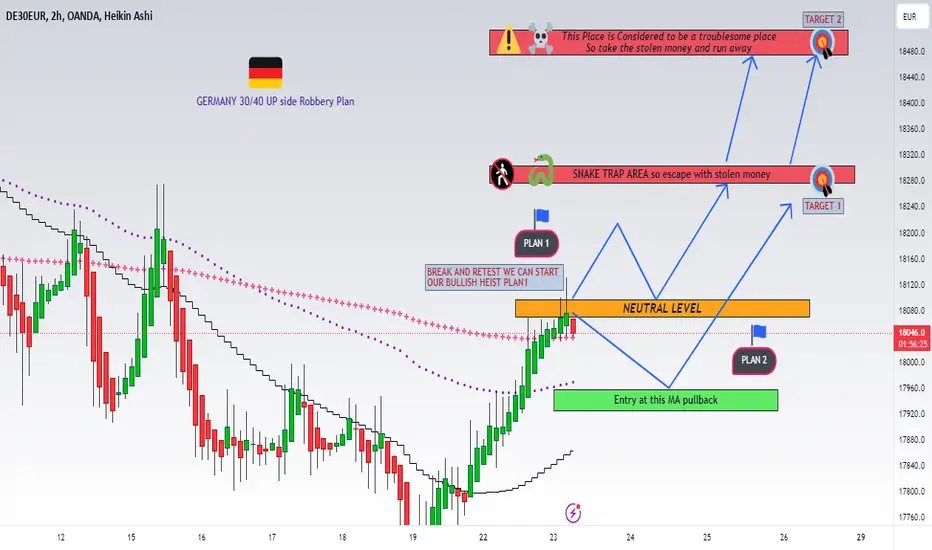
GERMANY 30/40 DE40 DAX Bullish Heist PlanHello My dear Indices Traders,
This is our Day Trade master plan to Heist Bullish side of GERMANY 30/40 Market. my dear Looterss U can enter at the any point above my entered area, Our target is Red Zone that is Hgh risk Caution area, If There is any Bad news it make our heist very sad and if the news is favorable for us then we can continue our looting from there with help of trailing stop.
My dear Robbers please book some partial money it will manage our risk. Be safe and be careful.

GER40 Bullish till it shows bearish resistanceGER40 Bullish till it shows bearish resistance on weekly.
Keep buying.
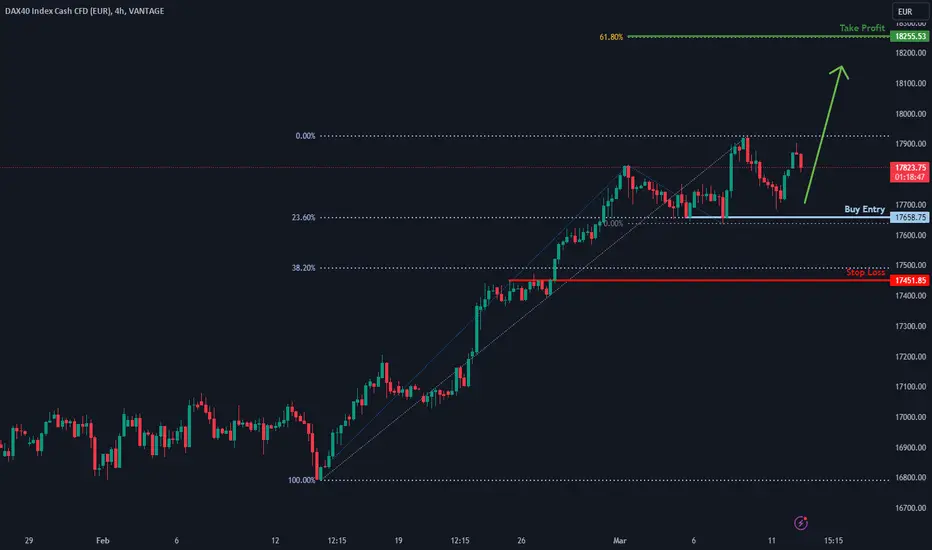
DAX H4 | Falling to pullback supportThe DAX (GER40) is falling towards a pullback support and could potentially bounce off this level to rise towards our take-profit target.
Entry: 17,658.75
Why we like it:
There is a pullback support that aligns with the 23.6% Fibonacci retracement level
Stop Loss: 17,451.85
Why we like it:
There is a pullback support that sits under the 38.2% Fibonacci retracement level
Take Profit: 18,255.53
Why we like it:
There is a resistance that aligns with the 61.8% Fibonacci projection level
Please be advised that the information presented on TradingView is provided to Vantage (‘Vantage Global Limited’, ‘we’) by a third-party provider (‘Everest Fortune Group’). Please be reminded that you are solely responsible for the trading decisions on your account. There is a very high degree of risk involved in trading. Any information and/or content is intended entirely for research, educational and informational purposes only and does not constitute investment or consultation advice or investment strategy. The information is not tailored to the investment needs of any specific person and therefore does not involve a consideration of any of the investment objectives, financial situation or needs of any viewer that may receive it. Kindly also note that past performance is not a reliable indicator of future results. Actual results may differ materially from those anticipated in forward-looking or past performance statements. We assume no liability as to the accuracy or completeness of any of the information and/or content provided herein and the Company cannot be held responsible for any omission, mistake nor for any loss or damage including without limitation to any loss of profit which may arise from reliance on any information supplied by Everest Fortune Group.
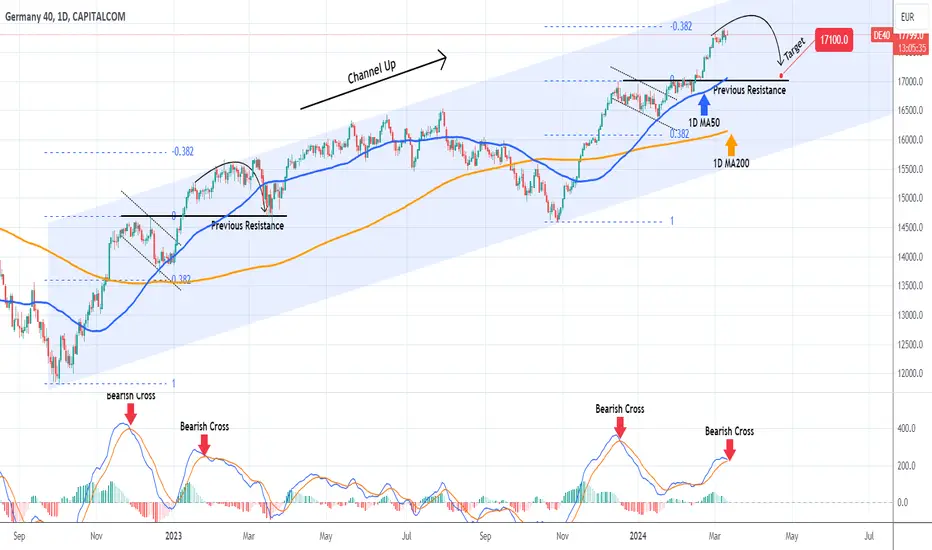
DAX Correction very likely. Target 17100.DAX (DE40) is extending a very strong Bullish Leg, which started after the previous short-term correction ended on January 17 2024 with a contact on the 1D MA50 (blue trend-line). This is part of an overall Bullish Wave that emerged on the latest Higher Low (October 27 2023) of the 1.5 year Channel Up.
However as the 1D MACD is about to form a Bearish Cross (which has been a sell signal within this pattern) while the price is already on the -0.382 Fibonacci extension level (which is where it was rejected on the previous Bullish Leg on March 07 2023), we are turning bearish on DAX on the medium-term, targeting the previous Resistance at 17100.
-------------------------------------------------------------------------------
** Please LIKE 👍, FOLLOW ✅, SHARE 🙌 and COMMENT ✍ if you enjoy this idea! Also share your ideas and charts in the comments section below! This is best way to keep it relevant, support us, keep the content here free and allow the idea to reach as many people as possible. **
-------------------------------------------------------------------------------
💸💸💸💸💸💸
👇 👇 👇 👇 👇 👇
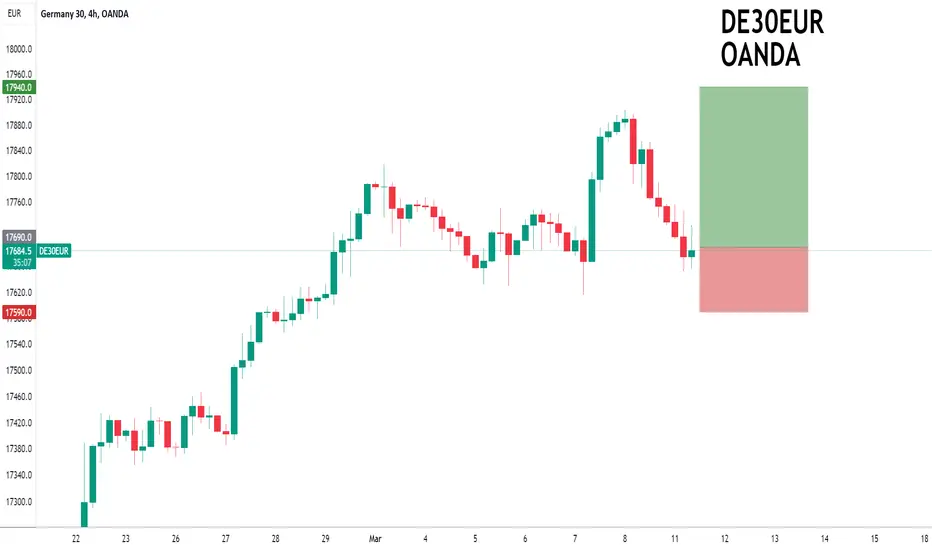
DAX to find support at market price?DE30EUR - 24h expiry
Price action resulted in a new all-time high at 17904.
We look to buy dips.
50 4hour EMA is at 17685.
The primary trend remains bullish.
Offers ample risk/reward to buy at the market.
We look to Buy at 17690 (stop at 17590)
Our profit targets will be 17940 and 17990
Resistance: 17760 / 17907 / 18000
Support: 17710 / 17618 / 17500
Risk Disclaimer
The trade ideas beyond this page are for informational purposes only and do not constitute investment advice or a solicitation to trade. This information is provided by Signal Centre, a third-party unaffiliated with OANDA, and is intended for general circulation only. OANDA does not guarantee the accuracy of this information and assumes no responsibilities for the information provided by the third party. The information does not take into account the specific investment objectives, financial situation, or particular needs of any particular person. You should take into account your specific investment objectives, financial situation, and particular needs before making a commitment to trade, including seeking advice from an independent financial adviser regarding the suitability of the investment, under a separate engagement, as you deem fit.
You accept that you assume all risks in independently viewing the contents and selecting a chosen strategy.
Where the research is distributed in Singapore to a person who is not an Accredited Investor, Expert Investor or an Institutional Investor, Oanda Asia Pacific Pte Ltd (“OAP“) accepts legal responsibility for the contents of the report to such persons only to the extent required by law. Singapore customers should contact OAP at 6579 8289 for matters arising from, or in connection with, the information/research distributed.
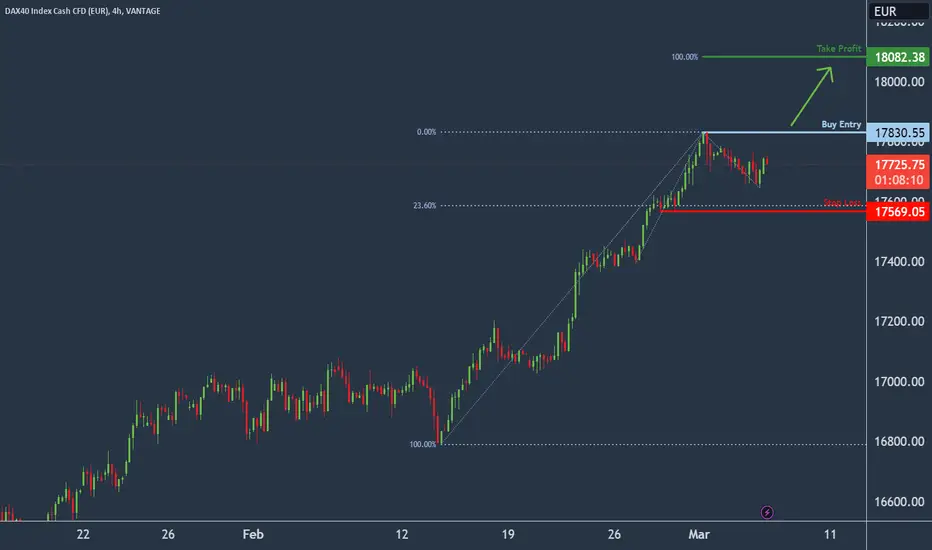
DAX H4 | Potential bullish breakoutThe DAX (GER40) could rise towards a potential breakout level and make a bullish continuation towards our take-profit target.
Entry: 17,830.55
Why we like it:
There is a potential breakout level (wait for 1-hour candle to close above 17,830.55 for a breakout confirmation)
Stop Loss: 17,569.05
Why we like it:
There is a pullback support that aligns with the 23.6% Fibonacci retracement level
Take Profit: 18,082.38
Why we like it:
There is a resistance that aligns with the 100.0% Fibonacci projection level
Please be advised that the information presented on TradingView is provided to Vantage (‘Vantage Global Limited’, ‘we’) by a third-party provider (‘Everest Fortune Group’). Please be reminded that you are solely responsible for the trading decisions on your account. There is a very high degree of risk involved in trading. Any information and/or content is intended entirely for research, educational and informational purposes only and does not constitute investment or consultation advice or investment strategy. The information is not tailored to the investment needs of any specific person and therefore does not involve a consideration of any of the investment objectives, financial situation or needs of any viewer that may receive it. Kindly also note that past performance is not a reliable indicator of future results. Actual results may differ materially from those anticipated in forward-looking or past performance statements. We assume no liability as to the accuracy or completeness of any of the information and/or content provided herein and the Company cannot be held responsible for any omission, mistake nor for any loss or damage including without limitation to any loss of profit which may arise from reliance on any information supplied by Everest Fortune Group.
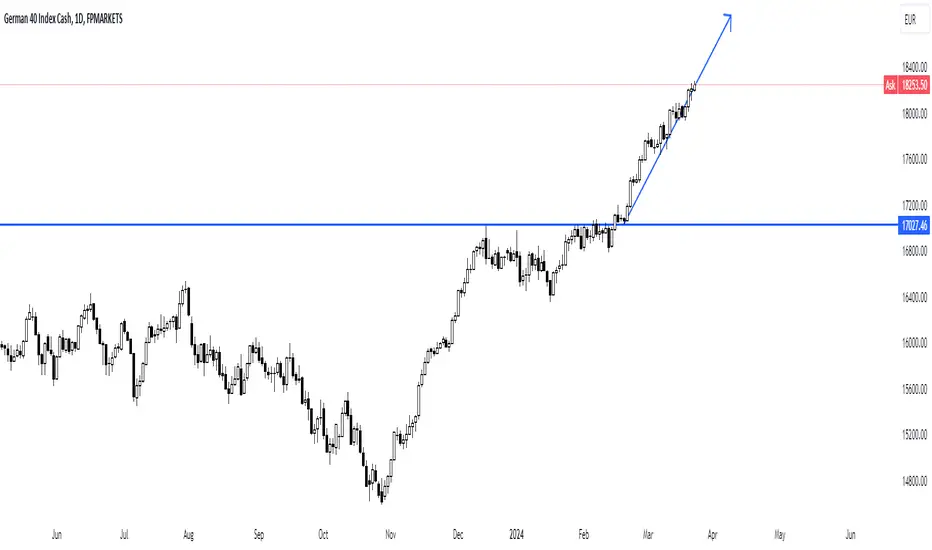
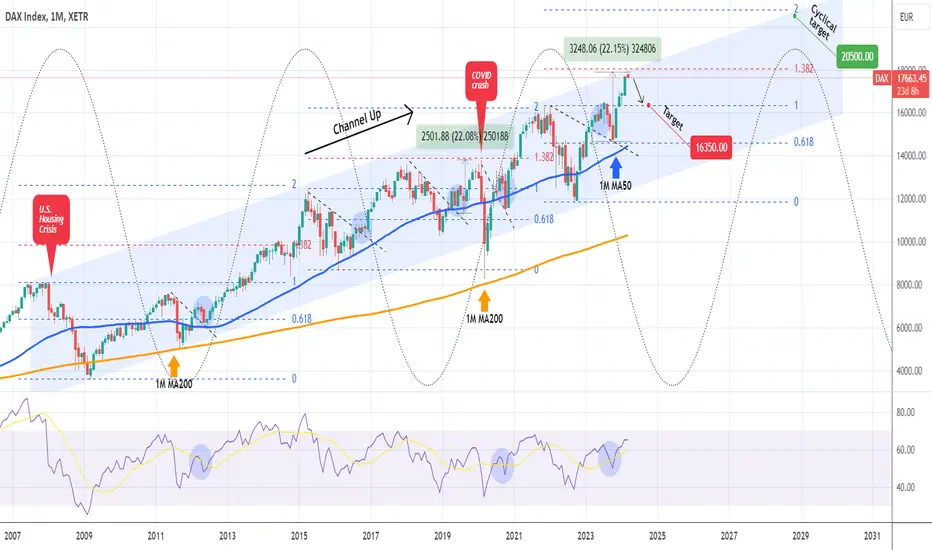
DAX Time to respect the 17-year Channel and correct.Exactly 3 months ago (December 06 2023, see chart below), we set a 17800 Target on DAX (DE40) and the index hit that level yesterday:
At the time DAX was the first major stock index to hit new All Time Highs (ATH) and as we mentioned it "sent a message to indices globally". And followed they did, as all markets followed this lead and rose aggressively.
This time however, DAX is sending a bearish signal as by hitting 17800 it reached the top (Higher Highs trend-line) of the 17-year Channel Up that started on the July 2007 High, right at the peak of the U.S. Housing Crisis.
At the same time it almost hit the 1.382 Fibonacci extension, which is a key level as every time the index (nearly) hit it (May 2014, January 2018, February 2020), it corrected by at least -15%. As a result we think a test of January's Low at 16350 would be a modest target, even though it might seem unrealistic under the current market sentiment. A -15% decline would even test the 1M MA50 (blue trend-line) for the first time since November 2022 and the post Inflation Crisis recovery.
Note that we currently only starting the 3rd Mega Cycle. Both previous 2 peaked their Higher Highs on the 2.0 Fibonacci extension (measuring from Sine Wave Top to Sine Wave Top). So on a multi-year basis, as investors we look to take advantage of these corrections and buy for an ultimate 2028 Target at 20500.
-------------------------------------------------------------------------------
** Please LIKE 👍, FOLLOW ✅, SHARE 🙌 and COMMENT ✍ if you enjoy this idea! Also share your ideas and charts in the comments section below! This is best way to keep it relevant, support us, keep the content here free and allow the idea to reach as many people as possible. **
-------------------------------------------------------------------------------
💸💸💸💸💸💸
👇 👇 👇 👇 👇 👇
DAX Trading plan based on the 1D MA50DAX (DE40) is on a short-term Channel Up, supported by the 1D MA50 (blue trend-line), which has held twice in the past month (January 17 and February 13). As long as it holds, we will most likely see a break of the long-term Channel Up, which in time could complete a +20.90% rise as the July 31 2023 High. In that case, we will target 17400 on the short-term.
If however the 1D MA50 breaks, we will open a sell and target the 1D MA200 (orange trend-line) at 16200. Based on the 1D RSI, which is showing a consolidation following a Channel Down, there are more probabilities of replicating the April - May 2023 bullish sequence.
-------------------------------------------------------------------------------
** Please LIKE 👍, FOLLOW ✅, SHARE 🙌 and COMMENT ✍ if you enjoy this idea! Also share your ideas and charts in the comments section below! This is best way to keep it relevant, support us, keep the content here free and allow the idea to reach as many people as possible. **
-------------------------------------------------------------------------------
💸💸💸💸💸💸
👇 👇 👇 👇 👇 👇

DAX: Market Top is being formed. DAX hit the HH trendline on a bullish 1D technical outlook (RSI = 59.185, MACD = 53.000, ADX = 25.248) but a Bearish Divergence RSI. The 1D CCI is repeating the May 19th-July 31st 2023 successive peak pattern on the HH that eventually corrected first to the 0.382 Fibonacci level and the 1D MA200 and then under the 0.618 Fibonacci level. Consequently, a crossing under the 1D MA50 will be the ideal sell signal to target the S1 level (TP = 16,350).
## If you like our free content follow our profile to get more daily ideas. ##
## Comments and likes are greatly appreciated. ##

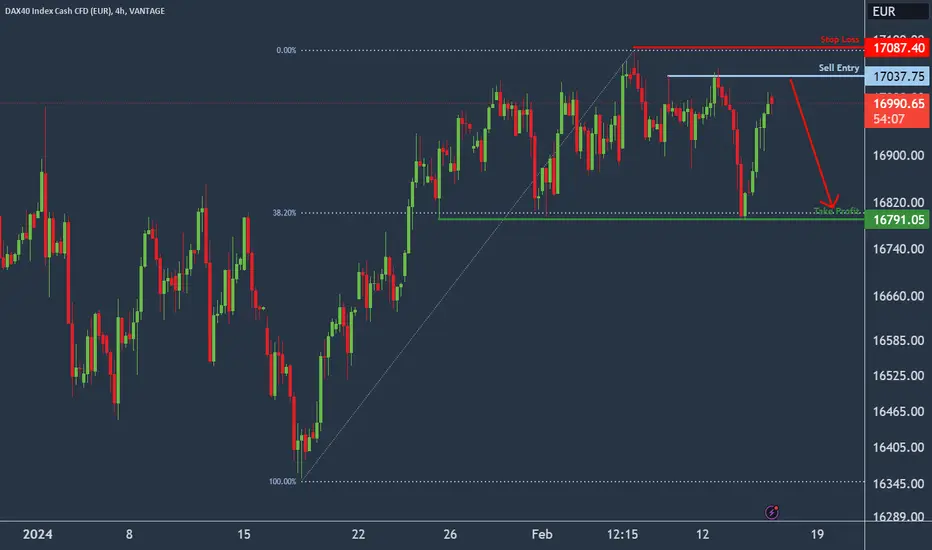
DAX H4 | Potential bearish reversalDAX (GER40) could rise towards a pullback resistance and potentially reverse off this level to drop towards our take-profit target.
Entry: 17,037.75
Why we like it:
There is a pullback resistance level
Stop Loss: 17,087.40
Why we like it:
There is a pullback resistance level
Take Profit: 16,791.05
Why we like it:
There is a pullback support that aligns close to the 38.2% Fibonacci retracement level
Please be advised that the information presented on TradingView is provided to Vantage (‘Vantage Global Limited’, ‘we’) by a third-party provider (‘Everest Fortune Group’). Please be reminded that you are solely responsible for the trading decisions on your account. There is a very high degree of risk involved in trading. Any information and/or content is intended entirely for research, educational and informational purposes only and does not constitute investment or consultation advice or investment strategy. The information is not tailored to the investment needs of any specific person and therefore does not involve a consideration of any of the investment objectives, financial situation or needs of any viewer that may receive it. Kindly also note that past performance is not a reliable indicator of future results. Actual results may differ materially from those anticipated in forward-looking or past performance statements. We assume no liability as to the accuracy or completeness of any of the information and/or content provided herein and the Company cannot be held responsible for any omission, mistake nor for any loss or damage including without limitation to any loss of profit which may arise from reliance on any information supplied by Everest Fortune Group.
DAX Will it drop at the top of the 1-year Channel Up?DAX (FDAX1!) is currently trading at the top (Higher Highs trend-line) of the Channel Up pattern that started on the December 20 2022 Low. This is a more than 1-year trading structure and as long as its stays intact, we should see a rejection below the 1D MA50 (blue trend-line) and towards the 1D MA200 (orange trend-line).
Based on the previous declines within the pattern, there are high probabilities of seeing a minimum of -6.50% pull-back. That gives us a Sell Target at 16000. The absolute bottom on the long-term based on the 2023 price action is the 1W MA100 (yellow trend-line), which formed the market Lows of March 20 2023 and October 27 2023.
If the index closes a 1D candle above the top (Higher Highs trend-line) of the Channel Up, then we will drop the sell and buy the break-out instead, targeting 17600, which would complete a +20.90% rise from the October Low, symmetrical to the rise on the December 20 2022 Low.
-------------------------------------------------------------------------------
** Please LIKE 👍, FOLLOW ✅, SHARE 🙌 and COMMENT ✍ if you enjoy this idea! Also share your ideas and charts in the comments section below! This is best way to keep it relevant, support us, keep the content here free and allow the idea to reach as many people as possible. **
-------------------------------------------------------------------------------
💸💸💸💸💸💸
👇 👇 👇 👇 👇 👇

a daily price action after hour update - daxGood evening and i hope you are well.
After such strong rallies, markets tends to form trading ranges instead of another trend in whatever direction. So today, we chopped back and forth. Which is bad for the bears because that means acceptance of higher prices. Only question is then, how high? Most indexes have obvious targets above, which i gave in my weekly outlook. I also said market is currently bullish and today further confirmed my thesis.
dax
Dax is inside a big triangle from the recent bull trend and the upper bear channel visible on the daily chart. Today was uneventful since we close 9 points above the open price. The tricky thing on a day like today is, that the 2 to 3 legged moves inside the range look strong with good looking signal bars that just turn around at support & resistance, tricking traders into believing a breakout is about to happen. That’s just something will learn to read with hard earned experience. Nothing else.
short term: sideways to up
medium-long term: down
trade of the day: short from the open to globex gap close and test of fridays open and the long above bar 55 to todays open price. that could have been 150-200 points

2024-01-18 - dax price action update
Good Morning,
i could see dax breaking out of this bull channel to rally upwards. I'd look only for longs here. Here is my recap from yesterday after hours to give more context:
Let’s look at the 1h tf because today closed 10 points above the opening price. That tell’s you enough. Opex sold off 100 points to eu open and bulls could not get this above 16560. Bears tried multiple times to push this below 16500 but every attempt was bought. One side tries to push the market into a direction just so many times before they give up. This brings us to an adjusted big lower bear channel line so market is free to move up imo. We will trade sideways to up in the globex session which would bring the 1h 20ema closer or we can get above it. More reasons why we market could go up. Bar 10 + 16 today formed a double bottom and bar 16 + 19 could already have set the new bull channel upwards. If you look at the daily chart, you can clearly see 3 pushes down and an expanding triangle. Lows from 2023-12-18 + 2024-01-05 + 2024-01-17. Do i have a short term bear case? Not really, i think the odds that we break below that channel and close low are below 25%.
short term: up
medium-long term: down

GER 40 H1 / SHORT TRADE PERSPECTIVE GER INDEX 💶💲Hello Traders!
This is my idea related to GER4 40. I see two resistance levels and I expect a bearish domination, taking into consideration the evolution of previous days, it looks very likely to go bearish.
I will set two targets, the first resistance and the second resistance level. I'm very curious about the move of the GER index this week.
Traders, if you liked my idea or if you have a different vision related to this trade, write in the comments. I will be glad to see your perspective.
____________________________________
Follow, like, and comment to see my content:
tradingview.sweetlogin.com

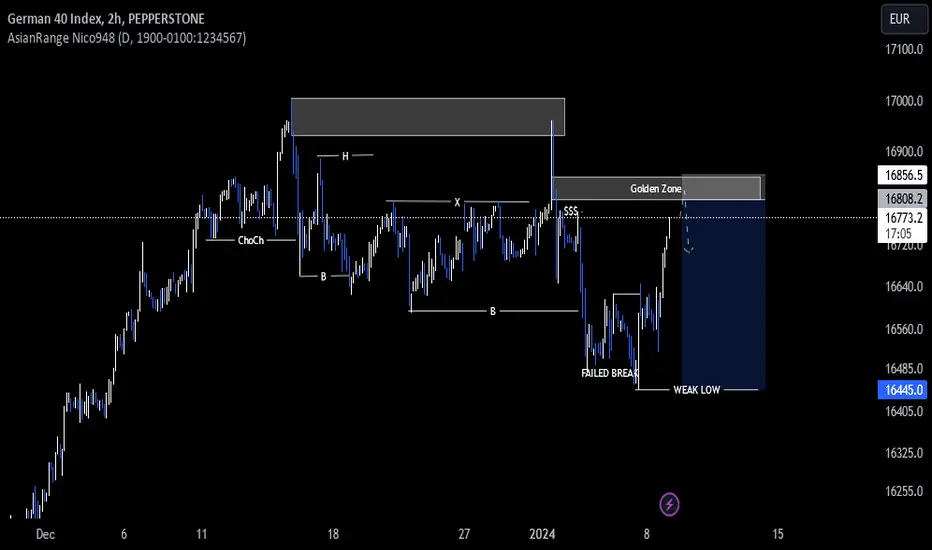
GER40 ideaAfter price broke structure to the downside, it retraced and retested a supply zone before preceding to break further structure with momentum. Before it broke the latest low, it formed liquidity right below a golden zone that it is currently retracing towards. It is this liquidity that it could use to fuel it's move to the downside to take out the latest weak low since it is now confirmed that price has just shifted to a bearish overflow.