Technical Analysis for GER40 (DAX) Closing Price: 23,372.80 (15th Aug 2025, 11:50 PM UTC+4)
Analysis Methods: Japanese Candlesticks, Harmonic Patterns (ABCD, M/W), Elliott Wave, Wyckoff, Gann Theory (Time/Square of 9/Angles), Ichimoku, RSI, Bollinger Bands, VWAP, Moving Averages (MA/EMA/SMA/WMA).
---------------------------------------------------------------------------------------------
1. Long-Term Trend (Weekly/Monthly)
Elliott Wave:
GER40 is likely in Wave 3 of a broader bull cycle (Wave 1 peak: 22,800, Wave 2 dip to 21,500).
Wave 3 Target: 24,000–24,500 (1.618 extension of Wave 1).
Gann Price Forecasting:
Square of 9: √23,372.80 ≈ 152.90 →
Resistance: 153² = 23,409 (immediate), 154² = 23,716 (swing target).
Support: 152² = 23,104 (daily pivot), 151² = 22,801 (Wyckoff accumulation zone).
Ichimoku (Monthly):
Tenkan/Kijun: Bullish (Tenkan: 22,900 > Kijun: 22,400).
Cloud: Price above thick Senkou Span (22,000–22,500) – structural bullishness.
Moving Averages:
Weekly SMA(100): 22,200 (major support).
Swing Outlook: Bullish. Wave 3 rally targets 24,000–24,500.
2. Medium-Term Swing (4H/Daily)
Harmonic Patterns:
Bearish ABCD on Daily:
A: 23,800 → B: 23,100 → C: 23,550 → D: 23,380–23,420 (1.272 BC extension).
Bullish Crab (W Pattern) forming near 23,100 (0.886 XA retracement).
Wyckoff Phase:
Testing at 23,400:
Upthrust rejection at 23,450 (15th Aug) on low volume.
Spring potential near 23,100 (accumulation signal).
Gann Theory:
Time Window: Aug 18–20 (Square of 9 date cluster) for breakout/reversal.
Price-Time Squaring: 23,372 aligns with Aug 15 – consolidation expected.
Gann Angle: 1x1 angle at 23,300 – close below accelerates selling.
Indicators:
RSI(14) + Bollinger Bands (Daily):
RSI: 64 (neutral, no divergence).
Price testing upper BB(20,2) at 23,450 – expansion hints at volatility.
VWAP (Weekly): 23,250 (swing support).
Swing Trade Setup:
Short near 23,400 (ABCD target) → Target 23,100. Stop-loss: 23,500.
Long near 23,100 (Crab + Gann 151² support) → Target 23,800. Stop-loss: 22,950.
3. Intraday Outlook (5M–4H)
Key Levels:
Resistance: 23,400 (Gann 1x1), 23,450 (weekly high).
Support: 23,300 (VWAP), 23,200 (Ichimoku cloud), 23,100 (psychological).
Indicators:
Ichimoku (1H):
Tenkan: 23,360, Kijun: 23,330 → Price above both (short-term bullish).
Cloud: Bullish (23,280–23,320) – strong support zone.
RSI + Bollinger Bands (4H):
RSI(14): 58 (neutral).
Price near mid-BB(20,2): 23,350 – break below signals bearish momentum.
VWAP + MAs:
VWAP: 23,340 (intraday pivot).
EMA(50): 23,310 (dynamic support).
Candlestick Patterns:
4H Shooting Star at 23,450 (15th Aug) → Bearish reversal confirmed.
1H Bearish Engulfing below 23,380 – adds downside pressure.
Gann Intraday Squaring:
Time Cycle: 8:00–10:00 AM CET (European open) for volatility.
Price Harmony: Close below 23,350 targets 23,300 → 23,250.
Intraday Trade Plan:
Sell below 23,350 → Target 23,300 (VWAP) → 23,250 (Ichimoku cloud).
Buy above 23,400 only with RSI <60 → Target 23,450.
Stop-Loss: 25–30 points risk.
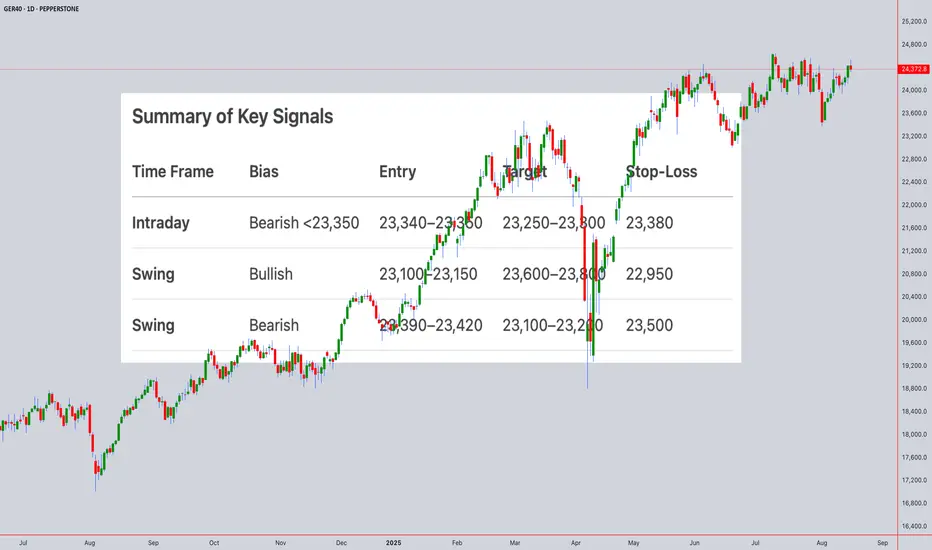
Summary of Key Signals
Time Frame Bias Entry Target Stop-Loss
Intraday Bearish <23,350 23,340–23,350 23,250–23,300 23,380
Swing Bullish 23,100–23,150 23,600–23,800 22,950
Swing Bearish 23,390–23,420 23,100–23,200 23,500
Critical Events Ahead:
Gann Reversal Window: Aug 18–20 (watch for Eurozone CPI/GDP data).
Daily Close >23,450 invalidates bearish ABCD and targets 23,716.
Risk Note: GER40 is sensitive to EU political/energy risks. Use tight stops during news events.
Disclaimer: Technical analysis is probabilistic and based on historical patterns. Fundamental drivers (e.g., ECB policy, German industrial data) may override technical signals. Always use risk management.
For those interested in further developing their trading skills based on these types of analyses, consider exploring the mentoring program offered by Shunya dot Trade . (world wide web shunya dot trade)
I welcome your feedback on this analysis, as it will inform and enhance my future work.
Regards,
Shunya.Trade
world wide web shunya dot trade
⚠️ Disclaimer: This post is educational content and does not constitute investment advice, financial advice, or trading recommendations. The views expressed here are based on technical analysis and are shared solely for informational purposes. The stock market is subject to risks, including capital loss, and readers should exercise due diligence before investing. We do not take responsibility for decisions made based on this content. Consult a certified financial advisor for personalized guidance.