DAX GER40 Technical Analysis: Advanced Weekly Forecast# DAX GER40 Technical Analysis: Comprehensive Multi-Timeframe Trading Strategy & Weekly Forecast
Current Price: 23,939.4 (As of August 30, 2025, 11:54 AM UTC+4)
Asset Class: GER40 / DAX Index
Analysis Date: August 30, 2025
---
Executive Summary
The DAX Index (GER40) continues to showcase remarkable resilience, trading near historic highs at 23,939.4 points. Our comprehensive technical analysis reveals the index has achieved significant milestones, with recent data showing the DE40 reaching 24,084 points on August 28, 2025, despite a monthly decline of 0.55%. The index maintains an impressive 27.35% year-over-year gain, positioning it as one of Europe's strongest performers. Technical confluence suggests potential for further upside toward the 24,500-25,000 zone, contingent on ECB policy support and improving macro conditions.
---
Multi-Timeframe Technical Analysis
Elliott Wave Analysis
The DAX appears to be progressing through a complex corrective pattern within a larger degree bull market:
Primary Count: Wave 5 of (5) within a Grand Super Cycle
Alternative Count: Expanding diagonal formation in final stages
Target Zone: 24,500-25,200 for primary wave completion
Critical Support: 22,800 (Wave 4 low invalidation level)
Long-term Projection: Extension toward 26,000-27,000 in 2026
Wyckoff Market Structure Analysis
Current price action aligns with Wyckoff's Re-accumulation Phase:
Phase: Late Stage Re-accumulation transitioning to Markup
Volume Analysis: Institutional accumulation evident on pullbacks below 23,500
Price Action: Higher lows formation with narrowing consolidation ranges
Composite Operator Activity: Large player absorption at key support levels
W.D. Gann Comprehensive Analysis
Square of 9 Analysis:
- Current price 23,939.4 positioned near critical Gann square resistance
- Next major Gann level: 24,649 (significant 360-degree rotation)
- Time and price confluence: September 21-28, 2025 (Autumn Equinox influence)
- Cardinal squares active at 24,000 and 24,321
Angle Theory Application:
- 1x1 Rising Angle Support: 23,400-23,500
- 2x1 Accelerated Angle: 24,200-24,400 (next resistance cluster)
- 1x2 Support Angle: 22,800-23,000 (major correction target)
Time Cycle Analysis:
- 90-day cycle completion due: Mid-September 2025
- Seasonal Gann Pattern: September-October strength historically favors DAX
- Next major time window: October 15-25, 2025
Price Forecasting:
- Immediate target: 24,200-24,400
- Extended target: 24,800-25,200
- Correction target (if triggered): 22,400-22,800
---
Japanese Candlestick & Harmonic Pattern Analysis
Recent Candlestick Formations (Daily Chart)
Doji Formation: August 28-29 showing indecision at resistance
Long Lower Shadows: Indicating strong buying support below 23,800
Hammer Patterns: Multiple occurrences near 23,500-23,600 support zone
Volume Confirmation: Bullish divergence with increasing volume on rallies
Harmonic Pattern Recognition
Bullish Gartley Pattern: Completion zone 23,200-23,400 (recent support test)
ABCD Extension: Active pattern targeting 24,480-24,650
Butterfly Pattern Potential: Watching for completion near 24,800-25,000
Fibonacci Harmony: 1.618 extension projects to 24,756 from recent swing low
Advanced Pattern Confluence
Three Drives Pattern: Currently in third drive toward 24,200+
Cypher Pattern: Potential reversal zone at 24,500-24,800
Bat Pattern Setup: Monitoring for completion signals above 24,000
---
Ichimoku Kinko Hyo Analysis
Current Cloud Structure (Daily Chart)
Price Position: Solidly above Kumo cloud (strongly bullish)
Tenkan-sen (9-period): 23,847 (short-term trend line)
Kijun-sen (26-period): 23,712 (medium-term trend support)
Senkou Span A: 23,780 (leading span A)
Senkou Span B: 23,445 (leading span B - key support)
Chikou Span: Positioned above price action confirming bullish momentum
Future Kumo (26 periods ahead):
- Thick ascending cloud structure indicating continued bullish bias
- Cloud support zone: 24,200-24,400 (future support levels)
- Kumo twist anticipated: Mid-October 2025
Ichimoku Trading Signals
TK Cross: Tenkan above Kijun (bullish signal active)
Price vs Cloud: Above cloud with strong momentum
Chikou Span: Clear above price history (confirmation signal)
---
Technical Indicators Deep Dive
RSI (Relative Strength Index) Analysis
Daily RSI: 64.8 (healthy bullish momentum, not overbought)
Weekly RSI: 58.3 (room for further upside)
4H RSI: 67.2 (approaching overbought but sustainable)
RSI Divergence: No bearish divergence detected, momentum intact
Bollinger Bands Analysis
Current Position: Price testing upper band resistance
Band Width: Expanding, indicating increasing volatility
BB Squeeze: Recent breakout from squeeze formation
%B Indicator: 0.78 (strong but not extreme reading)
VWAP Analysis (Volume Weighted Average Price)
Daily VWAP: 23,876 (current support level)
Weekly VWAP: 23,654 (key support zone)
Monthly VWAP: 23,423 (major trend support)
Volume Profile: High volume acceptance above 23,500
Moving Average Structure
10 EMA: 23,789 (immediate dynamic support)
20 EMA: 23,712 (short-term trend support)
50 SMA: 23,534 (intermediate support)
100 SMA: 23,287 (key trend support)
200 SMA: 22,845 (major trend support)
Moving Average Signals:
- All major EMAs in bullish alignment
- Golden Cross intact (50/200 cross maintained)
- Price above all key moving averages
---
Support & Resistance Analysis
Primary Resistance Levels
1. R1: 24,000 (psychological and Gann resistance)
2. R2: 24,200-24,400 (2x1 Gann angle cluster)
3. R3: 24,500-24,650 (Harmonic completion zone)
4. R4: 24,800-25,000 (Major extension target)
5. R5: 25,200-25,500 (Long-term Elliott Wave target)
Primary Support Levels
1. S1: 23,712 (Kijun-sen support)
2. S2: 23,500-23,600 (recent swing low zone)
3. S3: 23,200-23,400 (Harmonic support/Weekly VWAP)
4. S4: 22,800-23,000 (1x2 Gann angle/100 SMA)
5. S5: 22,400-22,600 (Major correction target)
Volume-Based Support/Resistance
High Volume Node: 23,400-23,600 (strong support zone)
Low Volume Gap: 24,100-24,300 (potential fast move zone)
Volume Resistance: 24,500+ (historical selling pressure)
---
Multi-Timeframe Trading Strategies
Scalping Strategy (5M & 15M Charts)
5-Minute Timeframe Approach:
Entry Signals: Pullbacks to 10 EMA with RSI <35
Profit Targets: 30-50 points per trade
Stop Loss: 20-25 points maximum risk
Volume Filter: Require above-average volume on entries
Time Window: Focus on 9:00-11:00 AM and 2:00-4:00 PM CET
15-Minute Scalping Strategy:
Range Trading: Current range 23,850-24,050
Breakout Method: Volume spike above 24,050 for continuation
Mean Reversion: Fade moves beyond 2.5 standard deviations from VWAP
Risk Management: Maximum 3 trades per session, 1:2 risk-reward minimum
Intraday Trading Framework (30M, 1H, 4H)
30-Minute Chart Strategy:
Trend Following: Long above 20/50 EMA confluence (23,750)
Pattern Trading: Flag and pennant formations near resistance
Target Methodology: Initial 24,100, extended 24,300
Risk Parameters: 40-60 point stops, 2.5:1 reward-to-risk
1-Hour Chart Approach:
Momentum Trading: MACD bullish crossovers above signal line
Support Bounces: Long positions from 23,650-23,750 zone
Resistance Testing: Monitor price action at 24,000 level
Session Management: European session focus (8:00 AM - 5:00 PM CET)
4-Hour Swing Setup:
Cloud Trading: Long positions on Ichimoku cloud support tests
Elliott Wave: Ride Wave 5 extensions toward 24,500+
Fibonacci Levels: Use 38.2% and 50% retracements for entries
Hold Duration: 2-5 days typical position holding period
Swing Trading Strategy (Daily, Weekly, Monthly)
Daily Chart Methodology:
Breakout Strategy: Long on sustained breaks above 24,000
Pullback Entries: Accumulate on tests of 23,400-23,600
Target Progression: 24,200 → 24,500 → 24,800
Position Sizing: Scale in on multiple time frame confirmations
Weekly Chart Analysis:
Primary Trend: Remains strongly bullish above 23,000
Swing Targets: 24,500-25,000 zone for major profit-taking
Risk Management: Weekly closes below 22,800 signal major reversal
Monthly Chart Perspective:
Long-term Trajectory: Multi-year uptrend intact
Secular Bull Market: Target zones 26,000-28,000 by 2026-2027
Major Support: 21,500-22,000 zone (not expected to test)
---
Day-by-Day Trading Plan: September 2-6, 2025
Monday, September 2, 2025
Market Status: Full trading session (US markets closed - Labor Day)
European Focus: Increased volatility potential due to US absence
Key Levels:
Resistance: 24,000, 24,150
Support: 23,780, 23,650
Trading Strategy:
Morning Session (9:00-12:00 CET): Range trading likely, fade extremes
Afternoon Session (13:00-17:30 CET): Reduced US influence, European-driven moves
Setup Focus: Long 23,750-23,850, Short above 24,100 without volume
Risk Management: Reduced position sizes due to holiday conditions
Tuesday, September 3, 2025
Market Outlook: Full global participation returns
Key Events: German economic data releases, ECB officials speeches
Strategy Framework:
Breakout Focus: Monitor 24,000 level for volume-confirmed breaks
Economic Data: German manufacturing PMI and employment data impact
Entry Zones: Long 23,800-23,900 on pullbacks
Target Areas: 24,150-24,300 on breakout scenarios
Risk Considerations:
- ECB policy communication sensitivity
- German economic data deviation impact
- Post-holiday volume normalization
Wednesday, September 4, 2025
Market Outlook: Mid-week momentum session with ECB focus
Key Events: Potential ECB policy signals, European inflation data
Trading Approach:
Trend Continuation: Above 23,850 favors further upside
Policy Sensitivity: ECB dovish signals bullish for DAX
Technical Setup: Watch for 1-2-3 reversal patterns at resistance
Volume Analysis: Require institutional participation for sustained moves
Thursday, September 5, 2025
Market Outlook: Pre-weekly close positioning
Focus Areas: Technical level respect, institutional flows
Strategy Elements:
Resistance Testing: 24,200-24,400 zone critical
Support Validation: 23,650-23,750 area strength
Pattern Completion: Monitor harmonic pattern developments
Risk-Off Scenarios: Safe-haven flows could pressure DAX
Friday, September 6, 2025
Market Outlook: Weekly close dynamics, position squaring
Key Considerations: NFP impact on global sentiment, weekly technical levels
Trading Framework:
Weekly Close: Above 23,900 maintains bullish structure
Profit-Taking: Expect some long position liquidation
Gap Risk: Prepare for weekend news flow impact
Setup Preservation: Maintain positions with weekly support above 23,700
---
Macroeconomic & Policy Considerations
European Central Bank Policy Impact
The ECB's monetary policy stance remains crucial for DAX performance. Recent ECB decisions show the Governing Council decided to lower the three key ECB interest rates by 25 basis points in March 2025, with domestic price pressures continuing to ease, with wages growing more slowly. This dovish stance supports equity valuations and German corporate profitability.
German Economic Outlook
The German economic environment presents mixed signals. While economic activity is expected to broadly stagnate in 2025 and trade tensions are set to significantly weigh on exports, there are positive factors including Germany's fiscal stimulus supporting better growth prospects.
Eurozone Growth Projections
The broader eurozone context shows Real GDP projected to grow by 0.9% in 2025, 1.1% in 2026 and 1.3% in 2027, with EA GDP growth to average 0.9% in 2025 and accelerate to 1.3% in 2026.
Key Risk Factors
1. Trade Policy Uncertainty: Trade policy uncertainty over recent months is expected to reduce global growth
2. Global Trade Tensions: Ongoing US-China trade dynamics affecting European exports
3. ECB Policy Divergence: Potential policy normalization pressures
4. Geopolitical Risks: Eastern European tensions and energy security concerns
---
Sector Analysis & DAX Components
Best Performing Components
Current analysis shows the champion of GERMAN STOCK INDEX (DAX) is XETR:ENR — it's gained 265.49% over the year, indicating strong sectoral divergence within the index.
Sector Rotation Implications
Technology Sector: Leading performance driving index higher
Industrial Sector: Mixed performance due to export pressures
Financial Sector: Benefiting from ECB policy normalization expectations
Consumer Discretionary: Supported by potential wage growth and consumer spending
---
Risk Management Framework
Position Sizing Guidelines
Scalping Positions: 0.5-1% account risk per trade
Intraday Trades: 1-2% account risk maximum
Swing Positions: 2-3% account risk per position
Maximum Exposure: 8% total DAX-related risk at any time
Stop-Loss Protocols
Scalping: 20-30 points maximum loss
Intraday: 50-80 points based on volatility
Swing Trading: Below key support levels (23,400 for current longs)
Technical Stops: Below major moving averages and pattern invalidation levels
Profit-Taking Strategy
Scaling Approach: Take 40% at first target, 35% at second target, hold 25% for extensions
Trailing Stops: Implement after 2:1 favorable movement
Time-Based Exits: Close positions before major ECB announcements
Pattern-Based Exits: Honor harmonic pattern completion zones
---
Weekly Outlook Probability Analysis
Bullish Scenario (Probability: 65%)
Catalysts:
- ECB maintains dovish policy stance
- German economic data shows stabilization signs
- Technical breakout above 24,000 with volume
- US-Europe trade tensions remain contained
Price Targets:
- Initial: 24,200-24,400
- Extended: 24,500-24,800
- Optimistic: 25,000+
Neutral/Consolidation Scenario (Probability: 25%)
Characteristics:
- Range-bound trading between 23,600-24,200
- Mixed economic signals from Germany
- ECB policy uncertainty
- Technical indecision at resistance levels
Trading Range:
- Upper Bound: 24,100-24,200
- Lower Bound: 23,500-23,600
- Strategy: Range trading, fade extremes
Bearish Scenario (Probability: 10%)
Risk Factors:
- Significant deterioration in German economic data
- ECB hawkish surprise or policy error
- Major geopolitical shock
- Technical breakdown below 23,400
Downside Targets:
- Initial: 23,000-23,200
- Extended: 22,600-22,800
- Crisis: 22,000-22,400
---
Advanced Trading Techniques
Correlation Analysis
EUR/USD Impact: Strong positive correlation (0.72)
US500 Relationship: Moderate correlation (0.58) with divergence potential
Bond Yields: German Bund yields inverse relationship
Commodity Exposure: Energy prices correlation through industrial components
Options Market Insights
Put/Call Ratio: Currently neutral, no extreme positioning
Options Skew: Slight put premium indicating downside hedging
Gamma Exposure: Positive gamma above 23,800, negative below
Key Strike Levels: 24,000 calls, 23,500 puts show high open interest
Institutional Flow Analysis
Foreign Investment: Positive European equity flows from US institutions
Pension Fund Activity: Rebalancing flows supporting DAX components
Hedge Fund Positioning: Net long but not extreme levels
ETF Flows: Consistent inflows into German equity ETFs
---
For individuals seeking to enhance their trading abilities based on the analyses provided, I recommend exploring the mentoring program offered by Shunya Trade. (Website: shunya dot trade)
I would appreciate your feedback on this analysis, as it will serve as a valuable resource for future endeavors.
Sincerely,
Shunya.Trade
Website: shunya dot trade
---
*This analysis is for educational purposes only and does not constitute investment advice. Always implement proper risk management and consult with qualified financial professionals before making investment decisions.* Disclaimer: This post is intended solely for educational purposes and does not constitute investment advice, financial advice, or trading recommendations. The views expressed herein are derived from technical analysis and are shared for informational purposes only. The stock market inherently carries risks, including the potential for capital loss. Therefore, readers are strongly advised to exercise prudent judgment before making any investment decisions. We assume no liability for any actions taken based on this content. For personalized guidance, it is recommended to consult a certified financial advisor.
---
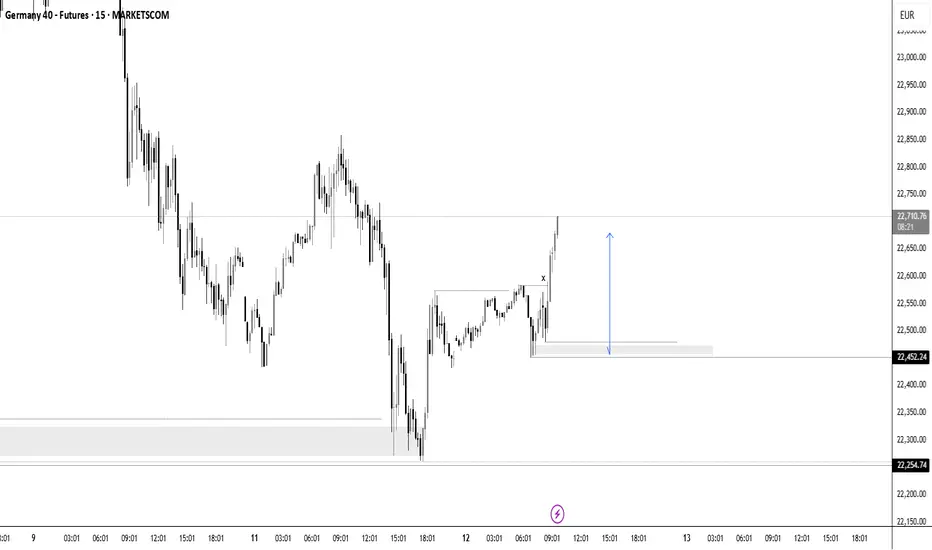
Germany40
DAX is forming an interesting short-term patternLooking at the technical picture of DAX, we can see that the German index seems to be preparing for a breakout. Maybe Powell's speech could be that catalyst? Let's find out.
XETR:DAX
MARKETSCOM:DE30
Let us know what you think in the comments below.
Thank you.
75.2% of retail investor accounts lose money when trading CFDs with this provider. You should consider whether you understand how CFDs work and whether you can afford to take the high risk of losing your money. Past performance is not necessarily indicative of future results. The value of investments may fall as well as rise and the investor may not get back the amount initially invested. This content is not intended for nor applicable to residents of the UK. Cryptocurrency CFDs and spread bets are restricted in the UK for all retail clients.

Breakout Alert! Germany 40 Targeting 25400 – Join the Robbery⚡GERMANY 40 INDEX CFD HEIST PLAN⚡
💸 Thief Trader Robbery Blueprint 💸
🎭 Dear Ladies & Gentleman, my Thief OG’s 🕶️🕵️♂️,
Welcome to another market heist – this time we’re targeting the GERMANY 40 INDEX CFD vault!
🚀 Plan: Bullish Breakout Robbery
The lock is weak around 24,500.0 ⚡ – once that vault door cracks open, we raid in style with layer entries.
🔑 Thief Layer Entry Method:
📍 First entry on breakout @ 24,500.0
📍 Layer extra buy limits @ 24,400.0 / 24,300.0 / 24,200.0 (stack your orders like pro robbers 😈)
👉 You can increase your layers depending on your appetite for stolen cash 💰.
🛑 Stop Loss (SL):
This is the Thief SL → @ 24,000.0 after breakout confirmation.
📌 Adjust your SL with caution, OG’s, depending on your risk & strategy. Protect the loot at all costs 🏴☠️.
🎯 Target (TP):
⚠️ Police barricade spotted @ 25,500.0 🚔🚨
👉 Escape before the sirens – cash out at 25,400.0 and vanish with the bags 🎒💸.
🏆 Thief Trader Reminder
📌 Stick to the layering strategy – multiple entries spread like a thief’s toolkit.
📌 Manage risk like a pro robber – don’t get caught with greedy hands.
📌 Escape clean – profit secured before the market traps you!
🔥💎 Support the Thief Gang by smashing that Boost Button 💥
Let’s keep robbing the markets together – smooth, stylish, and profitable.
Every heist, every day – Thief Trading Style. 🏆🕶️💰🚀
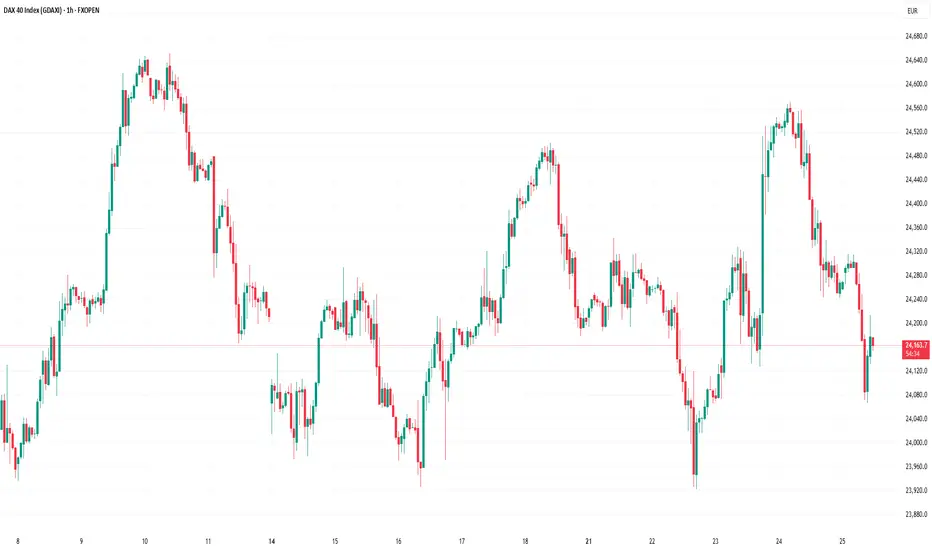
DAX testing supportCould the DAX bounce back here after starting the day lower?
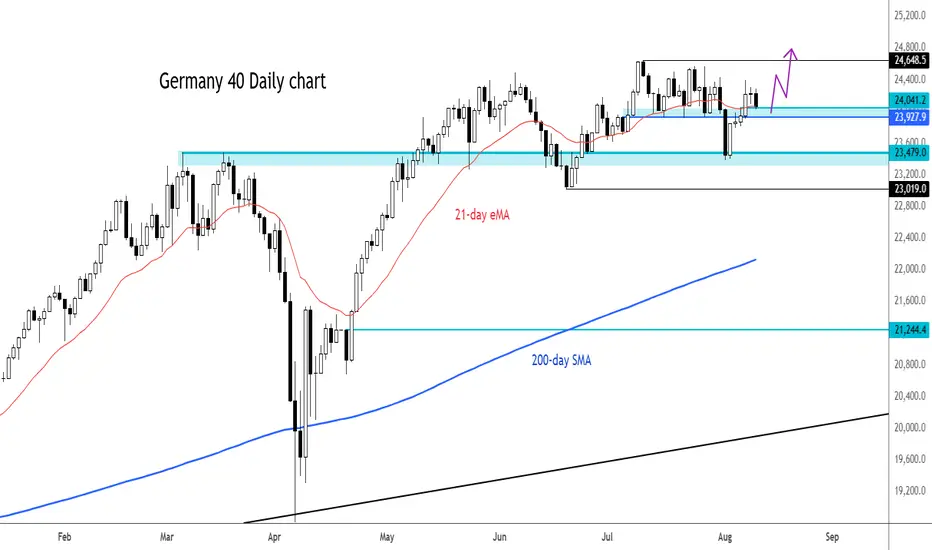
At the time of writing, the German benchmark index was testing key short-term support between 23,928 to 24,041. This area was previously resistance while the 21-day exponential average also comes into play here.
if we see a bounce here then a new all-time high could be on the cards. Else, a potential break down could target the old support and resistance range around 23,500.
By Fawad Razaqzada, market analyst with FOREX.com
Rob the DAX! GER40 Bullish Mission Begins Now!🏴☠️GER40 Bullish Vault Heist! Target: 25400 🎯💼
🚨Mission Briefing: Robbery in Progress - DE40 / Germany40 Index Heist!
🎯 Plan: Bullish
🗂️ Asset: DE40 / GER40 “Germany40” Index
📦 Strategy: Thief’s signature Layered Limit Orders 🧱 (Multi-entry precision loading)
🔑 Entry Point:
"The vault is open 24/7! Thief goes in anytime 🔓💰"
Place multiple buy limit orders at recent swings / lows on the 15m-30m chart.
📲 Tip: Set alerts at breakout zones. Be early. Be greedy.
🚨 Stop Loss:
🎯 SL at 23,300 🔐 – beneath 4H structure (swing low wick-based).
Adjust SL based on lot size and number of active entries.
🏆 Escape Point (Target):
💼 25,400 = Target stash 💰
🔥 Use Trailing SL and ride the wave – exit before the trap if market hesitates!
📈 Scalpers / Swingers Alert:
💎 Only Long-side loot allowed!
💸 Small capital? Join the swing team 🚀
💰 Big capital? Front-run the breakout!
🎯 Trailing SL = Smart thieves protect profits.
🧠 Why Bullish?
The index is warming up after consolidation. Neutral bias flipping bullish 🔄 due to:
📰 Weakening macro shock absorbers
💣 Risk appetite reviving
💡 Institutional positioning + COT shift
🔄 USD reaction + EU equity flow
💼 Check all macro + intermarket juice for full confidence 📊🔗
⚠️ Risk Management Tips for Robbers:
🕰 Avoid news hour trades
🔄 Use Trailing SL always
📉 Don't chase… let the market come to you
👀 Eyes on economic calendar and VIX movement
❤️ Support the Robbery Crew!
💥 Hit that BOOST button if you love making money the Thief Way 🏴☠️
🎯 Help us grow the robbery empire & take over the charts 📈💰
🧨 Another Heist Plan coming soon! Stay sneaky, stay funded 🤑🐱👤💼
#ThiefTrader #GER40Plan #IndexHeist #LayeredLoot #MarketRobbery #FTSEStyleRobbery

GER40 in Motion: This Setup Speaks Volumes 🌅 Good morning, my friends,
I’ve put together a fresh GER40 analysis just for you. Even if the 1-hour timeframe shows some upward momentum, I fully expect the price to reach my target level of **24,050**.
I'm holding firm until that level is hit.
Every single like from you is a massive source of motivation for me to keep sharing analysis. Huge thanks to everyone supporting with a tap!
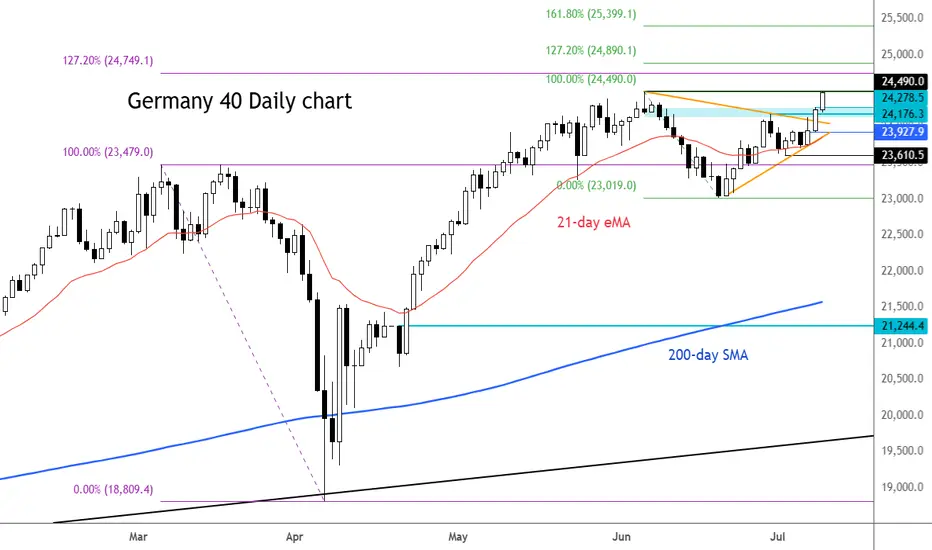
The DAX Index Is Losing Its Bullish MomentumThe DAX Index Is Losing Its Bullish Momentum
At the end of May, we noted that the German stock index DAX 40 was exhibiting significantly stronger performance compared to other global equity indices. However, we also highlighted the 24,100 level as a strong resistance zone.
Two months have passed, and the chart now suggests that bearish signals are intensifying.
From a technical analysis perspective, the DAX 40 formed an ascending channel in July (outlined in blue). However, each time the bulls attempted to push the price above the 24,460 level (which corresponds to the May high), they encountered resistance.
It is worth noting the nature of the bearish reversals (indicated by arrows) – the price declined sharply, often without intermediate recoveries, signalling strong selling pressure. It is likely that major market participants used the proximity to the all-time high to reduce their long positions.
From a fundamental standpoint, several factors are weighing on the DAX 40:
→ Ongoing uncertainty surrounding the US–EU trade agreement, which has yet to be finalised (with the deadline approaching next week);
→ Corporate news, including disappointing earnings reports from Puma, Volkswagen, and several other German companies.
Given the above, it is reasonable to assume that bearish activity could result in an attempt to break below the lower boundary of the ascending blue channel.
This article represents the opinion of the Companies operating under the FXOpen brand only. It is not to be construed as an offer, solicitation, or recommendation with respect to products and services provided by the Companies operating under the FXOpen brand, nor is it to be considered financial advice.
Before GER40 Roars, It WhispersHey guys👋
Here’s the latest GER40 analysis I’ve prepared for you:
🔻 If the **24,179** support level breaks, the next target is **23,972**.
🔺 If the **24,373** resistance level breaks, the next target is **24,511**.
🎯 I’ve shared two key levels with you — please monitor them carefully.
Every like from you gives me a big boost of motivation 🙏
Thanks to everyone who supports my work — truly appreciate it 💙

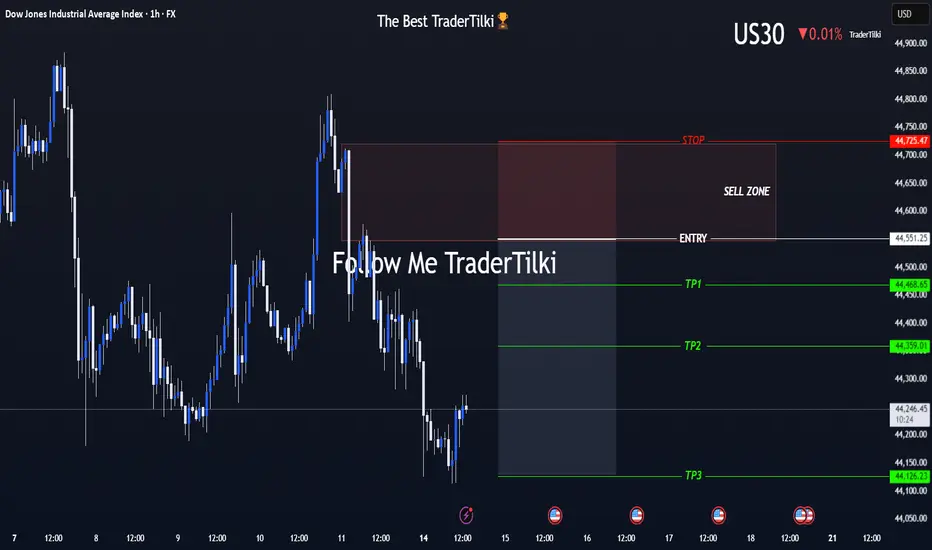
US30 (Dow Jones) Is On My Radar — The Moment’s Getting Close!Hey Guys,
I've marked my sell zone on the Dow Jones (US30) chart.
Once price reaches my entry range, I’ll be jumping into this high-probability trade setup.
🚪 Entry Levels: 44,551 – 44,632 – 44,677
🛑 Stop Loss: 44,725
🎯 Targets:
• TP1: 44,468
• TP2: 44,359
• TP3: 44,126
📐 Risk-to-Reward Ratio: Approximately 2.41 from the 44,551 entry
Your likes and support are what keep me motivated to share these analyses consistently.
Huge thanks to everyone who shows love and appreciation! 🙏
DAX Stock Index Declines Amid Trump Tariff ThreatDAX Stock Index Declines Amid Trump Tariff Threat
The German stock index DAX 40 (Germany 40 mini at FXOpen) is showing bearish momentum at the start of the week. This may be driven by a combination of factors, the most significant of which is the threat of tariffs on Europe from the United States.
According to Reuters, US President Donald Trump has announced a 30% tariff on most goods from the EU, set to come into effect next month. However, the decision is not yet final. Analysts caution against premature panic, suggesting that negotiations could still result in a trade agreement — nonetheless, the chart reflects a sense of unease among investors.
Technical Analysis of the DAX 40 Chart
The price surge in July above the previous all-time high near the 24,500 level appears to be a false bullish breakout — a sign of market weakness.
Buyers may hope that the market will find support at the former resistance line (marked in red), drawn through the local highs of June.
However, if news surrounding the US–EU negotiations turns negative, the DAX 40 index could fall towards the 23,650–23,750 support area, which is reinforced by the lower boundary of the medium-term ascending channel.
This article represents the opinion of the Companies operating under the FXOpen brand only. It is not to be construed as an offer, solicitation, or recommendation with respect to products and services provided by the Companies operating under the FXOpen brand, nor is it to be considered financial advice.

“GER30 Bull Vault Heist: The Ultimate Loot Plan”💎“The Bull Vault Job: GER30 Heist Blueprint”💎
🌟Hi! Hola! Ola! Bonjour! Hallo! Marhaba!🌟
Welcome fellow Chart Raiders & Market Hackers 🧠💰—your next mission is here.
We’re pulling off a precision breakout plan on GER30 / DE30 "Germany30" — a market vault bursting with bullish loot. This isn’t just trading... this is Thief Trading Style™ — where smart analysis meets slick execution. 👨💻💎📊
💼 The Heist Plan:
📈 Entry: Market shows a wide open vault. Ideal long setups near the last swing low (15–30m for sniper entries). Don’t chase—wait for the retrace.
🛑 Stop Loss: Guard your getaway! Use recent swing lows on 4H (e.g. 24170). Customize based on your risk profile & lot sizes.
🎯 Target: Aim for 24720 or EXIT before the cops (a.k.a. reversal zones) show up. Always secure your gains.
📌 Scalpers’ Signal: Stay LONG-only. Follow swing traders if low on ammo (capital). Use trailing SLs like tripwires to protect your profits.
📊 Market Heat Check: The DE30 is radiating bullish pressure 💥—fueled by fundamentals, macro trends, COT positions, sentiment indicators, and intermarket clues. We read between the lines. You just follow the blueprint. 🧠
🚨 Pro Tips:
Avoid entering trades during high-impact news.
Manage risk like a vault door—solid, tested, and ready.
💖 Smash that Boost Button 💖 if you believe in the Art of Legal Market Extraction™ — it supports the plan, strengthens the crew, and keeps this hustle alive!
🎭 More blueprints & breakdowns coming soon. Stay locked in...
Until the next market hit, trade sharp, trade smart. 🐱👤📈💰
DAX flirts with ATHs againAfter breaking out of the triangle formation a couple of days ago, the DAX is now flirting with the previous record hit in early June at 24490. With Trump's tariffs uncertainty at the forefront again, there is a possibility we could potentially see a double top or a false break reversal formation here, so do watch out for that. However, we will continue to focus on the long side until we see an actual, confirmed, reversal. With that in mind, dip-buying remains the preferred trading strategy.
Key support levels to watch:
24,278, marking yesterday's high
24,176, broken resistance from last week
23,927, the base of this week's breakout
The technical picture would turn bearish in the event we go back below the support trend of the triangle pattern.
In terms of upside targets,
24,750, marking the 127.2% Fib extension of the big drop from March
24,890, marking the 127.2% Fib extension of the most recent drop from June high
25,000, the next big psychological level
By Fawad Razaqzada, market analyst with FOREX.com
Is the Trend Intact? Key Signal Emerging on GER40 4H ChartHey Guys,
We could see a pullback on the GER40 index from the 24,060 level. If that happens, the 23,824 – 23,675 zone could present a potential buying opportunity. The primary trend still points upward, and bullish momentum remains intact.
Also worth noting—the rise in volume is quite striking, which supports my target level of 24,500.
I meticulously prepare these analyses for you, and I sincerely appreciate your support through likes. Every like from you is my biggest motivation to continue sharing my analyses.
I’m truly grateful for each of you—love to all my followers💙💙💙
Quick take on DAXTariffs, no tariffs, tariffs, no tariffs... Let's look at the technical picture...
XETR:DAX
MARKETSCOM:GERMANY40
Let us know what you think in the comments below.
Thank you.
77.3% of retail investor accounts lose money when trading CFDs with this provider. You should consider whether you understand how CFDs work and whether you can afford to take the high risk of losing your money. Past performance is not necessarily indicative of future results. The value of investments may fall as well as rise and the investor may not get back the amount initially invested. This content is not intended for nor applicable to residents of the UK. Cryptocurrency CFDs and spread bets are restricted in the UK for all retail clients.

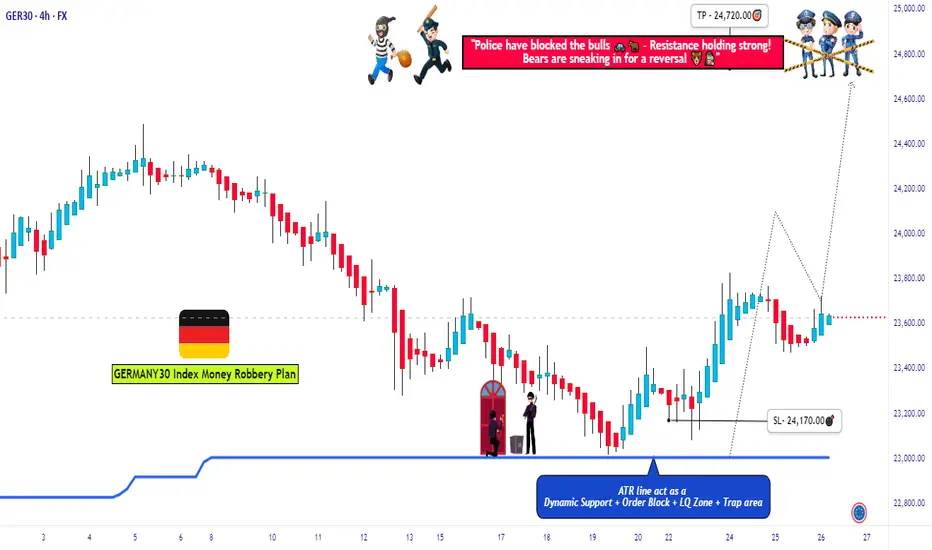
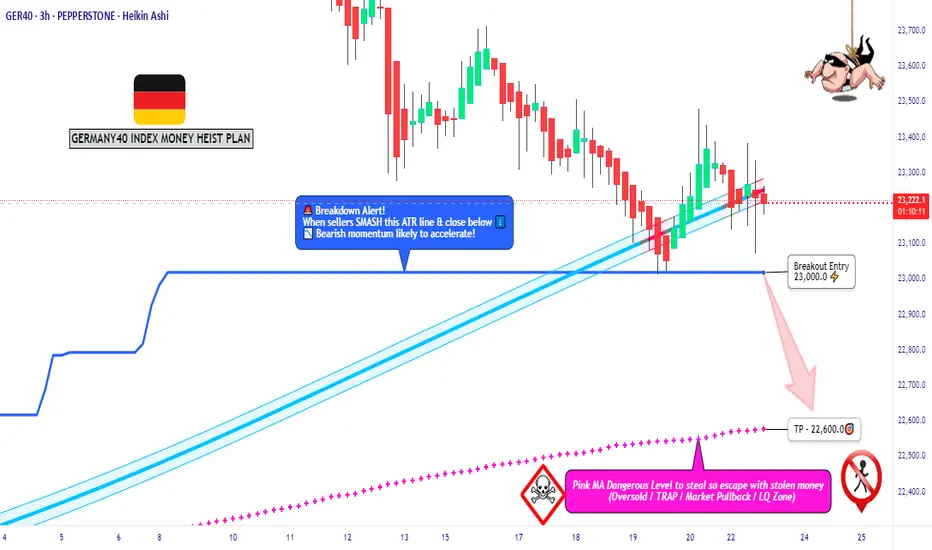
“GER40 Heist in Progress – Bearish Blueprint Deployed!”🦹♂️💼 “Operation: Black Forest Heist” – DAX Day/Swing Trade Plan 💼🦹♀️
📍Thief Trading Style | CFD Tactical Chart Blueprint | GER40 Recon Mission
🌟Hi! Hola! Ola! Bonjour! Hallo! Marhaba!🌟
Dear Money Movers, Risk Raiders & Precision Planners 🧠💸,
Suit up for a clean-cut operation on the Germany 40 (GER40) Index! 🎯
With our sharp-edged Thief Trading blueprint 🔪, we’re scanning for a potential bearish trap—market’s heating up with oversold setups and momentum cracks near key resistance. Watch for the green MA zone—we suspect it's where bullish imposters hide. 🕵️♂️📉
🔓 Entry Plan
“The vault’s cracking... get ready!”
Wait for price to breach the ATR Line (23000.0). Once the level is crossed cleanly, it’s go-time:
🧨 Use Sell Stop orders just under the breakout
🎣 Or hunt pullback setups on 15m/30m charts with Sell Limit entries at resistance
🔐 Stop-Loss Strategy
Keep it tight. Protect your loot.
🚧 Place SL around swing high/low on the 4H chart (e.g. 23400.0)
⚖️ Adapt SL based on lot size, risk appetite, and number of entries
🎯 Target Zone
Mission Objective: 22600.0
Or exit earlier if the security alarm (price action shift) starts ringing. Don't get greedy—get out smart. 💼🚪💨
📉 Market Outlook:
Current trend: Neutral but suspiciously wobbly – early signs of bearish dominance. 🐻
This trade aligns with multiple signals:
📊 Technical: Consolidation near highs
💼 Fundamental: Macro & news risks
🧠 Sentiment: Crowd leaning long = opportunity for reversal
📰 Caution Note – News Events = Laser Tripwires
Stay sharp during releases!
Avoid new setups when big headlines drop
Use trailing stops to secure gains on running trades
Position smart, manage tighter, act quicker 🕶️
💥 Smash that Boost Button if this plan sharpens your edge or adds value to your mission! 💥
Together, we move like shadows and strike like lightning—Thief Traders never miss a clean setup.⚔️🕵️♀️
Stay tuned for the next raid… the market’s full of opportunities waiting to be unlocked. 🗝️🚀
#004 DAX GERMANY 40: LONG Opportunity
GERMANY 40 – Possible Daily Reversal Starting: LONG on Strategic Support
Hello, I am Trader Andrea Russo, Founder of the SwipeUP Élite FX Method, and today I want to point out this investment on Germany 40 (DAX), in a long configuration from the 23,345 area.
🔍 Technical Context
In recent days, the DAX has undergone a strong correction that has brought the price from 24,800 to test the lows in the 23,200 area. This area corresponds to a long-term daily support level, already used in the past for institutional accumulations.
The price generated a strong bearish spike right at the opening of the cash session, but without closing below the previous lows. This behavior is often indicative of a pre-reversal bearish manipulation.
Confirming this scenario, a double bottom pattern has formed with positive divergence on the 8H and daily cyclical oscillators. In addition, volumes are growing right on the support: a typical signal of an invisible accumulation phase by institutional operators.
✅ Trade Strengths
Daily static support confirmed at 23,200–23,300, already defended several times in the past.
Manipulative spike evident in the first hour of cash opening, followed by rejection of the lows.
Bullish divergence on the cyclical indicators (WT_CROSS) in H8.
Favorable risk/reward ratio (~3.6:1), with well-defined technical stop loss.
Volatility under control: the VIX is stable and the US session opened without a selloff.
Neutral/positive macro environment: weak euro, expectations of monetary easing, low pressure on bonds.
Derivatives sentiment favorable: open interest rising in the 23,300–23,400 area on DAX futures.
🎯 Operating Levels
ENTRY: 23,345
STOP LOSS: 23,170
TAKE PROFIT: 24,007
📌 This positioning allows you to operate with limited risk and a realistic objective, perfectly compatible with standard technical movements on the German index in 2–3 days.
⏱️ Expected Timings
First directional candle expected within 8–16 hours (1–2 H8 candles).
Estimated duration of the trade: between 48 and 72 hours to reach the target.
🧠 Operating Conclusion
The long investment on DAX from 23,345 represents one of the clearest technical configurations seen in the last week on European indices.
The simultaneous presence of cyclical signals, manipulation, structure and static support offers a high probability of success.
The final target at 24,007 is technically and statistically achievable with rigorous management.
💬 Leave a like if you want to receive the 8H analysis update and comment your vision on Germany 40.
🔔 Follow the profile to not miss the next multi-asset updates!
GER40 Trading Plan: Ride the Wave or Get Trapped?🚨 DE40 Heist Alert: The Bullish Breakout Robbery Plan (Swing & Scalp Strategy) 🚨
🌟 Hi! Hola! Ola! Bonjour! Hallo! Marhaba! 🌟
Attention Money Makers & Market Robbers! 🤑💰💸
Based on the 🔥Thief Trading Style🔥, here’s our master plan to loot the DE40 / GER40 "Germany40" Index. Follow the strategy on the chart—focusing on LONG entries—and escape near the high-risk Red Zone. This area is overbought, consolidating, and a potential reversal trap where bears lurk. 🏆 Take profits fast—you’ve earned it! 💪
🎯 Heist Entries:
📈 Entry 1: "The Breakout Heist!" – Wait for Resistance (24200) to break, then strike! Bullish profits await.
📈 Entry 2: "Big Players’ Pullback!" – Jump in at 23300+ for a safer steal.
🔔 Pro Tip: Set a chart alert to catch the breakout instantly!
🛑 Stop Loss Rules:
*"Yo, listen! 🗣️ If you’re entering with a buy-stop, DON’T set your SL until AFTER the breakout. Place it at the nearest swing low (4H timeframe) or wherever your risk allows—but remember, rebels risk more! 🔥"*
🏴☠️ Target: 24,800
🧲 Scalpers: Only play LONG! Use trailing SL to lock in profits. Big wallets? Go all in. Small stacks? Join the swing heist!
📊 Market Pulse:
The DE40 is neutral but primed for bullish momentum. Watch:
Fundamentals (COT, Macro, Geopolitics)
Sentiment & Intermarket Trends
Positioning & Future Targets
📌 Check our bioo linkks for deep analysis! 🔗🌍
⚠️ Trading Alert:
News = Volatility! Protect your loot:
Avoid new trades during major news
Use trailing stops to secure profits
💥 Boost This Heist!
Hit 👍 & 🔄 to strengthen our robbery crew! Let’s dominate the market daily with the Thief Trading Style. 🚀💵
Stay tuned—another heist drops soon! 🎯🐱👤

DAX Stock Index Rises Over 20% Year-to-DateDAX Stock Index Rises Over 20% Year-to-Date
The German DAX 40 index (Germany 40 mini on FXOpen) is showing significantly stronger performance than other major global stock indices as of the end of May. For comparison, since the beginning of 2025:
→ The tech-heavy Nasdaq 100 has remained largely flat;
→ The S&P 500 is down by 1%;
→ Japan’s Nikkei 225 has fallen by approximately 4.5%.
Why Is Germany’s Stock Index Climbing?
The rally may be driven by a combination of factors, including:
→ An ambitious fiscal stimulus programme launched by the German government, featuring substantial public investment in defence and infrastructure development.
→ A dovish monetary policy stance from the European Central Bank (ECB) amid slowing inflation. Expectations of further interest rate cuts in 2025 have made equities more attractive than bonds, drawing capital into the stock market.
Technical Analysis of the DAX 40 Chart
These fundamental drivers have supported the formation of an upward trend channel (marked in blue), with the median line acting as a key area of support.
The DAX stock index experienced a sharp drop on Friday (highlighted by the arrow) after the US President unexpectedly announced 50% tariffs on EU imports, citing slow progress in trade negotiations. By Sunday, however, Trump postponed the tariffs until 9 June following a “constructive conversation” with European Commission President Ursula von der Leyen.
Since then, the price has:
→ Rebounded from the lower boundary of the channel, which is reinforced by support at the 23,350.0 level;
→ Approached the 24,100 level — a strong resistance zone this month.
Given the uncertainty sparked by Trump’s impulsive policy shifts, investors may be shifting capital from US to European markets, further supporting the DAX 40’s position as a leader among global stock indices.
This article represents the opinion of the Companies operating under the FXOpen brand only. It is not to be construed as an offer, solicitation, or recommendation with respect to products and services provided by the Companies operating under the FXOpen brand, nor is it to be considered financial advice.

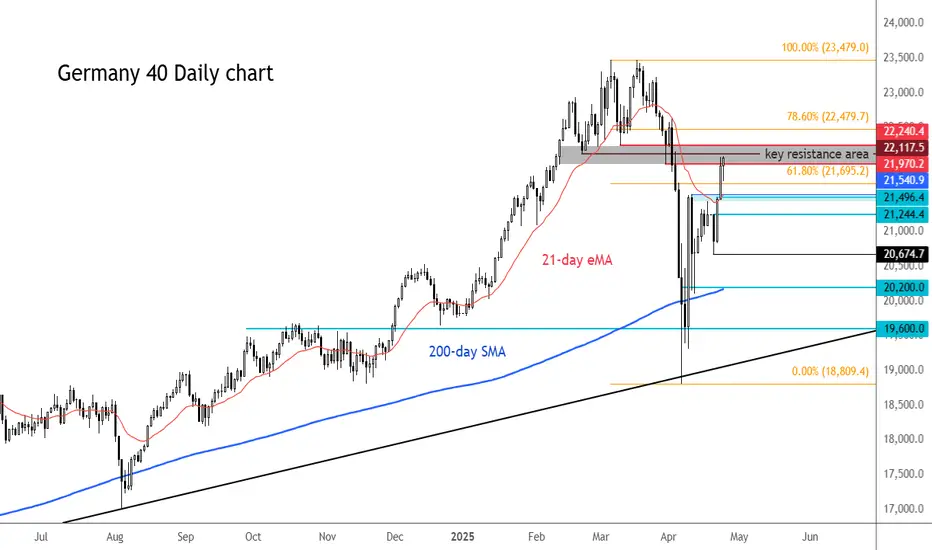
DAX enters major resistance zone after 3-day rallyThe DAX has enjoyed a very good recovery from its lows made earlier this month, outperforming many global indices. However, even the flying German index could be due a pullback now that it has reached a major resistance area.
As per the chart, the area between 21970 to 22240 marks a major zone. This area was previously a key support zone which gave way during the height of the tariffs uncertainty, paving the way for a sharp drop.
Now, with Trump changing his tone, we have seen European markets regain much of those losses. But the potential for the trade war to drag on is there, which is why we can't rule out the possibility of a fresh drop from around this area.
If the market does turn lower, then some of the key support levels to watch are drawn on the chart, with the first area for the bulls to defend coming in at around 21,500/50 (shaded in light blue).
By Fawad Razaqzada, market analyst with FOREX.com
GERMANY 40 MOVED AS ANTICPATEDPrice moved from our anticipated POI . Was a bit choppy but good momentum eventually kicked in,, Drop me a comment on what you think.. Thanks

GERMANY40 LONG price reacting from a significant demand area . will be looking for longs targeting the high 23400. Drop a comment on what you think .
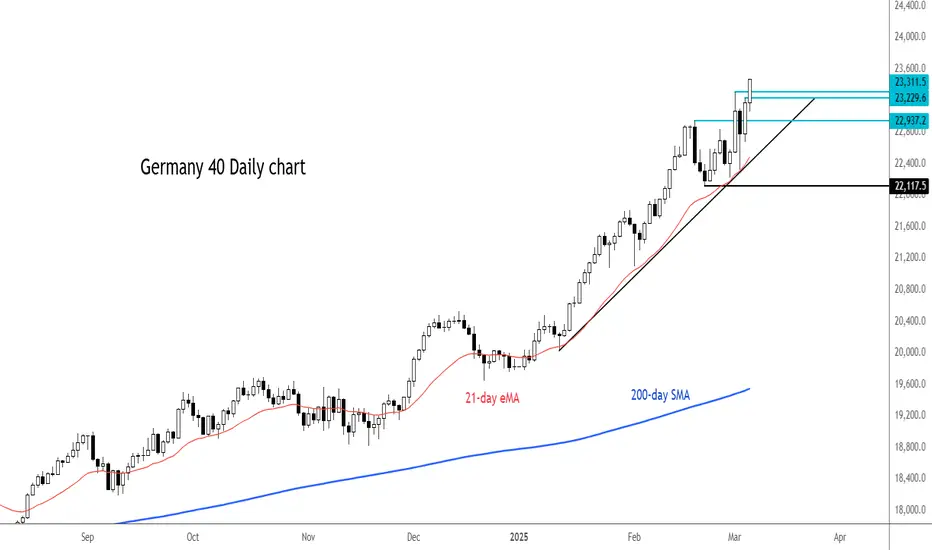
DAX hits fresh record on stimulus plansThe German DAX index has just hit a fresh all-time high.
The latest gains come as a global bond sell-off extended its run, driven by Germany’s ambitious spending plans, which are poised to reshape the eurozone’s economic outlook and has already had a sizeable impact on regional stocks. Today, the focus was also on the rate decision from the European Central Bank. The ECB cut rates by 25bps as expected and President Lagarde said the next rate decision in April is defendant on data.
The market's attention shifts to US labour market data as we head to the business end of the week.
From a technical view point, the strong rally means dip-buyers continue to remain in control of price action. For that reason, there is no point in trying to pick the top. Concentrate on support levels until we see a clear reversal pattern.
Short-term support now comes in around 23,311, marking the high from Monday, followed by 23,229, marking the high from Wednesday. Below these levels, 22,937 is the next key support to watch for a potential bounce, before the trend line comes into focus a bit lower down.
By Fawad Razaqzada, market analyst with FOREX.com
DAX Stock Index PlungesDAX Stock Index Plunges
As we noted six days ago, European stock markets were showing optimism amid expectations that the armed conflict in Ukraine—now approaching its third year—would be resolved. During this period, the DAX 40 (Germany 40 mini on FXOpen) gained approximately 1.6%, setting a historic record.
However, sentiment appears to be shifting in the opposite direction. According to the Germany 40 mini chart on FXOpen, the German stock index DAX 40 experienced a sharp decline yesterday, losing around 2%. This drop is partly driven by Trump's latest tariff statements. According to Trading Economics:
→ The US President is considering imposing new 25% tariffs on automobile, semiconductor, and pharmaceutical imports, with an official announcement expected in early April.
→ Market sentiment deteriorated after ECB Executive Board member Isabel Schnabel tempered expectations of a more expansionary monetary policy.
Technical Analysis of the DAX 40 (Germany 40 mini on FXOpen)
Since the start of 2025, the index has been following an upward trend (illustrated by the blue channel), which remains intact. However, yesterday’s aggressive drop pushed the price into the lower half of the channel, indicating increased bearish activity. If negative sentiment persists, the price could decline further—potentially testing the lower boundary of the channel.
The 22,200 level appears to be a significant support zone, as bulls demonstrated strength here less than 10 days ago (as indicated by the blue arrows):
→ The price formed a long lower wick when testing the psychological 22k mark.
→ It then surged into the upper half of the channel with a strong bullish candle.
Conversely, the 22,730 level has flipped from support to resistance (marked by orange arrows), signalling the presence of bearish pressure.
Trade on TradingView with FXOpen. Consider opening an account and access over 700 markets with tight spreads from 0.0 pips and low commissions from $1.50 per lot.
This article represents the opinion of the Companies operating under the FXOpen brand only. It is not to be construed as an offer, solicitation, or recommendation with respect to products and services provided by the Companies operating under the FXOpen brand, nor is it to be considered financial advice.
