Getty Images (NYSE: $GETY) Earnings Breakdown
Technical Analysis
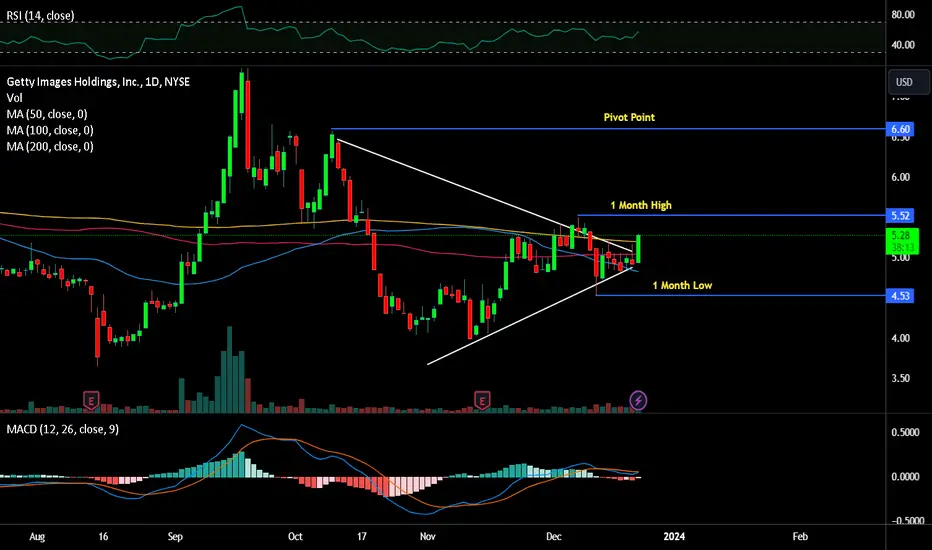
Getty Images A ( NYSE:GETY ) is within an approximate horizontal trend channel in the medium long term, which indicates further development in the same direction.
The stock is moving within a rectangle formation between support at $4.07 and resistance at $7.41.
A decisive break through one of these levels indicates the new direction for the stock. The stock has marginally broken down through support at dollar 5.00. An established break predicts a further decline.
Key Strength
2. The revenue grew by 7.6% in the first quarter of 2023 from the same quarter a year ago. The net income grew by 36.25% in the same period. The earnings per share (EPS) increased by 36.92%
1. The return on equity (ROE) is 31.34%, the return on assets (ROA) is 15.28%, and the return on investment (ROI) is 23.18%. These ratios are higher than the industry and sector averages, indicating a high profitability
Gettyimages
GETTY Strong buy opportunityWe last looked into Getty Images Holdings (GETY) on April 24 giving a timely sell signal (see chart below) as the price got rejected on the 8.25 Resistance, failing to break above the 1D MA200 (orange trend-line):
The stock is forming a Channel Up right now, having broken above the 1D MA50 (blue trend-line) and about to test the 1D MA200 (orange trend-line). If it closes a 1D candle above it, it will be a bullish break-out signal and we will buy targeting the top of the Channel Up and Higher Highs trend-line of the Megaphone at 9.00.
It is worth mentioning that the 1D MACD just completed a Bullish Cross. Every time this pattern emerged below 0.0000, the stock price rose significantly.
-------------------------------------------------------------------------------
** Please LIKE 👍, FOLLOW ✅, SHARE 🙌 and COMMENT ✍ if you enjoy this idea! Also share your ideas and charts in the comments section below! **
-------------------------------------------------------------------------------
💸💸💸💸💸💸
👇 👇 👇 👇 👇 👇

GETY is the perfect sell right now, until the 1D MA200 breaks.Getty Images Holdings (GETY) opened just shy off Resistance 1 (8.25) today but got rejected, showing how much this level weighs as well as the Higher Highs trend-line. We consider this the perfect sell opportunity targeting the 3.45 Support 1 and the Lower Lows trend-line of the Megaphone pattern. We are willing to commit on a long-term buy on Gety only if the price breaks above the 1D MA200 (orange trend-line) and target Resistance 2 (13.66).
-------------------------------------------------------------------------------
** Please LIKE 👍, FOLLOW ✅, SHARE 🙌 and COMMENT ✍ if you enjoy this idea! Also share your ideas and charts in the comments section below! **
-------------------------------------------------------------------------------
💸💸💸💸💸💸
👇 👇 👇 👇 👇 👇
