Bitcoin Global m2While the Global Liquidity Index is on the verge of a parabolic run like the 2011\2013 2016\2017 and 2020\2021 processes, a bear season for #Bitcoin cannot be mentioned
Globalliquidityindex
Pairing between BTC & Global Liquidity IndexSup everyone,
if you're active on twitter or have been looking around for crypto trade ideas you might have stumbled upon the Global Liquidity Index chart (at least I have).
I've stumbled upon it a few months back and have been testing it ever since, let me tell you what this chart is about:
The Global Liquidity Index basically measures how much money is flowing through global markets—think of it like the pulse of the financial system... traders and investors use it to get a sense of overall market conditions, liquidity availability, and risk appetite.
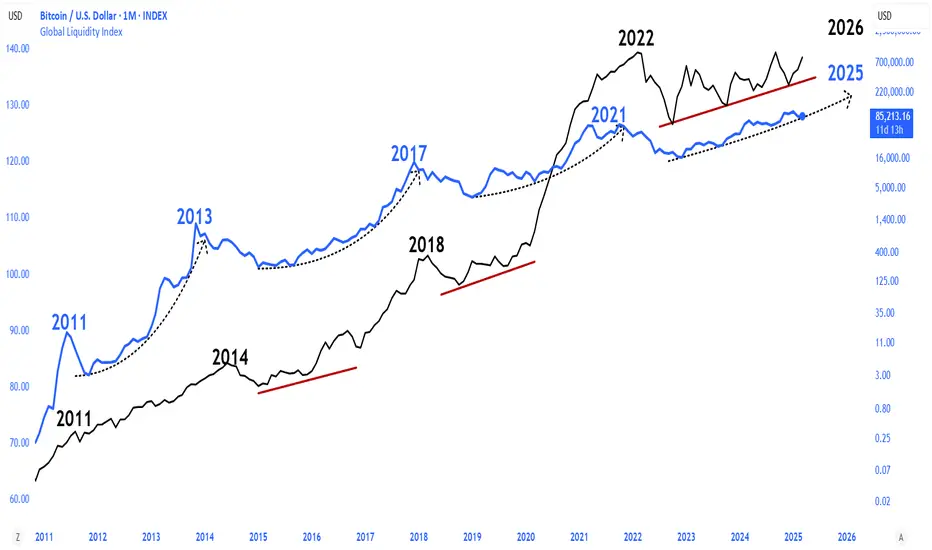
Now, here’s the cool thing: when you layer the Global Liquidity Index onto the Bitcoin chart, you notice something interesting— BITSTAMP:BTCUSD tends to react, but with a delay. Typically, there's about a 2-3 month lag. If global liquidity spikes or makes a sharp V-shaped recovery, Bitcoin usually mirrors this movement roughly 80 days later.
Why does this happen? Well, Bitcoin is a highly speculative asset, and institutions—especially banks—often wait to see solid liquidity signals before moving their capital into riskier assets like crypto. They prefer confirmation over speculation, which explains the delay.
So, in simple terms, by tracking global liquidity, you get a pretty useful heads-up about where Bitcoin might be headed a couple of months down the road.
The Global Liquidity Index is essentially a snapshot showing how much money central banks and financial institutions are injecting or pulling out of the global economy. Think of it like a big gauge tracking how "easy" or "tight" money conditions are worldwide.
It usually takes into account factors like:
Central Bank Policies: How much money central banks are printing or how they're changing interest rates.
Bank Reserves and Credit Availability: The amount banks can lend out, influencing how easily money flows through markets.
Government Spending and Stimulus: Fiscal policies injecting liquidity directly into the economy.
International Capital Flows: Money moving across borders, affecting global market liquidity.
When liquidity is abundant, there's more money sloshing around looking for places to invest. That typically pushes up asset prices—including speculative ones like Bitcoin—as investors seek higher returns. Conversely, when liquidity tightens (like when central banks raise interest rates or pull back stimulus), money becomes scarcer, risk appetite shrinks, and assets tend to dip.
So, when you're watching the Global Liquidity Index, you're basically monitoring how central banks and institutions are influencing market sentiment and investment behaviors, which eventually impacts speculative assets like Bitcoin—but with that notable delay we talked about earlier.
Practically speaking, here's how you apply the Global Liquidity Index to Bitcoin:
You watch for major turning points—peaks, bottoms, or sharp reversals—in global liquidity. Once you spot one, mark your calendar about 2–3 months forward (around 80 days). That’s usually when Bitcoin mirrors that move.
So, for instance, if the Global Liquidity Index sharply rebounds upward (a V-shaped recovery), you'd expect BTC to follow with a rally roughly two to three months later. On the flip side, if liquidity peaks and starts declining, it's a heads-up that Bitcoin could face downward pressure within the next few months.
This gives you a practical edge—you're essentially previewing BTC’s possible moves.
All things said, if you look at BTC's chart right now and apply the Global Liquidity Index to it you can see how the second has broken its previous high a few months back, but BTC yet has to break its, you can arrive to the conclusions here....
With no reversal in sight (for now) in the Global Liquidity Index, there don't seem to be signs of "spoofing", no case in which the index starts declining and so makes traders who know about this delay start to sell earlier than the delay.
End of the story - things look promising for BTC and you should definitely keep the Global Liquidity Index in your list of indicators.
Global M2 MONEY SUPPLY VS GLOBAL LIQUIDITYWhich is the best to track ₿itcoin price action?
Lots of macro gurus have been arguing over the two.
For comparison, I have indexes for both metrics on a 12-Week Lead, tracking the 4 largest central banks:
The Federal Reserve (including TGA & RRP), People’s Bank of China, European Central Bank and Bank of Japan.
Let’s start by defining each.
Global M2 Money Supply covers physical cash in circulation and cash equivalents such as checking and savings deposits, as well as money market securities.
Global Liquidity covers a broader measure of liquid assets driven by central bank balance sheets, private sector financial activity (e.g., lending, corporate cash), and cross-border capital flows.
Historically, both move closely in lock-step and act as a great leading indicator for ₿itcoin, however we can see that Global Liquidity can have more drastic fluctuations.
We saw a large divergence in CRYPTOCAP:BTC PA with both metrics when the Blackrock iShares ₿itcoin ETF appeared on the DTCC list, a procedural step signaling progress toward potential approval.
When you look at the charts of all three, you can see there are points where either metric might follow CRYPTOCAP:BTC PA a bit closer, so in the end I would say it’s best to track both to find confluence in the signal.

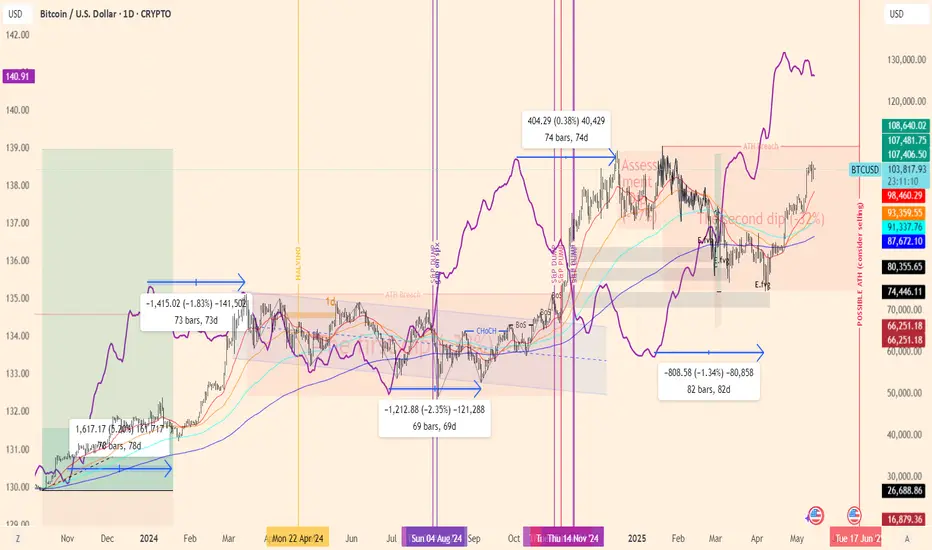
Global Liquidity Index \ BitcoinYou are not optimistic enough about CRYPTOCAP:BTC
Global Liquidity Index \ Bitcoin
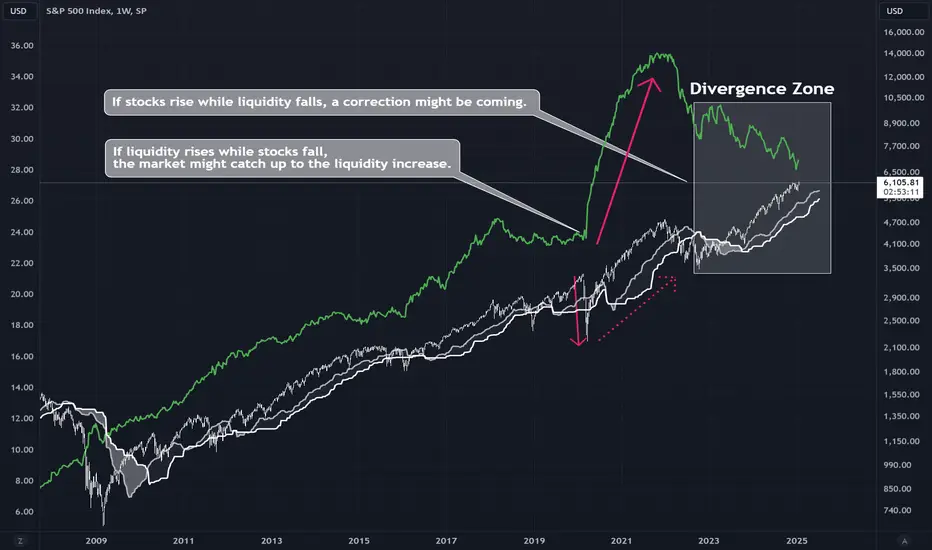
Global Liquidity Index Overlaid on S&P 500 Tracking the Global Liquidity Index with the S&P 500 helps understand liquidity's impact on market performance and predict future moves. The GLI offers a unified view of central bank balance sheets, converted to USD, excluding currency-pegged banks, with reliable data since 2007.
Rising liquidity often leads to market growth, while declining liquidity could signal pullbacks or increased volatility.
Liquidity Spikes: Sudden rises in the GLI may boost the S&P 500.
Liquidity Dips: Falling liquidity may signal market decline due to higher volatility and trading difficulties.
Divergence between the GLI & S&P 500:
If stocks rise while liquidity falls, a correction might be coming. If liquidity rises while stocks fall, the market might catch up to the liquidity increase.
The GLI indicates that risk appetite is starting to decline. High liquidity encourages risk-taking; low liquidity leads to safer investments, increasing volatility and potential market declines.
Thanks for Liking and Sharing! 🥕🐇
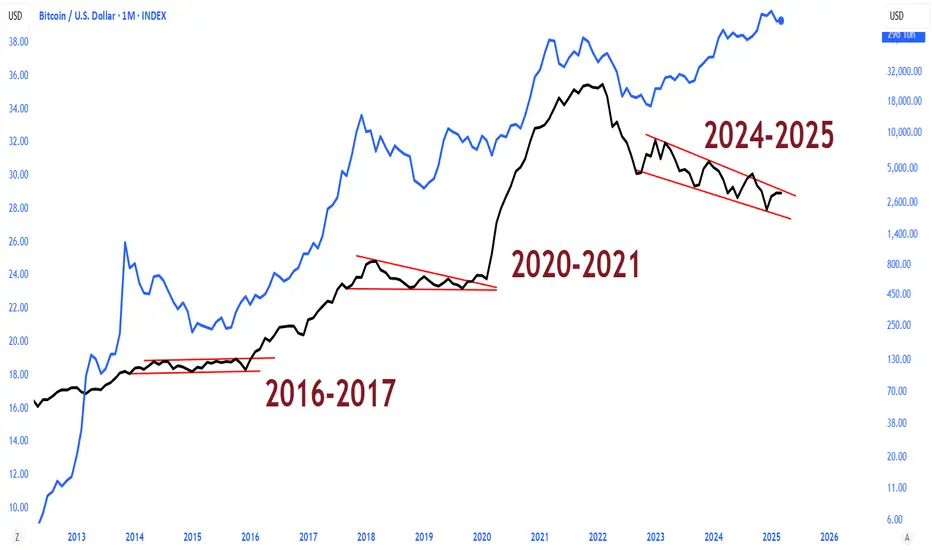
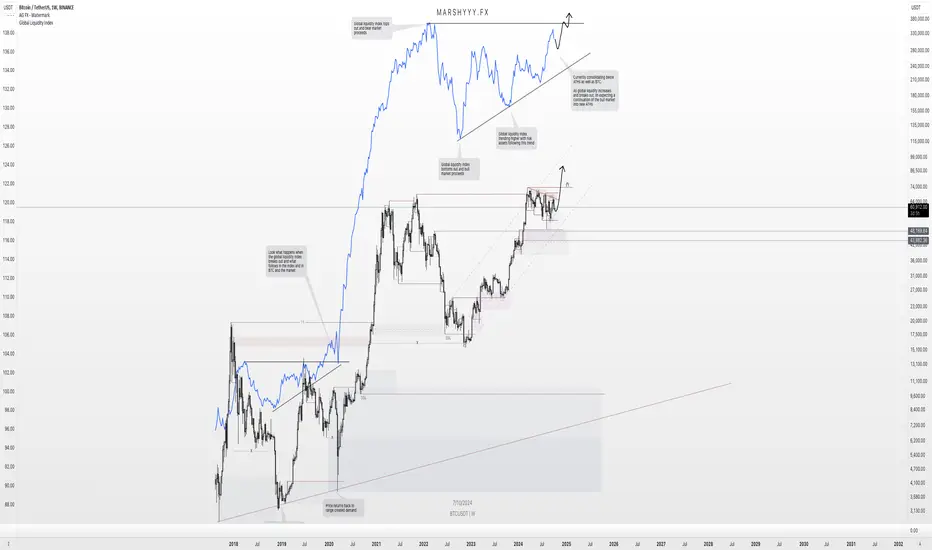
Global Liquidity Index Against BTCHeres the global liquidity index mapped against BTC and its past cycle data for reference.
Im sure you can spot the positive correlation it has.... When global liquidity increases, risk on assets such as BTC increase due to an influx of new liquidity in money markets.
We have been consolidating for 2 years in the global liquidity index in an ascending triangle. I am expecting it to push up, break out, retest similar to the prior cycle fractal and continue higher, in turn pushing money markets including BTC into ATHs
The Global Liquidity Index is looking very interesting here.The GLI is looking very interesting at these levels. It's currently bouncing around within the Fibonacci retracement levels shown. Stocks and crypto usually perform better during times of increased liquidity for obvious reasons. Now that we are heading into a period where central banks around the world are propping up markets with freshly printed cash, we may see this index set a new high, which will be good for asset prices overall.
Good luck, and always use a stop loss!
