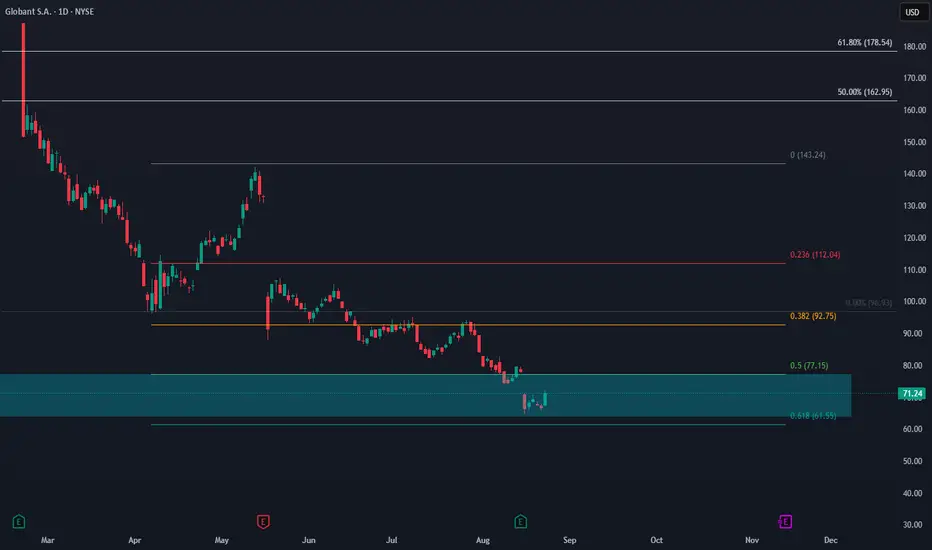
Globant 4H Double BottomGlobant posted a positive earnings report. On the 4-hour chart, a double bottom can be observed. Considering the recent decline in the stock, applying a Fibonacci retracement followed by an extension shows the lowest extension level at 1.618, which acted as support. Today, the price broke to the upside. It will be important to analyze with caution whether it starts gaining volume to return to previous levels, while adjusting the stop-loss as a precaution.
Globant
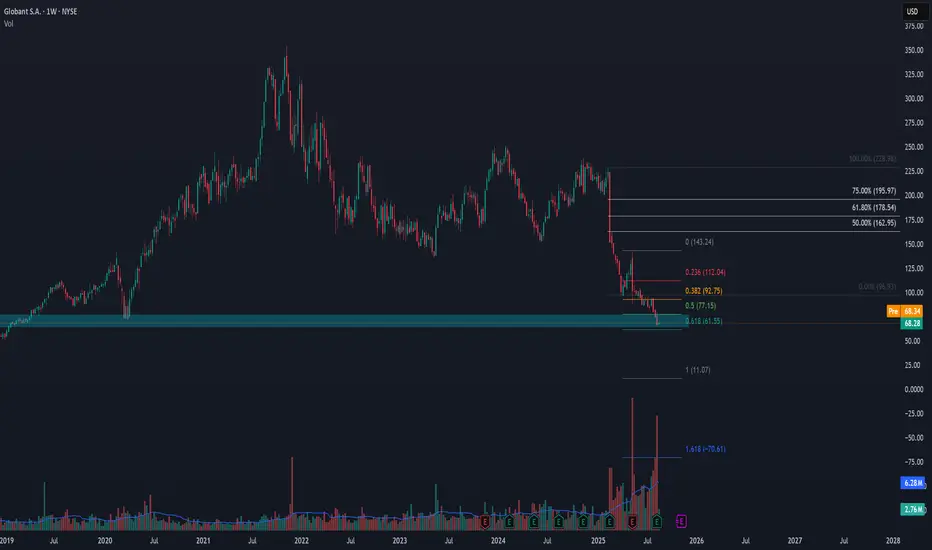
Globant, Bright Future or Total Darkness?📊 Technical Analysis – Globant (GLOB) – Weekly
The price of Globant (NYSE: GLOB) remains under strong bearish pressure, approaching a key long-term support area.
🔑 Fibonacci Levels
0.618 (61.55 USD): critical zone currently being tested. A clear breakdown could open the door to further declines.
0.5 (77.15 USD): first major resistance in case of a rebound.
0.382 (92.75 USD): secondary resistance, aligned with previous supply zones.
0.236 (112.04 USD): stronger resistance level; a breakout above would suggest a trend reversal.
📉 Support and Resistance
Main Support: 65–61 USD, which acted as a strong base during 2019–2020.
Immediate Resistance: 77 USD, followed by 93 USD.
🔄 Volume
Volume has increased significantly over the past weeks, indicating strong institutional activity around this support area. This could hint at a potential technical rebound if the level holds.
📌 Conclusion
As long as GLOB holds above 61 USD, there is room for a rebound toward 77–93 USD.
A breakdown below 61 USD would open a more bearish scenario with medium-term targets around 50–45 USD.
Current bias remains bearish, but we are at a key decision zone.
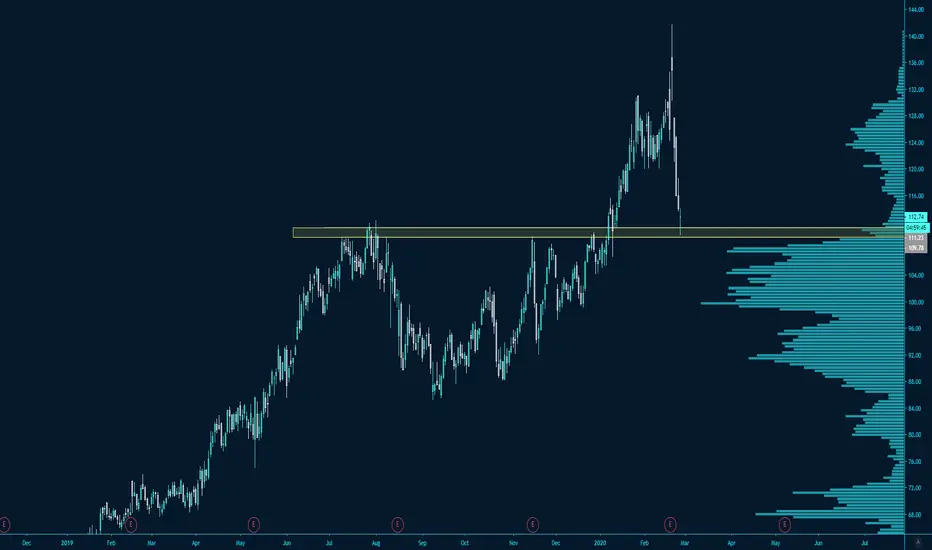
$GLOB probably going upWell... Not a well good day/week/year to publish an investing idea, but... there you have my bet.
Globant still is a huge dependency for tons of big companies (like Disney, EA Games, Banks, etc). My bet still positive about GLOB.

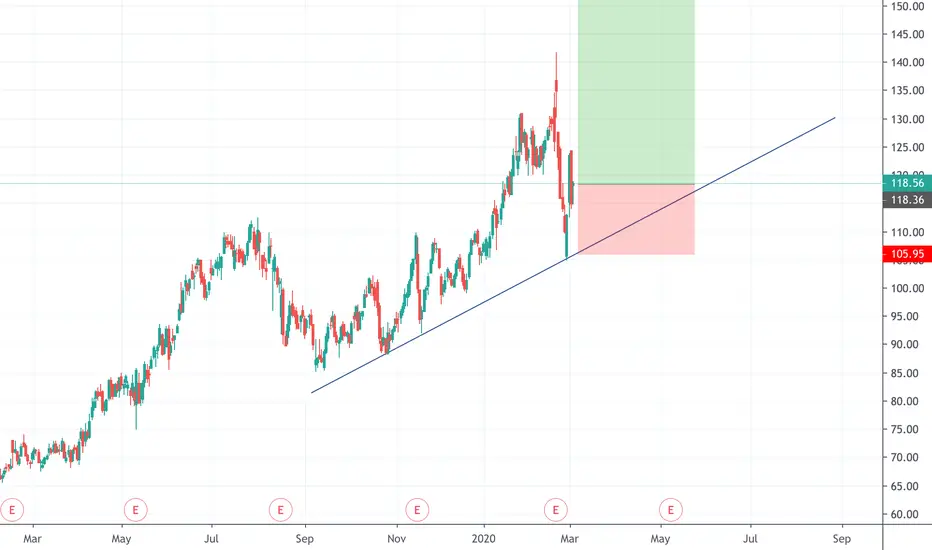
Long GLOB- Stay above $106 and trend is your friendGlobant got corona'd due to macro factors, but longer term up-trend on this great IT growth stock still holding. Stop at $105 and target $140. Timeframe a few months