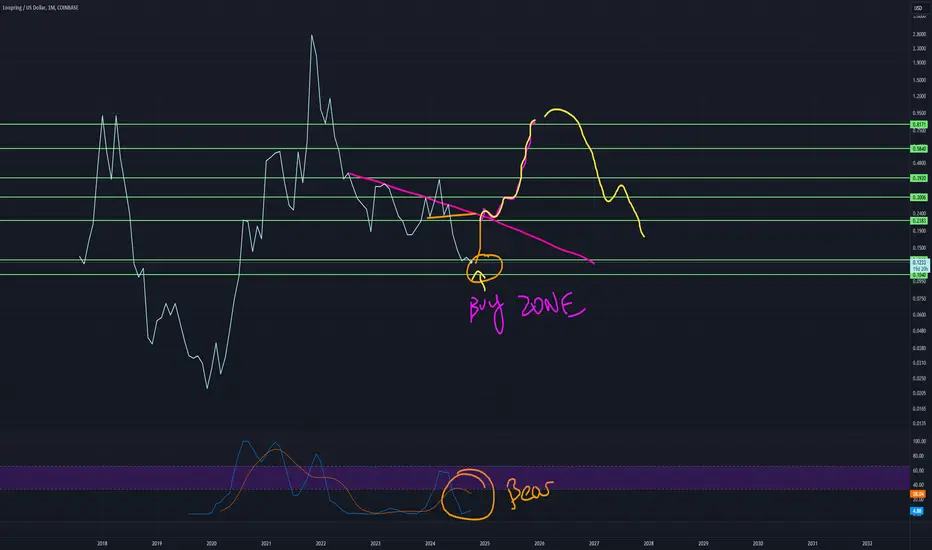
LRCUSD LOOPRING IS THIS THE END?not really, unless something super major happens which is outside of TA and puts the coin down to nearly nothing.
Overall, RSI is bearish, but gearing up to move bullish for at least a little bit, at which point, it can reject the short term trend and continue to funnel down or it doesn't and the short term trend ends up moving LRC to the higher price targets.
Everything is marked on the chart.
This is the Monthly view so really long term viewpoint.
Anyway, all the other LRC charts cover a lot of the moves, trends and price targets so this one is staying simple.
GME
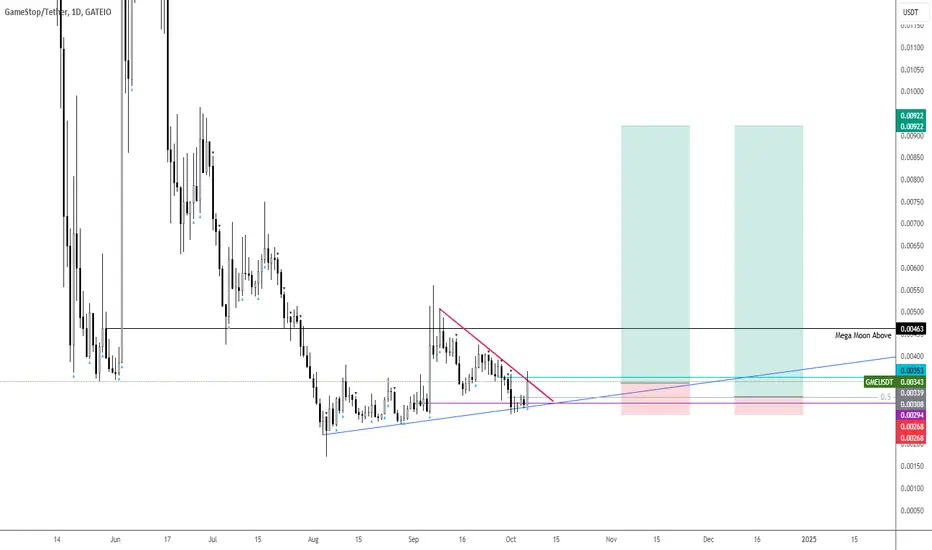
Is $GME Ready for a Comeback? Let’s Place Our Bids!With all the movement in these #shitcoins, why not consider putting some funds into NYSE:GME ? It might be worth diversifying into a more established asset like GameStop, as this #coin tends to rip without notice.
The risk/reward (R/R) is good here. I have bids set around the 0.00300 area in case it sees a retest next week.
Let’s get it!
$GME - October 1-15If anything was going to happen it was gonna happen and it didn't.
I did notice this brilliant little thing though. Could mean we're having another May-Like run.
imgur.com
The timeline for this is October 1-15, potentially may get pushed to 22-31 Oct due to unknown factors or events around those times like another big scam company announced by Hiddenburg conveniently coming out when the data shows a run or something about Carl Icahn again.
It does look nice though. I'll be monitoring its progress and see if it continues to be similar to the May run. If it does, the buy time would be 26-30 Sept. Will let you know as i have a few loans to pay off now and can't join these ones so they're all yours to destroy by inversing this post.
Till then, GME looks like it'll be doing the usual boring stuff like going sideways, dumping on earnings, re-pumping the next day back to normal and then dropping slowly over time again to an even lower price point as people get comfortable selling their CC's and then covering them around the timeline i mentioned whilst getting ready to sell CC's at the new GME top thus cutting any big runs short.
The good runs are the runs none of you know about, because that way no one's expecting and thus no one has their fingers ready on the CC selling button the moment they see a 10cent peak. So technically i'm the run destroyer. A watched pot never boils over.

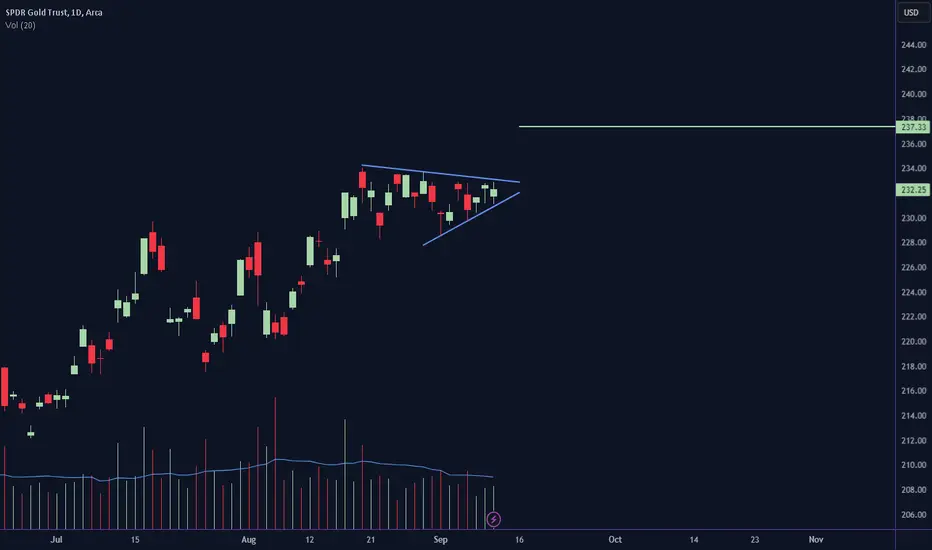
GLDGold consolidating. Looking like it wants to breakout here.
Trade Idea: 235C 10/11/24
Stop loss around 230.
......................
TSLATSLA Robotaxi day is on 10/10. TSLA can run up leading into this event. A breakout over 235 can run into the 7/11 highs of 271.
Trade Idea: 250C 10/11/24
..........................

GameStop ($GME) Faces Challenges as Stock Plummets 14.65% Shares of GameStop (NYSE: NYSE:GME ), the once high-flying meme stock, plunged nearly 15% in premarket trading on Wednesday. This dramatic drop came after the video game retailer reported a steep 31% decline in quarterly revenue, overshadowing its swing to profitability. As GameStop grapples with the evolving gaming landscape and a strategic overhaul, investors are left questioning the company's ability to stage a meaningful comeback.
Revenue Decline Overshadows Profitability
GameStop (NYSE: NYSE:GME ) has been feverishly restructuring, aiming to revive its business by closing underperforming stores and focusing on value-added products to enhance sales. However, the latest quarterly results paint a grim picture. Despite achieving a net profit, the company's revenue plummeted by 31%, a decline that raises concerns about its long-term growth prospects.
The company announced plans to sell up to 20 million shares to fund future acquisitions, marking another strategic pivot. This move follows GameStop's earlier capital raises totaling over $3 billion, which were driven by wild stock price swings fueled by retail investors and prominent traders like Keith Gill, known as "Roaring Kitty." However, the market's reaction was far from favorable, as shares slid further after Gill's return to social media failed to ignite the same enthusiasm seen in 2021.
The declining sales reflect the broader trend of consumers moving away from physical game discs toward digital downloads and streaming services. This shift has heavily impacted GameStop’s core business, pushing the company to diversify its offerings. Despite these efforts, the retailer’s ability to stabilize its revenue remains uncertain.
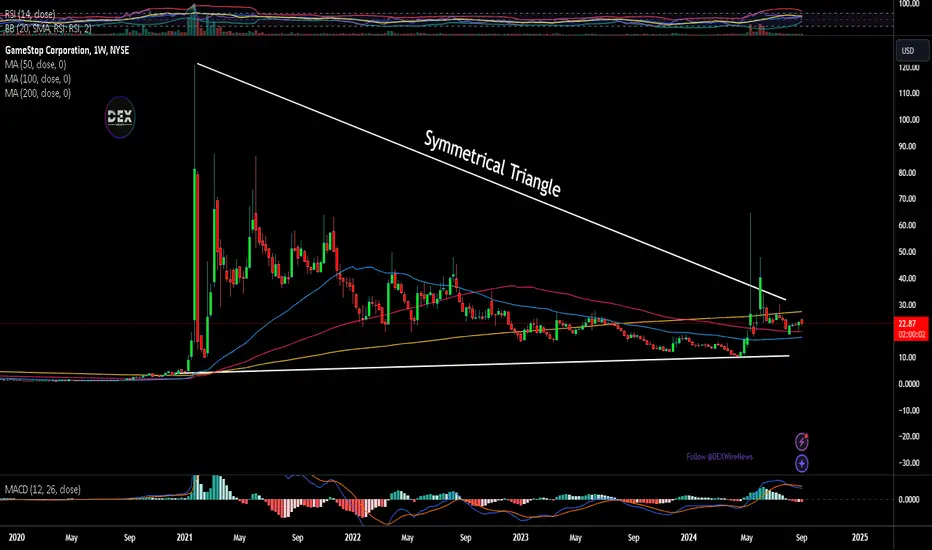
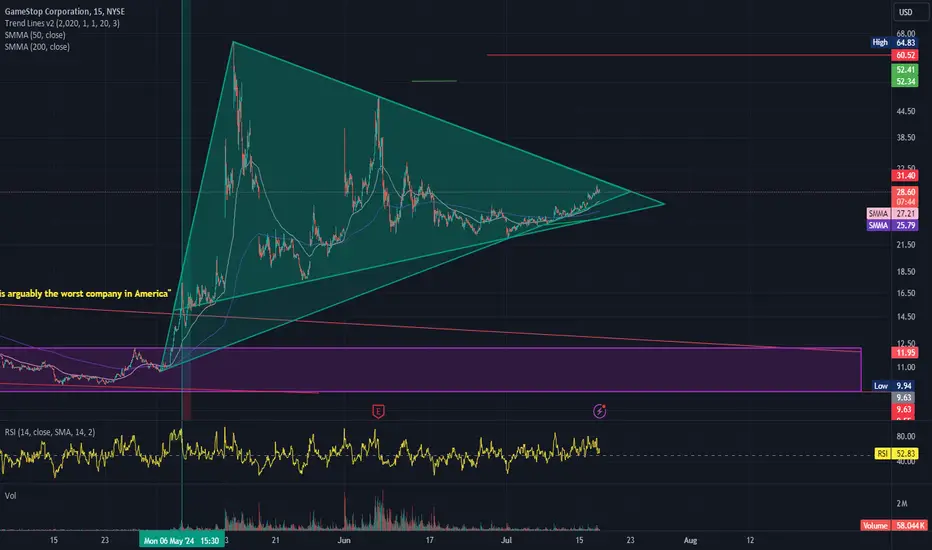
Symmetrical Triangle Breakdown Looms
GameStop's technical outlook is equally concerning. Since early June, NYSE:GME stock has been trading within a symmetrical triangle pattern, with price oscillations tightening as bulls and bears vie for control. After a brief three-day rally, the stock was rejected at the triangle’s upper trendline, highlighting market uncertainty ahead of the earnings report.
Wednesday’s sharp drop could signal a potential breakdown below the triangle’s lower trendline, opening the door to further downside. Key levels to watch include:
1. $18.50: This area represents a potential support level near the 200-day moving average (MA) and past peaks and troughs. Holding this level is crucial; failure to do so may lead to further declines.
2. $15.25: If $18.50 fails to hold, the next critical support is at $15.25, where the stock has seen periods of consolidation earlier this year. This level may serve as an entry point for value-seeking investors.
3. $13.25: A breakdown to this level would represent a 43% drop from Tuesday’s close, marking a critical support zone where buying interest could re-emerge based on historical lows.
Despite the bearish setup, there remains the potential for a meme-fueled rally driven by retail investor enthusiasm. A key bullish target would be the $30.50 area, where traders might look to capitalize on past gaps and resistance levels, especially during periods of heightened volatility.
The Road Ahead: A Cautious Outlook
As GameStop (NYSE: NYSE:GME ) continues its transformation, investors should remain cautious. The company's ability to stabilize revenue and navigate the shift towards digital gaming will be paramount to its recovery. While the stock’s RSI currently sits near oversold territory at 47.61, indicating some potential for a bounce, the broader technical picture suggests a challenging path forward.
Investors should closely monitor the key support and resistance levels highlighted above, as well as any further developments from GameStop’s management regarding its strategic initiatives. With market sentiment fragile and the stock under pressure, GameStop’s next moves could prove pivotal in determining whether it can reclaim its status as a meme stock legend or continue its downward spiral.
Stay tuned, as GME's journey is far from over—and volatility is almost guaranteed.
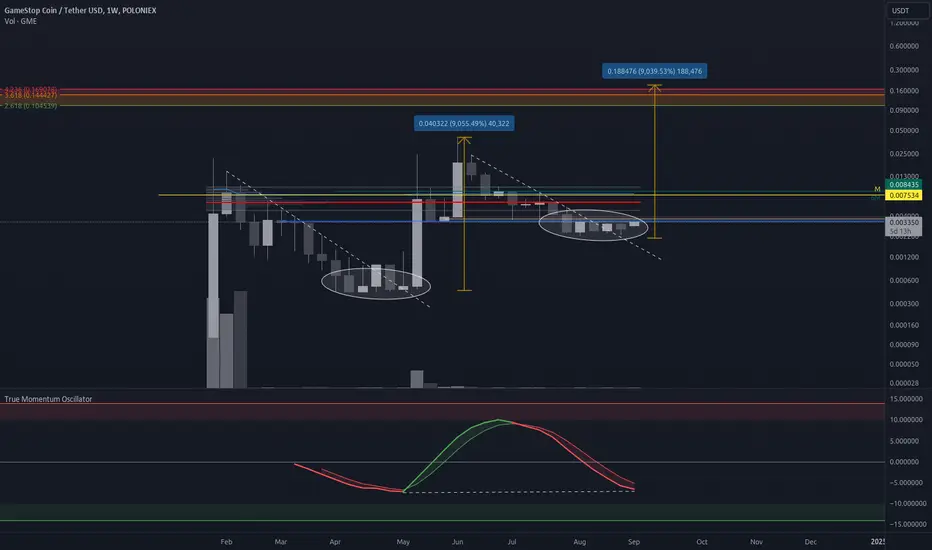
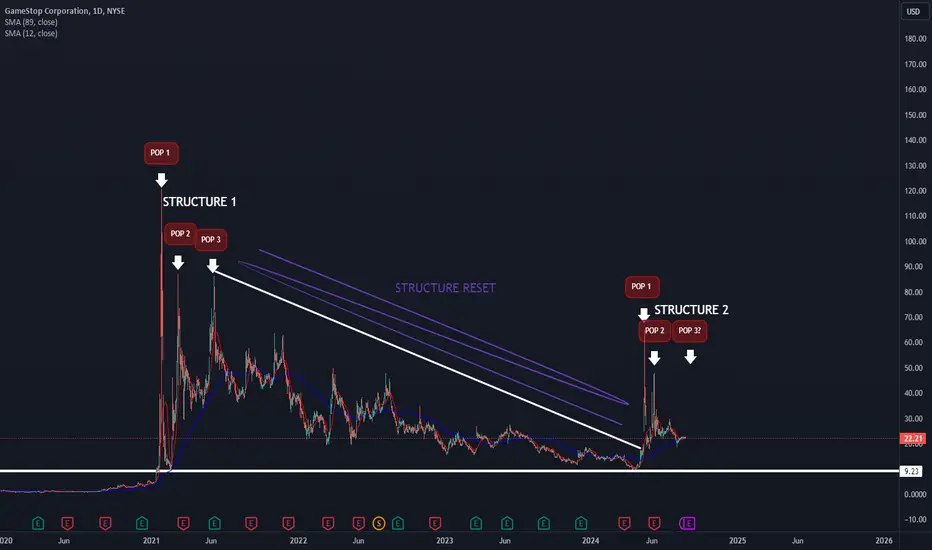
Will this GME fractal deliver another 9000% ?NYSE:GME is gaining traction again on social media.
Last time the downtrend diag broke price pumped 9000%
We are seeing similar pattern developing here that is breaking out
...and a further 9000% move would push price up to the 4.2 fib
Gamestop (GME) local bottom?Look at this retest of this horizontal support at around $20.
GME has also retested and held the EMA50 on the weekly time frame, which looks quite promising, like a mean reversion and even more bullish because it is a higher time frame.

GameStop ($GME) Earnings PreviewGameStop ( NYSE:GME ) is set to report its quarterly earnings on Tuesday, September 10th, after the market closes. Analysts are bracing for a challenging report, expecting lower revenue, a slightly larger net loss, and a significant decline in comparable store sales year-over-year. However, the stock's recent technical setup and less volatile trading pattern suggest potential opportunities for traders and investors alike. Here's an in-depth look at both the fundamental and technical aspects of GameStop as we approach the earnings release.
Key Financial Metrics and Projections
GameStop ( NYSE:GME ) has been grappling with declining sales, increased competition, and shifting consumer behavior in the video game retail space. Analysts project revenue of $900 million for Q2 2024, down from $1.16 billion in the same quarter last year, reflecting a year-over-year decline of approximately 22.4%. The company's net loss is expected to widen slightly to $5.3 million, up from a $2.8 million loss in Q2 2023.
Key Financial Estimates:
- Revenue: Expected to decline to $900 million from $1.16 billion YoY.
- Net Loss: Projected at $5.3 million, larger than last year's loss of $2.8 million but significantly improved from Q1 2024's $32.3 million loss.
- Comparable Store Sales: Expected to drop nearly 23% year-over-year, a key metric highlighting reduced consumer spending on discretionary items, including video games.
Factors Influencing Fundamentals:
- Lower Consumer Spending: Amid inflationary pressures, discretionary spending has taken a hit as consumers prioritize essentials. This shift has particularly impacted GameStop’s sales.
- Shift to Digital Sales: The ongoing transition from physical game sales to digital downloads continues to challenge GameStop’s traditional business model.
- New Strategic Moves: GameStop recently announced plans to convert some of its stores to "retro" locations, focusing on nostalgic gaming experiences. This could attract a niche audience but remains an unproven revenue driver.
Technical Analysis: A Bullish Setup in the Making?
Despite the grim outlook on the fundamental side, GameStop’s technical setup tells a different story. As of the latest market session, NYSE:GME is up 3.17%, with the stock showing promising technical signals.
Key Technical Insights:
- RSI at 55: The Relative Strength Index (RSI) is sitting at 55, indicating a balanced momentum that is neither overbought nor oversold. This suggests that NYSE:GME is maintaining a healthy momentum without being at extreme levels, which could indicate further price movement.
- Symmetrical Triangle Pattern: The daily price chart depicts a symmetrical triangle pattern—a bullish continuation or reversal setup that often precedes a significant breakout. With converging trendlines, this pattern typically signals a buildup in buying pressure, leading to a potential upside move.
Trading Volume and Volatility:
- Volume Trends: Trading volume has been steady, reflecting less of the extreme volatility seen earlier in 2024. This calmer trading behavior may provide a more predictable environment for swing traders looking for a breakout opportunity.
- Support and Resistance Levels: Key support is around the $16 mark, while resistance sits near the $20 level. A breakout above this resistance could catalyze further gains, especially if positive earnings surprises or forward guidance are announced.
Market Sentiment and Influences:
- Meme Stock Legacy: While GameStop remains a heavily watched stock due to its meme status, recent activity has been relatively muted compared to past years. Influential trader Keith Gill, also known as “Roaring Kitty,” recently made a social media comeback, posting a cryptic message that could reignite interest among retail investors.
- Analyst Ratings and Revisions: Analysts have been cautious, with recent revisions reflecting skepticism about GameStop’s ability to return to profitability. However, any positive guidance or surprise in earnings could quickly alter this sentiment, given the stock’s history of sharp moves.
Outlook and Trading Strategy
Near-Term Outlook: GameStop’s upcoming earnings report will be crucial in setting the tone for its stock trajectory. While the fundamentals suggest ongoing challenges, the technical setup and market sentiment hint at the possibility of a bullish breakout, particularly if earnings beat expectations or management outlines a compelling strategic direction.
Potential Strategy: Traders may consider positioning for a potential breakout, closely watching key levels around the symmetrical triangle pattern. Caution is advised due to the inherent volatility around earnings announcements.
Conclusion: GameStop’s stock sits at a crossroads, with fundamental challenges being counterbalanced by a potentially bullish technical formation. Investors should keep an eye on Tuesday’s earnings release for critical insights into GameStop’s future direction.
As NYSE:GME continues to evolve from its meme stock origins, the upcoming financial results could provide pivotal data points for both short-term traders and long-term investors seeking to understand its market dynamics.
Could it be... GMEEarnings next week. Kitty head master tweeted.
Let's see what happens. Looks nice on the weekly but who knows if it has another move in it. Keeping an eye on volume.
If anything GME could see one last major move higher but that's based purely on gut feel and chart setup right now.
Could also dump, but $20 seems to be pretty sound support. The break of the major downtrend is pretty bullish after years of downwards chop.
GME/CHWY ratio. GME looks to be near the bottom of range could see another top towards high of range.

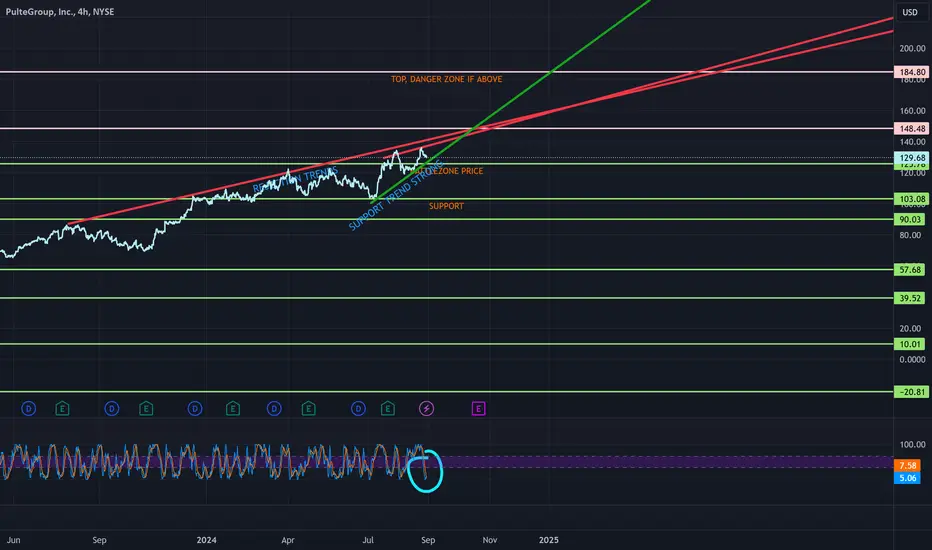
PHM UPDATED CHART - What's NEXT?What's next?
I'm not certain, but it looks like price can hold this key zone and use the rejection trends to bounce upwards to the 184 target (which is adjusted upward from 170).
RSI on the weekly is somewhat gapped, but bullish.
RSI on the daily is bullish.
RSI on the 4, 2 and 1 are near bottoms, so it's not a bad guess to say, maybe with all these indicators resetting and as we are nearing a strong support trend and strong horizontal support line, we might see a bounce.
good luck phm dudes.
also, bbbyq, gme and a whole bunch of other fun coming up.
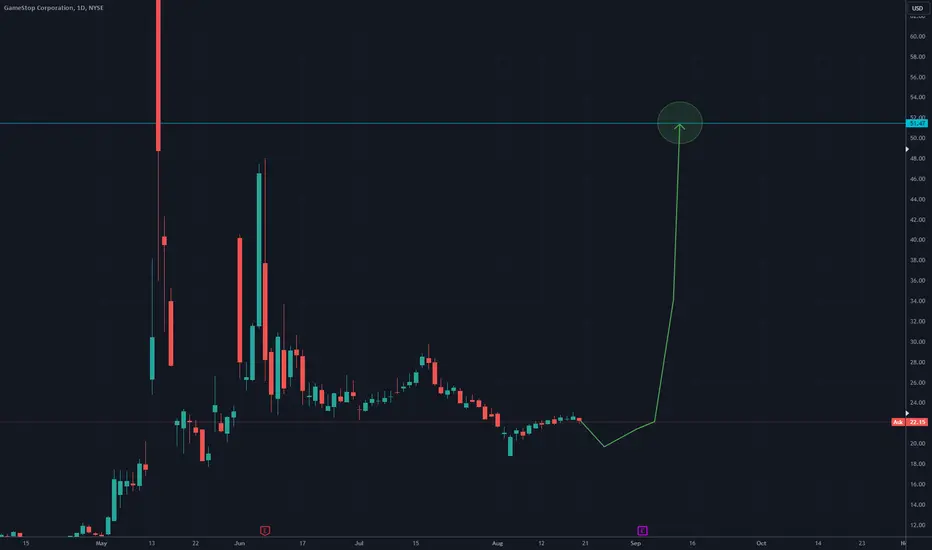
Bull Flag On The DailyWell well well, this looks familiar. I wonder where I seen this before? Beautiful Bull Flag on GME daily. Once we fill the bottom of this wedge around the $20 mark, its go time back to $30. If we break $30, this could head straight back to $60... Once again, get your tickets, because this is a show you're not going to want to miss.
Something brewing for GameStop? (GME)Sometimes the trade is right in front of us. Earnings in 11 days. Would keep an eye on this one.
$GME - Small Update"PLEASE READ"
Seems that the last little indication of something happening didn't actually quite pan out according to my data. There's very little chance of something occuring this and next week although the possibility exists.
I see from a different dataset that i have that it's more likely that we may see something around the 5'th of August or 28'th. It's WAY too early to say anything for sure, these are just very very very early indications of something occuring. My data may flip negative way before we even reach these dates.
Obviously i will let you know before those dates wether my data still looks positive or if it's flipped negative. The above chart will be invalidated if it flips negative, so please keep an eye out on UPDATES to my post as these are more important than the graph i've drawn.
I have a lot of data but nothing publically digestible/understandable yet which is why i'm not sharing anything here today. It would take too long to explain the charts/data that i have and very few people would understand, instead i'm letting you know verbally what's happening so you don't have to worry about the analysis part.

$GME - Another updateMy calls are expiring this week, i went too hard on the risk unlike most of you.
I see that something either will happen this week or on the 10'th of Sept.
That's it for now.
I don't like moving goalposts, especially 3 times in a row, but yeah. It is what it is.
$SPY $537 Fair Value Gap fill incoming imoFVG sits below at $541.61-$536.89 ..... Current 6 count could prove bearish into the 7th count on 10D chart. Very interesting chart showing what would essentially be a Bearish Harami off this Inside Doji. The 10D candle starts tomorrow 7/23 and ends 8/7 so basicaally accumlate as many puts as possible between then and now. If we move above the Open on the Doji at $554.54, then we can start talking about bullish behavoir. For now though, the gap above at $566.7 was rejected and I will be looking for a downside move from here to $540 as previously noted in a recent session. Chao.

What's Next For Gamestop?Lots of retail buyers are fomoing into gamestop after a "sudden" spike in price. Of course we are always several steps ahead... we anticipated this spike and shorted the high.... $5 is next for gamestop.


GMEricaSadly I have not posted my original DD here, so here's the link to the original.
www.reddit.com
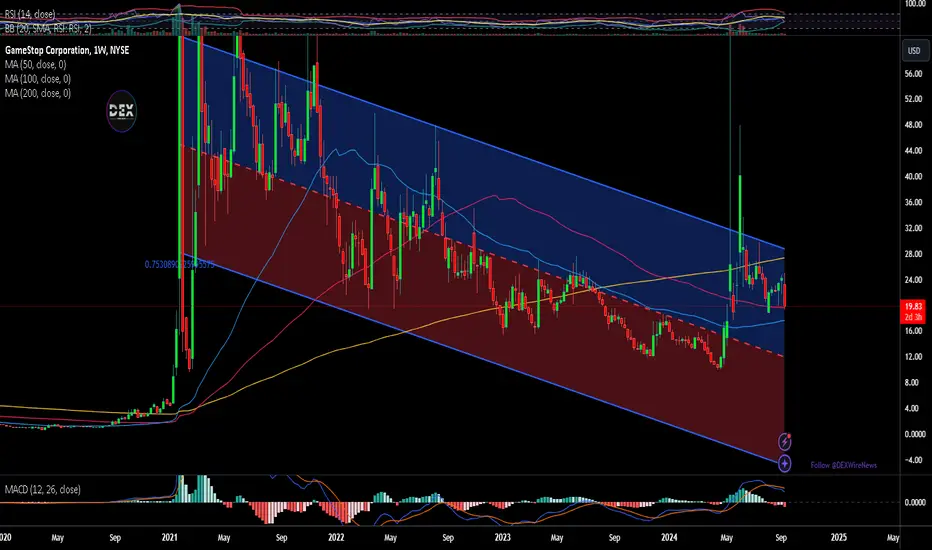
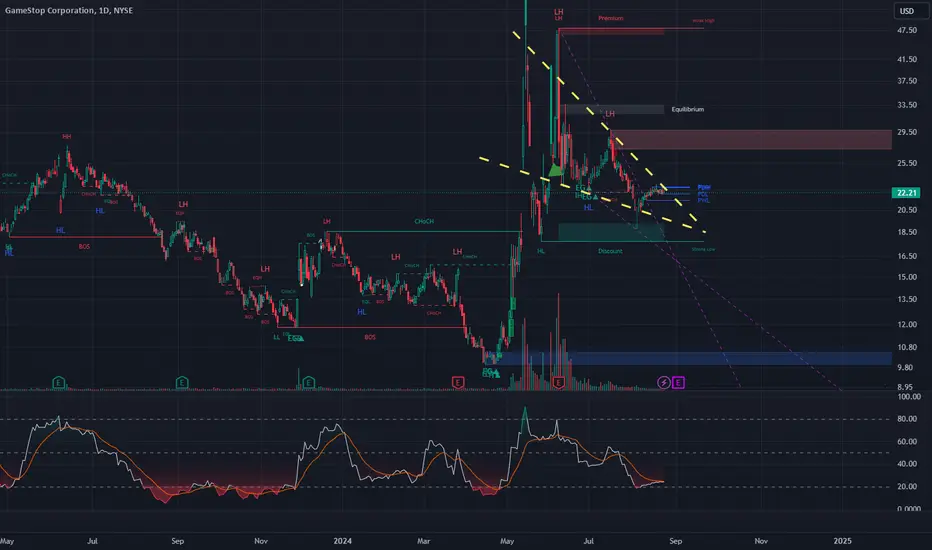
GameStop ($GME) Technical Analysis: A Harmonious Bullish Journey### GameStop ( NYSE:GME ) Technical Analysis: A Harmonious Bullish Journey
#### Current Financial Data
As of the latest market close, GameStop Corp. (NYSE: GME) is trading at $24.43 , reflecting a change of 1.75% from the previous trading session. The stock has a market capitalization of $8.58 billion, with a 52-week range of $9.95 to $64.83. The average 5 day trading volume stands at 12,258,820 shares.
#### Long-Term Harmonic Bat Pattern
Since reaching an all-time high (ATH) on May 14, GameStop's stock has been slowly carving out a harmonic bat pattern on larger timeframes. This pattern, known for its predictive power, suggests a potential bullish reversal. The bat pattern is characterized by its specific Fibonacci retracement levels, which GME has been respecting, indicating a well-structured technical setup.
#### Falling Wedge Formation
Around July 1, a falling wedge formation was observed, typically a bullish continuation pattern. This formation indicated a consolidation phase within a broader uptrend, providing a precursor to a potential breakout. True to form, GME began to show signs of upward movement following this pattern, marking the beginning of a new bullish phase.
#### Price Movement and Momentum
Post- July 1 , GME saw a price retraction to the $23.37 mark. This pullback was instrumental in building bullish momentum as traders accumulated positions, anticipating the next leg of the harmonic pattern. The slow price retraction allowed for the formation of a solid support base, critical for the upcoming bullish journey.
#### Resistance and Targets
Currently, GME is approaching a significant resistance level at $31.69. Breaking through this level is crucial for further bullish progression. Upon successfully overcoming this resistance, the first target stands at $37.78 . This target is strategically placed just before another anticipated retraction around the $32 mark, providing a healthy correction and consolidation phase before the next bullish surge.
The second target is set at $53.44 . Achieving this target would mark a significant milestone in GME's bullish journey, completing the second leg of the harmonic bat pattern. This level aligns with the 161.8% Fibonacci extension from the initial price move, reinforcing its technical significance.
#### Technical Indicators
Several technical indicators support the bullish outlook for GME:
.**Relative Strength Index (RSI)**: The RSI is currently trending upwards, suggesting increasing buying pressure.
**Moving Averages (MA)**: The 50-day MA is poised to cross above the 200-day MA, forming a 'Golden Cross', typically a bullish signal.
**Volume**: Trading volume has been increasing, confirming the bullish momentum as more traders participate in the rally.
#### Conclusion
GameStop ( NYSE:GME ) is currently in a technically significant phase, with multiple bullish indicators aligning to suggest further upward potential. The formation of a harmonic bat pattern, coupled with the recent falling wedge breakout and subsequent price movements, sets the stage for a bullish continuation. Traders should watch the key resistance level at $31.69 closely, as breaking this would open the path towards the first target at $37.78 and potentially the second target at $53.44.
As always, while the technical indicators provide a strong case for a bullish outlook, traders should remain vigilant of market conditions and news that could impact the stock's performance. Happy trading!
---
*Disclaimer: This article is for informational purposes only and does not constitute financial advice. Always conduct your own research and consult with a professional financial advisor before making any investment decisions.*

$GME the new hedge?I've analyzed the GameStop stock NYSE:GME and S&P 500 AMEX:SPY data from 2018 to 2022 to identify instances where GameStop's stock price rose significantly while the S&P 500 fell.
**Event 1:** January 28, 2021 - February 8, 2021
* GameStop's stock price rose by 73.5% from $18.92 to $32.97
* S&P 500 fell by 2.3% from 3,875 to 3,785
Event 2:** March 24, 2021 - April 2, 2021
* GameStop's stock price rose by 41.1% from $60.65 to $85.53
* S&P 500 fell by 3.9% from 4,196 to 4,034
Event 3:** July 19, 2021 - August 16, 2021
* GameStop's stock price rose by 34.4% from $111.67 to $150.67
* S&P 500 fell by 2.4% from 4,443 to 4,323
Event 4:** September 13, 2021 - September 28, 2021
* GameStop's stock price rose by 22.2% from $134.72 to $164.85
* S&P 500 fell by 2.1% from 4,532 to 4,435
I post more in-depth analysis on my socials, but I expect Game-Stop to thrive in the month of August 2024. Maybe Gamestop will become the new hedge against market turbulences. I am also curious to know how the CEO will put to use the money he has accumulated from the company, maybe me and Roaring Kitty become friends in the future

$GME - First signs of something possibly happeningHi guys,
My data didn't show the last couple of large spikes making me think they were completely related to DFV's forced MM share buying to hedge which is why i didn't post anything.
Now i'm finally seeing small signs of something possibly happening. Nothing concrete yet, still the begginings of what might be something.
My algo printed a buy for GME and it's the one that kinda predicted big pump to $75, also other data partially confirms this is not a false positive print.
I plan to open a small position at some point just in case. Won't be sharing the position here as GME is an important trade and i don't want my trade to be affected by various factors caused by me sharing my position.
imgur.com
My data shows a spike in the blue line data which is significant. It it continues rising, then we'll see a price pump eventually. That's all i can say for now.

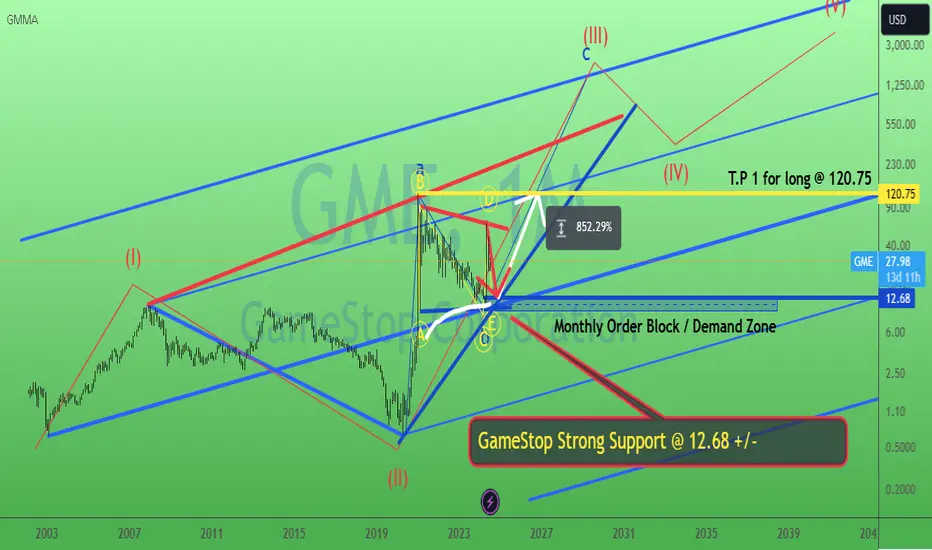
GameStop watch out 12.68. 18/July?24GME probably having strong support at 12.68 +/-. As this zone is a multi confluence of :- 1) Monthly 233 EMA (white MA) 2) Monthly Order Block/ Demand Zone 3) Median Line of Pitchfork (Thick Blue). There would a probably a good support If there was a pullback toward wave E of triangle (yellow circled ) @ 12.68..