GOATUSDT Retest at Key Demand Zone – Accumulation or Breakdown?🔍 Comprehensive Technical Analysis
After experiencing a prolonged downtrend since late 2024, GOATUSDT finally broke out of a long-term descending trendline in early May 2025 — a potential early signal of a medium-term trend reversal. However, the price has now pulled back, retesting a major support zone that coincides with the previous breakout structure.
---
🧱 Key Zone: Demand Area + Trendline Retest
Price is currently trading within a crucial demand zone between $0.090 – $0.100, which previously acted as a major resistance and now serves as support. This area is technically significant due to:
Confluence of horizontal support and the retest of the descending trendline.
A previous accumulation zone that led to a breakout.
Clear historical buyer reaction from this region.
---
📐 Price Structure & Pattern
Descending Triangle Breakout: Successfully broken to the upside in May.
Support-turned-Resistance-turned-Support: A classic structure flip.
Horizontal Consolidation: Price is ranging in a narrow zone, indicating either accumulation or distribution.
---
🐂 Bullish Scenario (Potential Rebound):
If the price holds and bounces with increased volume from the $0.090 – $0.100 zone, it could confirm a strong accumulation phase and initiate the next leg up.
🎯 Bullish targets:
1. $0.15745 — Minor resistance
2. $0.21071 — Psychological and technical resistance
3. $0.24889 — Fibonacci extension level
4. $0.41017 — Mid-term breakout target
> Bullish confirmation: Bullish engulfing or hammer candle with high volume from the demand zone.
---
🐻 Bearish Scenario (Breakdown Risk):
If the price breaks below $0.093 and closes with strong bearish volume, this may confirm weakness and trigger a deeper correction.
📉 Downside targets:
$0.06500 — Minor historical support
$0.04900 — Previous base level
$0.03550 — All-time low (critical support)
> Bearish confirmation: Clean breakdown followed by a failed retest back into the range.
---
📊 Strategic Summary:
GOATUSDT is currently at a pivotal decision point. The zone between $0.093–$0.100 acts as a battleground for bulls and bears. A bounce could signal accumulation and a bullish reversal, while a breakdown could lead to continuation of the bearish trend.
🎯 Key focus: Price action and volume reaction at the demand zone.
---
🧲 Bullish Narrative Catalysts:
Renewed interest in low-cap altcoins
Gradual increase in volume since the breakout
Selling pressure weakening near key support
#GOATUSDT #CryptoBreakout #TrendlineRetest #TechnicalAnalysis #AltcoinAnalysis
#DemandZone #SmartMoneyConcepts #BreakoutOrFakeout
Goatusdtsignal

GOAT / USDT : Watch closely for a breakdownGOAT/USDT - Watch Closely!
Currently testing the critical support trend line.
Bullish Scenario: If it holds here and bounces, we could see a potential upward move.
Bearish Scenario: A breakdown below this support would confirm further downside, and I'd be leaning bearish in that case.
Pro Tip: Wait for confirmation before entering – either a strong rejection off support for bullish entry or a clean break for a bearish setup.
Stay alert and trade wisely!

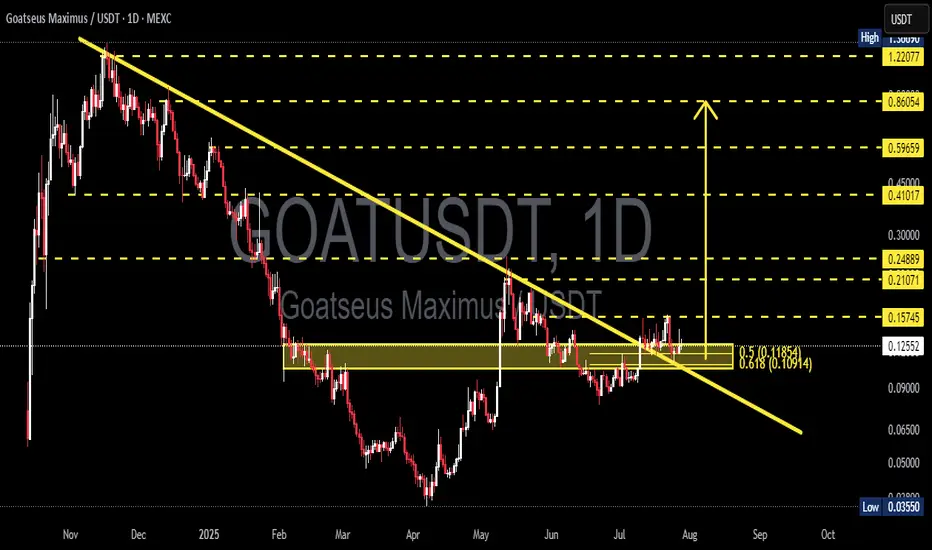
GOATUSDT Breakout Retest: Ready for the Next Bullish Leg?The daily chart of GOATUSDT reveals a significant technical development as price breaks out of a long-term descending trendline and is now performing a crucial retest of a key support zone. This movement is attracting attention from swing traders and mid-term investors alike.
---
🔍 Pattern Analysis & Market Structure
Main Pattern: Breakout from a long-standing descending trendline (yellow line) that has capped price action since November 2024.
Key Consolidation Zone: A visible accumulation area (yellow box) between 0.10914 (Fib 0.618) and 0.11864 (Fib 0.5), now being retested as new support.
Fibonacci Retracement: Applied from the peak to the bottom to identify logical target zones and potential resistance.
Breakout Confirmation: Price cleanly broke above the trendline, pulled back to retest support, and is showing signs of holding — a potential bullish continuation signal.
---
🟢 Bullish Scenario
If price holds above the 0.11–0.12 zone:
The breakout is validated and opens room for a continued rally.
Key upside targets based on Fibonacci levels:
🔼 0.15745 – first resistance
🔼 0.21071 to 0.24889 – mid-range resistance cluster
🔼 0.41017 to 0.86054 – longer-term price targets
Bullish confirmation via price action or volume spikes can solidify this outlook.
---
🔴 Bearish Scenario
If price fails to hold the support zone:
A breakdown below 0.10914 invalidates the breakout, indicating a false breakout trap.
Downside targets may include:
0.09000 – local support
0.06500 and 0.03550 – major historical support zones
This scenario would likely reignite bearish momentum.
---
⚠️ Conclusion
GOATUSDT is currently at a critical technical crossroad. The recent breakout and retest could signify a structural trend reversal. If the current support holds, the potential for upside is significant. However, a failure here could lead to deeper correction or consolidation.
---
📌 Key Levels to Watch:
Support: 0.109 – 0.118
Resistance: 0.15745 / 0.21071 / 0.24889 / 0.41017
#GOATUSDT #CryptoBreakout #TechnicalAnalysis #AltcoinSeason #TrendlineBreakout #SupportResistance #FibonacciLevels #SwingTrade #PriceAction #CryptoTA
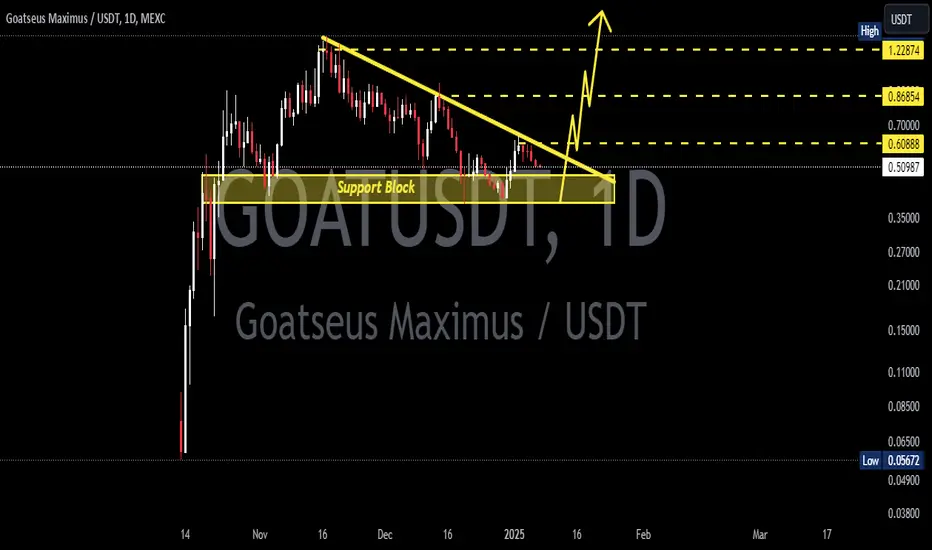
GOAT - LONGRisky but high profit entry. Be very careful. If it breaks that support it will go very low.
TP 1: 0.75
TP 2: 0.92
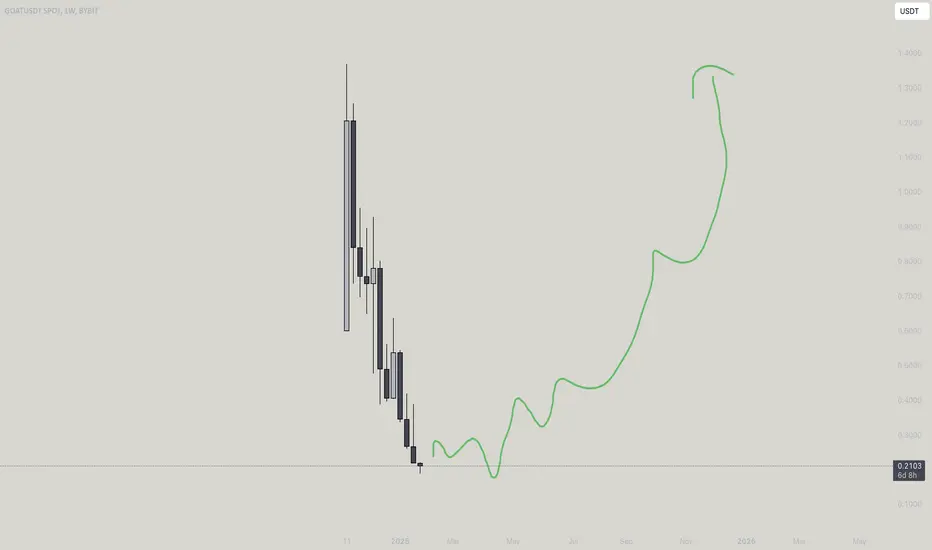
Trading 101 : How to be a GOAT and eat grass Well you tell me how? While i tell you its going to go 2 dollarssssss sooonn!
GOATUSDT 1DGOAT ~ 1D
#GOAT This is the main support block that has been keeping the price from dropping any lower. buy gradually from here, target 20%++
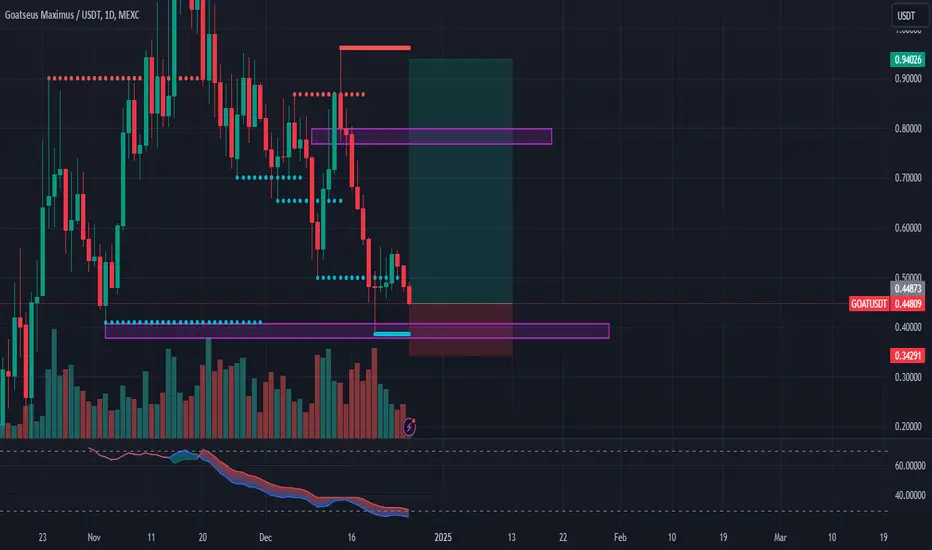
GOAAAT - SHALL you BUY?Well true enough goat would MAKE ONE BIG CANDLE to the 0.927 but still on buys bit low, so scalping short the purple line, the earlier purple line was invalidated. The green line was done but purple is yet to be
by short is to scalp the small little tp's to gwt the longs
